Author Archives: nlo-admin

U.S Dividend Watch List: June 6, 2015

Top Five Watch List Performance Review

In our ongoing review of the NLO Dividend Watch List, we have taken the top five stocks on our list from June 6, 2014 and have checked the performance one year later. The top five companies on that list can be seen in the table below.

Symbol Name 2013 Price 2014 Price % change
FCBC First Community Bancshares 14.25 17.35 21.8%
TGT Target Corp. 57.68 79.20 37.3%
ED Consolidated Edison 55.23 58.61 6.1%
SCL Stepan 53.93 52.35 -2.9%
STT State Street Corp. 67.00 78.52 17.2%
      Average 15.9%
         
DJI Dow Jones Industrial 16,924.28 17,849.46 5.5%
SPX S&P 500 1,949.44 2,092.83 7.4%

The top five stocks outperformed the market and the blue chip index by a wide margin. The two best performing stocks were Target (TGT) and First Community Bancshares (FCBC). Below is an excerpt from last year's posting:

First Community Bancshares (FCBC) topped our list. Though this regional bank didn't appeared on or top five in the previous week, the company play into the same theme of what could be the undervalued bank sector. We have limited scope on the view of the company but one prominent fact worth nothing is that the bank was founded in 1874. That alone tell[s] us that the bank has stood the test of time and was able to withstand many business cycle including the great depression and the recent credit crisis during which the company reduced dividend payout by 64%. Even so, the stock now yield 3.3% with less than 50% payout ratio. On book value basis, shares are trading at 20% discount to tangible book.

Target (TGT) remain in the top five on our list. The stock appears to be forming a double-bottom pattern as long as the stock can hold above $55 level. Our fair value assessment place the stock at $75

We are lucky that the fair value assessment came quite close to what our research showed. First Community traded 20% below book value and the shares rose +21.80% over the year. Our fair value assessment of the stock was $75 and shares closed the week at $79.20.

U.S. Dividend Watch List: June 5, 2015

It was another turbulent week for the stock market. After dropping -1.1% in the prior week, the market declined another -0.7% this week. This minor correction provides a great opportunity to assess companies that are trading at or near the low. There are 82 companies in our full list but we have chosen to indicated only 33 companies which should be enough for everyone to start their research. Continue reading

Dow Jones Utility Average Downside Targets

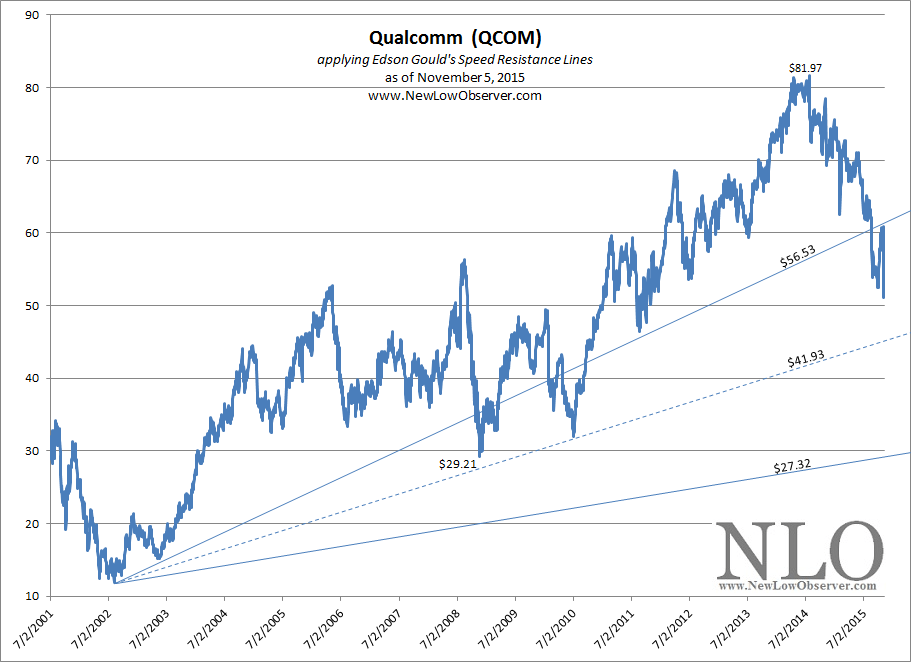
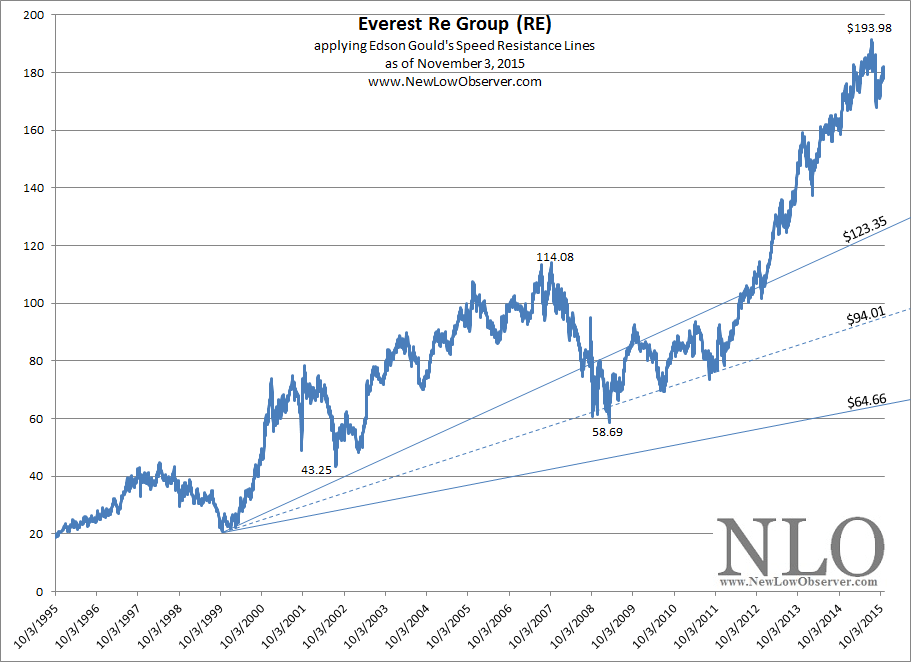
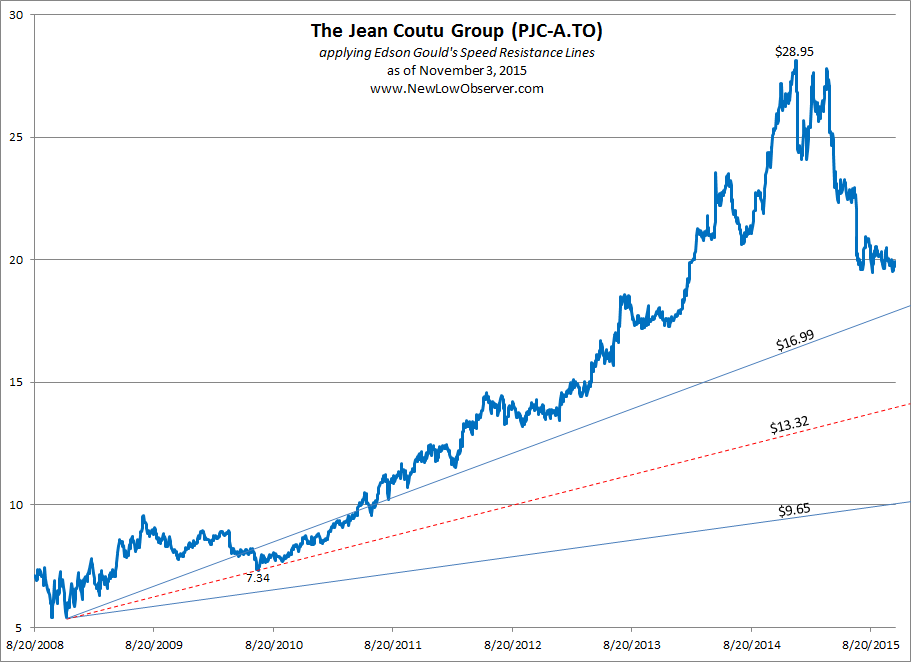
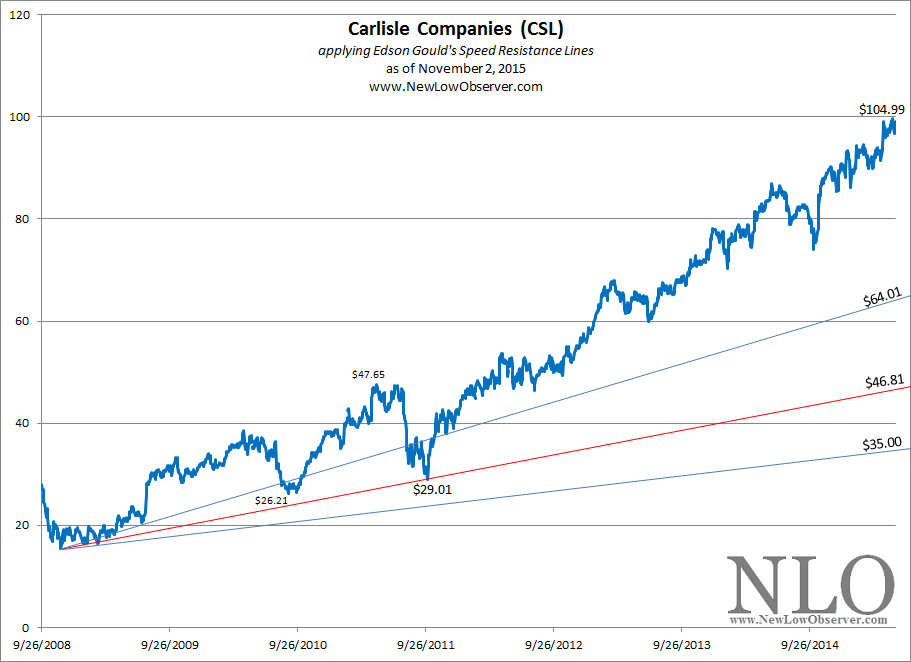
This posting will cover the downside targets for the Dow Jones Utility Average using Edson Gould’s Speed Resistance Lines [SRL].  The point of downside targets is to consider buying at predefined levels when and if those targets are achieved.  If the downside targets are not achieved then we patiently wait and focus our attention on other opportunities.

This posting is a follow up to our August 24, 2013 posting with SRL downside targets for the same index.  As the Utility index has increased above the 2007 peak and now is in a declining trend, we need to update the numbers in case the downside targets are achieved.  Below are the downside targets based on Edson Gould’s Speed Resistance Lines.

Gold Stock Indicator: June 5, 2015

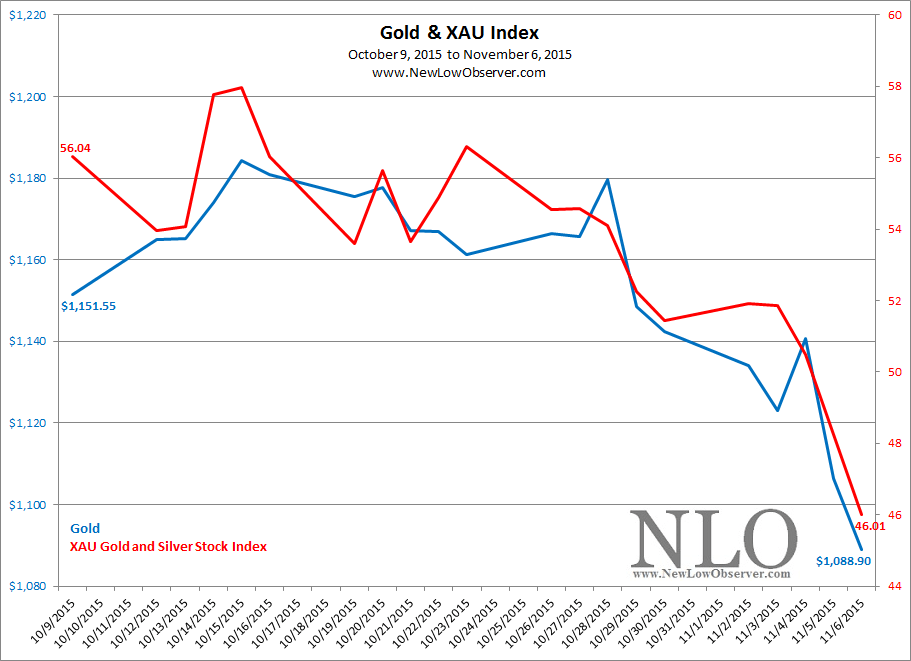
Gold fell hard this past week.  On the week, gold declined –2.25% while the gold stock index dropped –2.84%.

image

Although gold stocks fell more on a percentage basis, from a historical standpoint the metal declined by a greater magnitude as reflected in the Gold Stock Indicator below.

Hospitality Properties Trust Downside Target

We’re always hopeful and expectant about the future prospects of any investment that we make.  However, that doesn’t mean that we’re going to ignore the most pressing matter when investing which is assessing the downside risk.  Below is the downside risk assessment for Hospitality Properties Trust (HPT) based on the work of Edson Gould.

The first tool of Gould is the Altimeter.  This assesses a stock based on the stock price relative to the dividend that is paid.  In this case, HPT has come off of a recent high near 70.  This high matched the high of late 2006, the subsequent decline brought the stock price down nearly –80%.  We don’t think that it is realistic to believe that HPT will decline as in the period from 2006 to 2008.  However, we’ve outlined in red a low that we feel is reasonable if a decline were to take place.  This low is at the $21 level where there appears to be a common retracement point.

image

If worse comes to worse, HPT could decline to point A or $13.00.  If a repeat of the housing crisis were to take place then HPT could decline as low as point B or $4.67.

The other tool that Gould used was the Speed Resistance Line [SRL].  The SRL is ideal for stocks that increase significantly out of proportion to the general stock market.  As HPT has increased nearly twice that of the S&P 500, we feel that the SRL is the most appropriate assessment for downside risk.

image

In this case, the SRL indicates that the conservative downside target is $26.22.  In the previous decline of 2006 to 2008, HPT declined to the previous low set in 1999 at slightly below $5.00.  However, as we mentioned before, we don’t think that this time is anything like the rise and fall of the housing bubble.  Therefore, we’re looking for HPT to successfully breach the $26.22 level and retrace to the $18.86 level before a possible rebound.  Our experience has been for HPT to adhere to the ascending lines for most stocks that we have covered in the past.

Who is Edson Gould?

"Edson Gould spent over 60 years working in and studying financial markets. Gould studied the arts at Princeton, engineering at Lehigh (from where he graduated in 1922), and finance at New York University. In 1922, after working for a short time at Western Electric, he joined Moody's Investor Service as an analyst and later was editor of Moody's Stock Survey, Bond Survey, and Advisory Reports. In 1948, he began at Arthur Wiesenberger & Company, where he developed and edited the well-known Wiesenberger Investment Report and became a senior partner. He also was Research Director at E. B. Smith (which later became Smith Barney), and worked for Nuveen."

(source: Market Technicians Association. Gould, Edson Beers, Knowledge Base. Accessed April 26, 2012. link MTA reference.)

"Market technician Edson Gould always laughed at the idea of having a significant influence on the stock market, but his predictions were the most precise around. He pinpointed major bull markets and prophesied bottom-out markets as if he had his own peephole into the future. But in place of a crystal ball and wacky off-the-cuff schemes, his were smart, intensely researched and time-tested theories that made him a legend in the investment community."

(source: Fisher, Kenneth L.. 100 Minds That Made the Market. Business Classics, Woodside, CA. 1993. page 320.)

Medical Properties Trust Downside Targets

A technical review of the REIT Medical Properties Trust (MPW) applying Edson Gould’s Speed Resistance Lines is charted below:

image

The conservative downside target of $11.75 was achieved after the decline from the May 2013 peak.  The next downside target is at the mid level of $8.45.  The extreme downside target is $5.14.

In the period from July 21, 2011, MPW declined slightly below the mid level before rebounding.  We expect that, at the very least, MPW should retest the current mid level at $8.45.

If MPW were to decline in a similar magnitude, as from the prior peak of February 2007 to the low of March 2009, MPW would fall to $3.24.  However, the market environment was far out of balance in the real estate sector at the time and it is less likely that falling -80% is in the cards.  However, The extreme downside target of $5.14 would not be considered out of the range of possibility.

Who is Edson Gould?

"Edson Gould spent over 60 years working in and studying financial markets. Gould studied the arts at Princeton, engineering at Lehigh (from where he graduated in 1922), and finance at New York University. In 1922, after working for a short time at Western Electric, he joined Moody's Investor Service as an analyst and later was editor of Moody's Stock Survey, Bond Survey, and Advisory Reports. In 1948, he began at Arthur Wiesenberger & Company, where he developed and edited the well-known Wiesenberger Investment Report and became a senior partner. He also was Research Director at E. B. Smith (which later became Smith Barney), and worked for Nuveen."

(source: Market Technicians Association. Gould, Edson Beers, Knowledge Base. Accessed April 26, 2012. link MTA reference.)

"Market technician Edson Gould always laughed at the idea of having a significant influence on the stock market, but his predictions were the most precise around. He pinpointed major bull markets and prophesied bottom-out markets as if he had his own peephole into the future. But in place of a crystal ball and wacky off-the-cuff schemes, his were smart, intensely researched and time-tested theories that made him a legend in the investment community."

(source: Fisher, Kenneth L.. 100 Minds That Made the Market. Business Classics, Woodside, CA. 1993. page 320.)

U.S. Dividend Watch List: May 29, 2015

Top Five Watch List Performance Review

In our ongoing review of the NLO Dividend Watch List, we have taken the top five stocks on our list from May 30, 2014 and have checked the performance one year later. The top five companies on that list can be seen in the table below.

Symbol Name 2013 Price 2014 Price % change
TRMK Trustmark Corp. 23.15 23.85 3.0%
TGT Target Corp. 56.76 79.32 39.7%
STT State Street Corp. 65.27 77.93 19.4%
AIT Applied Industrial Technologies 47.62 42.37 -11.0%
SCL Stepan 53.52 51.46 -3.8%
      Average 9.5%
         
DJI Dow Jones Industrial 16,717.17 18,010.68 7.7%
SPX S&P 500 1,923.57 2,107.39 9.6%

Target (TGT) was the best performing with the shares gaining nearly +40% over the year. Coincidentally, our write up last year marked the low in Target's price. The excerpt below came from last year's post.

Target (TGT) doesn’t need any introduction. Also, readers may not need to be reminded of their credit card fraud problem that caused the stock to be down from the high of $73.50 to $56.75. While bad news will likely continue to linger, we believe that their best days are ahead and remain a shareholder in the company.

Our belief was that the credit card fraud issue was a one time problem that should not destroy the company's underlying fundamentals. At the end of the day, Target is a retailer and not credit card processor.

Continue reading

Gold Stock Indicator: May 29, 2015

Gold and gold stocks traded places in the last month with gold increasing from 1175.95 to 1191.40 while the gold stock index (Philadelphia Gold and Silver Stock Index) declined from 73.12 to 69.7o.  However dramatic the changes appear in the chart below, the actual change was +1.31% for gold and –4.67% for gold stocks.

image

The narrow range in the price of gold and gold stocks seems to indicate that there is a measure of price stability at the current levels.  Naturally, that all changes when new lows are achieved.  However, from June 2013 to the present, we have seen what could be called a basing in the price of gold and gold stocks.  This is difficult to perceive especially when we know that the stocks and metals have been much lower in the past.  Looking at the long-term Gold Stock Indicator puts into perspective where we are today.

Dow Theory: The Misunderstood Barometer

Dow Theory is a fickle beast.  While the theory is sound, those that interpret it have their challenges.  A recent article dated May 21, 2015 titled “Transportation Average – A Big Concern for Stock Bulls?” by Chris Ciovacco presents some of the difficulties with the topic of Dow Theory. In this article, we’ll attempt to clarify some issues that should be discussed when making interpretations of Dow Theory.

The article by Ciovacco starts off by pointing out the recent divergence between the Dow Jones Transportation Average and the Dow Jones Industrial Average.  A divergence exists when one index makes new highs or lows while the other index fails to go in the same direction.  According to Dow Theory, if there is a divergence, it could indicate that the previous trend will be reversed.  As the prior trend in the stock market from 2009 to 2015 has been bullish, the implication is that the bull market could be coming to an end.

image

In explaining whether investors should be worried about the “non-confirmation” exhibited by the divergence between the Industrial and Transportation Averages, the article identifies the period from 1989 to 1993 when there appeared to be a divergence between the same indexes.  However, at the time of the divergence, according to the author, the S&P 500 managed to gain as much as +25%.  What is not shown or discussed are the key indications of a bull or bear market in the period from 1989 to 1993.  These elements will complete a picture that is necessary for anyone hoping to understand and possibly benefit from Dow Theory.

Identifying the Bear Market

Below is a charting of the period 1989 to 1993 in smaller segments for a more accurate Dow Theory assessment.  First is the indication of a bear market based on Dow Theory which occurred on October 13, 1989.

image

Our ex post interpretation of when a bear market was signaled by Dow Theory is supported by the Dow Theorist Richard Russell in his Dow Theory Letters publication. In his official investment stance on October 4, 1989, Russell said:

image

This is contrasted by what Russell said in his October 18, 1989 posting:

image

Russell made clear that from a Dow Theory perspective, a bear market had been signaled.  As a side note, Russell’s PTI or Primary Trend Indicator did not confirm the bearish signal until February 7, 1990 (four months later).  The PTI is not a part of Dow Theory but has proven to be a useful market tool.

Identifying the Bull Market

Using our own ex post analysis of the charts of the Dow Jones Industrial Average and the Dow Jones Transportation Average, we find that a new Dow Theory bull market was signaled on January 18, 1991.

image

Richard Russell was suspicious of the Dow Theory bull market that was signaled on January 18, 1991 and chose to wait for his PTI to give the all clear.  Russell said the following on February 6, 1991:

image

But even the preceding commentary was buried by the following overriding thoughts by Russell:

image

The question is ultimately asked by Ciovacco, “Would it have made sense to sell all our stocks because the Dow Transports failed to make a new high?”  The point being, why get caught up in a “signal” that potentially will result in lost investment gains? After all, the S&P 500 index increased by +25% in the period when it appeared that there was a divergence between the Dow Jones Industrial Average and Dow Jones Transportation Average.

This is where a significant problem comes up in the analysis of Dow Theory.  First, if we assume that a divergence did occur in Ciovacco’s selected time frame, rather than a bear market indication, then an adherent of Dow Theory would accept that a divergence is merely a caution signal.  This would have meant that whatever the previous trend of the market was, it remains in place until a definitive reversal occurs.  In our most recent market action, a bull market was still the indication and thus there would be  no need “… to sell all our stocks…”

Another issue not mentioned is that Dow Theory does not give buy or sell signals as we pointed out in our July 25, 2011 article. Among the many things overlooked about Dow Theory is that it is intended to reflect the changes in the stock market, investment values, and the economy.  As a barometer, it merely indicates the direction that the stock market and economy might go three to nine months into the future. Those who take bull or bear market indications as buy or sell signals still need to be well versed in understanding values and compounding and their role in investing. If a person, not versed in values and compounding, believes that any indication means that they can haphazardly buy or sell stocks then they are most likely to suffer severe losses and quickly become disenchanted with the accumulation of assets.

Identifying Recessions

In the past, Dow Theory was often heralded as a peek into the future for the economy.  In the 1989 example above, the Dow Theory bear market preceded the National Bureau of Economic Research’s (NBER) definition of a recession by nine months.  Dow Theory signaled a bear market in October 1989 and the NBER indicated that a recession began July 1990.  However, the NBER announced their conclusion about when the recession began on April 25, 1991, a full year and a half after the Dow Theory bear market signal and nine months after their own designation of when the recession began.  Additionally, Dow Theory indicated that a new bull market was in place on January 18, 1991 or three months before the NBER announced that the recession ended in March 1991.

Final Thoughts

What some market bears would like to accomplish with Dow Theory is to anticipate scenarios where divergence leads to an actual bear market of significant magnitude like what happened in the period from 1972 to 1974.

DT '72

The decline experienced from the respective peaks was –59% and –44% for the Transports and Industrials.  Since the outcome of a divergence cannot be accurately anticipated, it is far “safer” to wait for the confirmation of the trend before considering any potential actions.  However, if investors had sold their stocks on October 13, 1989 and repurchased stocks on January 18, 1991 (and held until December 31, 1993), the gains would have been +40%, +41% and +76.04% for the S&P 500, Industrials and Transportation Index, respectively.

What some market bulls would like to accomplish without Dow Theory is not selling if the net effect is for the market to ultimately climb well beyond the point of the initial divergence.  As an example,  if we take the October 13, 1989 date and calculate the returns for the S&P 500, Dow Industrials and Dow Transports until December 31, 1993, we find that the returns were +39%, +46% and +25%, respectively.

Dow Theory only works as a barometer for the stock market when taken in the context of investment values and compounding.  As an indicator of coming recessions, as defined by NBER, Dow Theory has an unrivaled track record.  The translation of these ideas often get confused as recessions don’t necessarily result in jarring –50% declines in the stock market every time.

Our tactic on the divergence is to dump more funds into the cash portion of the brokerage account so that we can make large purchases if a precipitous decline ensues.  If a decline does not materialize, we will continue our slow and selective investment buying program for compounding purposes.

Transaction Alert

On Thursday May 21, 2015, we executed the following transactions:

Continue reading

Industrial Production Index

Below is a table with the number of instances when the Industrial Production Index declined at least five months in a row.  We have also noted whether or not there was a coincidence with the period of decline in the Industrial Production Index with the National Bureau of Economic Research (NBER) definition of a recession.

Analyst Estimates: May 15, 2015

Below are the price projections based on analyst earnings estimates for the first 20 stocks on our recent U.S. Dividend Watch List dated May 15, 2015. These estimates project the price change for the respective stocks in the next 12 months.

GMCR: Downside Targets

On October 25, 2011 when Green Mountain Coffee Roasters (GMCR) was trading at $63.85, we projected conservative and extreme downside targets of $59.93 and $37.21, respectively.  Subsequent price action for the stock brought the price as low as $17.11.  After achieving the downside target the stock rose as high as $158.87 by November 2014.  The potential gains of acquiring GMCR below either downside target was +165% and +326%.

The problem with this modeling of the past is having the fortitude of buying the stock and watching it fall –66% before the subsequent rise.  Can you handle a decline of –50% or more in your investments?  If you can’t sleep at night with losses of –50% or more then don’t bother reading any further as what follows is speculation of what would happen if history were to repeat (NOTE: history does not repeat).

Alternate reading on portfolio losses of –50% or more by Charlie Munger.

Dow Theory: Industrial Production Tipping the Scales

This is our first update to Dow Theory review since October 17, 2014.  At the time, we closed with the following commentary:

“All reasonable interpretations of Dow Theory should indicate that we are in a bear market.

“Most Dow Theorists would suggest that investors sell all stock holdings in order to avoid losses.  However, we only use Dow Theory as an asset allocation tool.  Therefore, we will add cash to our holdings and trim some positions.  Outright selling of all stock positions is not conducive to the concept of compounding income, which is our long-term goal.

“Finally, all is not lost.  In order to change the view that we are in a bear market, the Dow Industrials, Transports and Russell 2000 only need to exceed their previous all-time peaks.  This partially explains the reason why it may not be advisable to sell all positions based on a Dow Theory bear market indication.”

Our assessment of a Dow Theory bear market indication was supported by an October 19, 2014 posting by Dow Theorist Tim Wood.  In his review of Dow Theory, Wood said:

“This all said, on Friday, October 10, 2014, the Transports closed below their August 7th Secondary Low Point. On Monday, October 13, 2014, the Industrials followed with a close below their August 7th Secondary Low Point. In the wake of this development, I have sat quietly to see what, if anything, would be written on this development. The current Dow Theory chart can be found below. As a result of this joint close below the previous secondary low points, an orthodox Dow Theory Primary Bearish Trend change has been triggered (Wood, Tim. Dow Theory Update. October 19, 2014.)”

Seven months later, the changing market conditions indicate that commentary on Dow Theory is necessary.

Continue reading

U.S. Dividend Watch List: May 15, 2015

Top Five Watch List Performance Review

In our ongoing review of the NLO Dividend Watch List, we have taken the top five stocks on our list from May 17, 2014 and have checked the performance one year later. The top five companies on that list can be seen in the table below.

Symbol Name 2013 Price 2014 Price % change
AIT Applied Industrial Technologies 45.78 42.66 -6.8%
STT State Street Corp. 63.19 77.85 23.2%
EV Eaton Vance Corp. 35.71 41.30 15.7%
TR Tootsie Roll Industries Inc 28.01 30.90 10.3%
TRMK Trustmark Corp. 22.95 23.95 4.4%
      Average 9.3%
         
DJI Dow Jones Industrial 16,491.31 18,272.56 10.8%
SPX S&P 500 1,870.85 2,122.73 13.5%

Applied Industrial Technologies (AIT) topped our list last year. While the stock traded near the 52-week low, it doesn't imply that it should be bought but rather the beginning for research. We stated the following about the stock last year.

A quick glance at AIT and we find that the company is trading about 17% below its 5-year average, on P/E basis. On a cash flow basis, the company is trading about 20% above the 5-year average (figure from Morningstar). A secondary source of valuation we refer to is Value Line Investment Survey, which suggests a fair value of $38.50 which is 15% below the current price.

AIT traded down as low as $40 then rebounded back to the $42 range. With shares fallen by -7% year-over-year and is trading closer to the fair value estimate, now might be a better opportunity to start your research.

The best performing stocks from the top five was State Street (STT). We didn't highlight many things about the stock but only the fact that it was trading slightly above its 5-year average based on fundamental figures such as Price/Earning and Price/Book. The fact that State Street rose +23% despite trading at more than its historical average proves that historical figures are only part of the story. Continue reading

Canadian Dividend Watch List: May 15, 2015

Below is the Canadian Dividend Watch List and the estimated change over the next 12 months.