-
Topics
Archives
-
-
Recent Posts
-
-
-
-

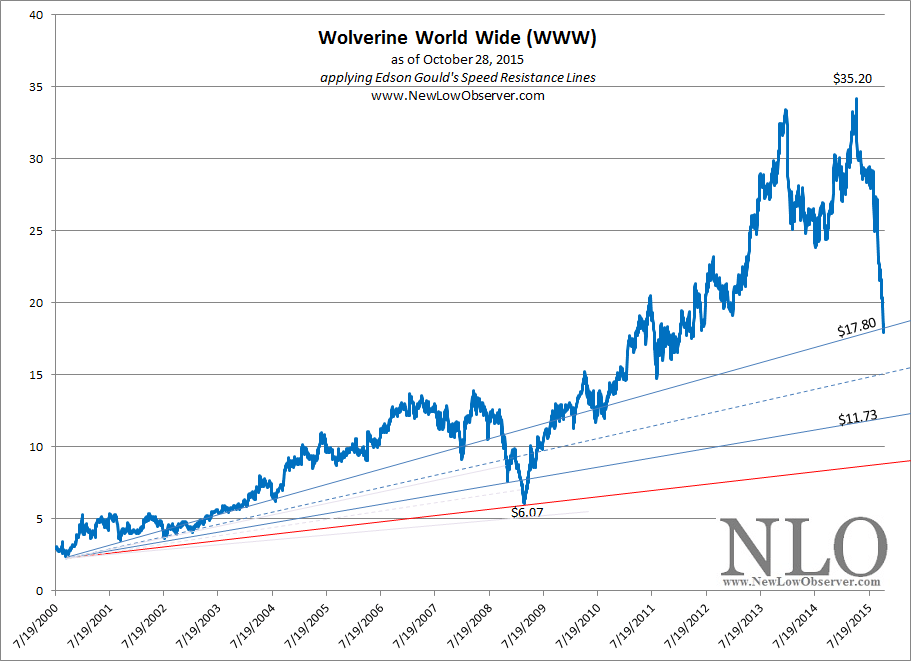
Posted in downside, Edson Gould, speed resistance line, SRL, Wolverine World Wide, WWW
Toronto Stock Exchange
The accompanying chart of the Toronto Stock Exchange from 1979 to the present includes the work of Edson Gould’s Speed Resistance Lines (SRL).
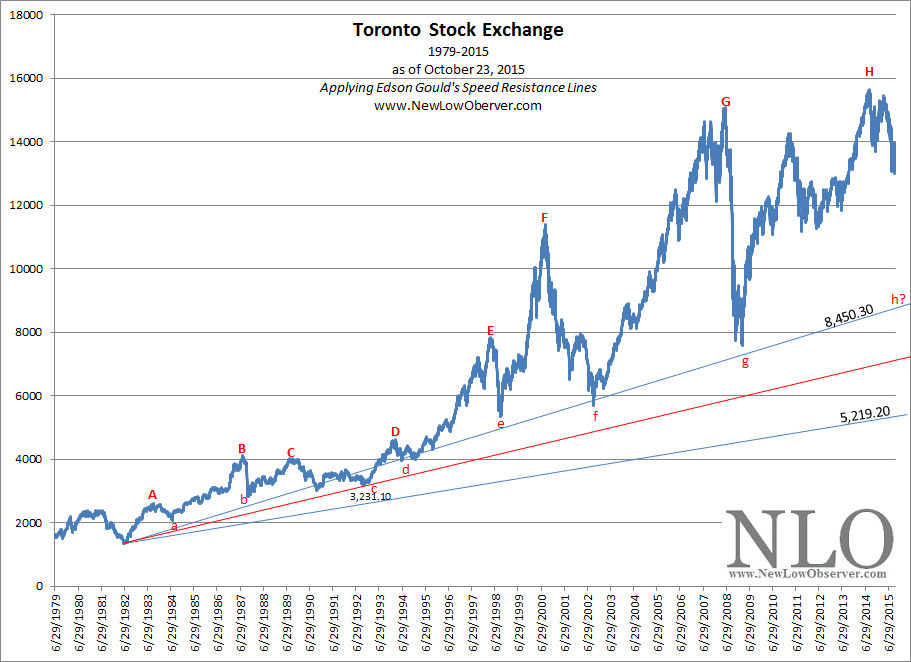
What stands out is the coincidence of previous peaks, indicated by uppercase letters of the alphabet, being followed by declines to the current conservative downside target (8,450.30), at the respective lowercase letters. The work of Gould isn’t a cure-all for what might happen in the stock market, however, it does provide a reasonable guideline to work from.
The coincidence of seven prior declines to the 8,450.30 level makes us wonder if the Toronto Stock Exchange has any chance to decline to the conservative downside target of 8,450.30, at (h). It may asking much to suggest that the Toronto Stock Exchange could fall another -39.44% but if it does for some unknown reason then it would be good to have your resources (cash) at the ready.
Top Five Watch List Performance Review
In our ongoing review of the NLO Dividend Watch List, we have taken the top five stocks on our list from October 24, 2014 and have checked the performance one year later. The top five companies on that list can be seen in the table below.
| Symbol | Name | 2013 Price | 2014 Price | % change |
| SUSQ | Susquehanna Bancshares | 9.18 | 14.20 | 54.7% |
| IBM | IBM | 162.08 | 144.68 | -10.7% |
| FNFG | First Niagara Financial Group | 7.30 | 10.64 | 45.8% |
| MCD | McDonald's Corp. | 91.67 | 112.59 | 22.8% |
| SCL | Stepan | 43.47 | 52.59 | 21.0% |
| Average | 26.7% | |||
| DJI | Dow Jones Industrial | 16,805.41 | 17,646.70 | 5.0% |
| SPX | S&P 500 | 1,964.58 | 2,075.15 | 5.6% |
Prior Year Review
Susquehanna Bancshares (SUSQ) and First Niagara Financial (FNFG) were the clear winners from this watch list. We were lucky enough to own some Susquehanna in some of our personal accounts and benefitted from the take over. Regarding the two companies, we said the following:
Susquehanna Bancshares (SUSQ) and First Niagara Financial (FNFG) are the two that appeared on our top five companies. Susquehanna missed their earning estimate by $0.02 while First Niagara fell on unexplained write-down. Both companies are trading at deep discount to its tangible book value but that is subject to change based on the recent quarterly earning. Despite that, we do own shares (in some of our personal account) of Susquehanna Bancshares which was acquired at roughly 13% above the current price. The large discount to book value provided a good margin of safety and a stronger balance sheet after dividend cut several years back were the primary reason to be long.
Next up we'll turn our focus to McDonald's (MCD). Many of us can agree that the company can be classified as 'blue-chip' stock. However, the company has lost their way and many of us (myself included) infrequently dine there. To get a quick burger, we choose alternatives. The point is, competition is heavy in the fast food space and bad news always seems to circle McDonald's. One year ago, these were the headlines that put McDonald's on our watch list.
Despite the negative news, McDonald's rose +22.8% excluding the 3.53% dividend yield the company was paying. In addition, the board approved a 5% dividend hike. Assuming you purchased the stock a year ago, your yield on cost would be 3.7%. The point is, to achieve higher expected returns, one has to make an investment in the face of negative news. No one could have predicted then that the company would change their strategy and start serving breakfast all day. Even so, there is no telling that the company can execute on that strategy.
U.S. Dividend Watch List: October 23,2015
It was another good week for the market as the S&P 500 increased +2% which erased the losses for the year. As a by-product, the number of companies on our watch list has declined. There are 39 companies on our watch list this week but we've filtered them down to 18. Continue reading
It was a good week for the bull as the market gained +0.9%. With earnings season right upon us, we are expecting this October to be a volatile month so be on the look out for the 28 companies below. Continue reading
The market continued its down draft in September. Long-term investors should be very excited to see the market pull back. Our Coppock indicator is approaching a level we haven’t seen since 2008. As a reminder, the Coppock Curve serves as a buy signal when they it turns upward after moving into negative territory.
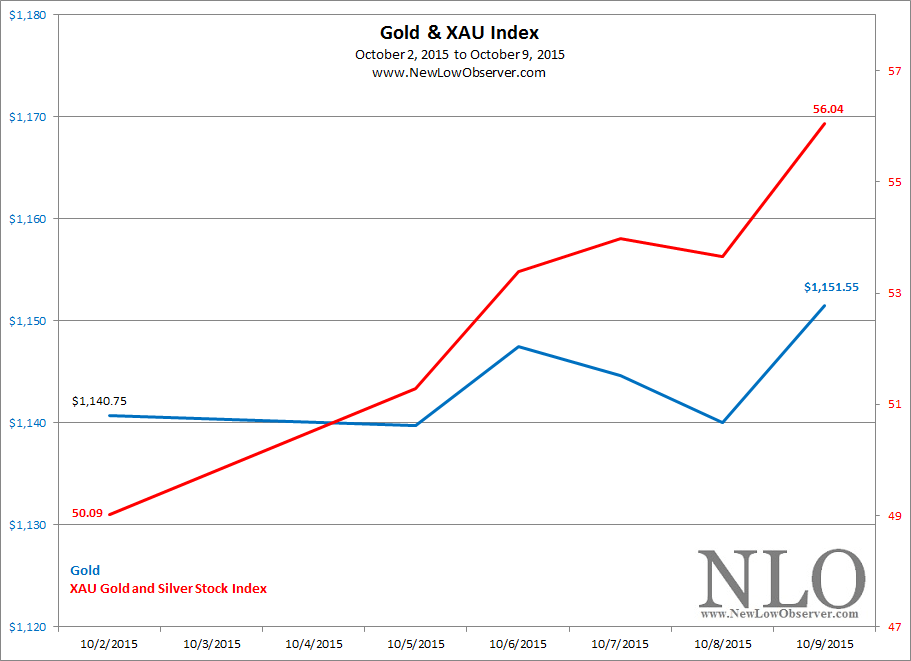
It was a tale of two markets with the price of gold increasing less than 1% while gold stocks increased +11.87%.
The stock of Illumina Inc. (ILMN) is experiencing some major moves to the downside since peaking in July 2015. After the high of $242, Illumina has declined -39%. As a component of the Nasdaq 100 index, we think that ILMN is worth watching to see if it achieves any of the downside targets that are outlined by Edson Gould’s Speed Resistance Lines (SRL).
On October 6, 2015, we executed the following transaction(s):
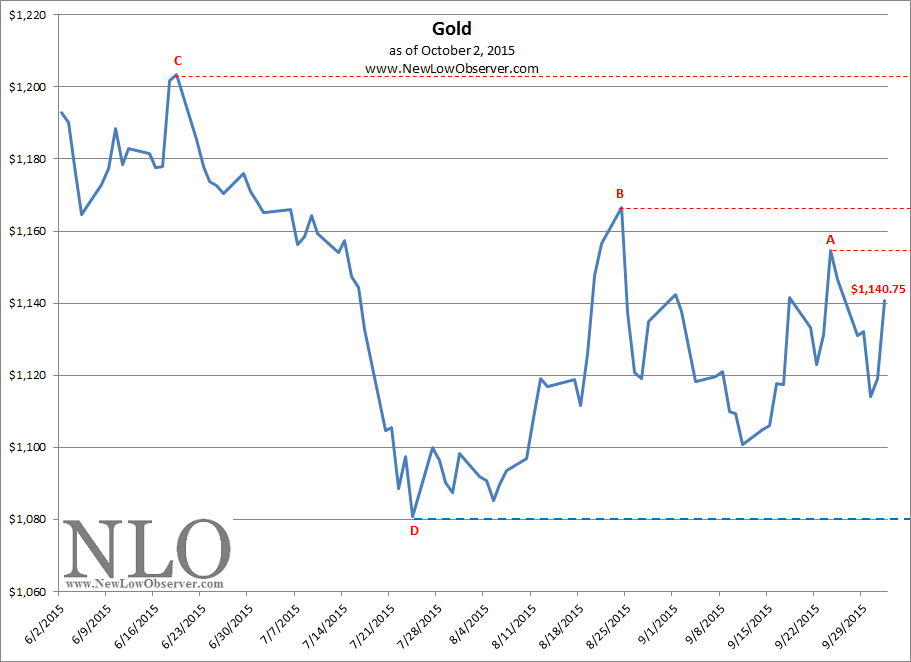
Since August 13, 2015, the price of gold has increased by +2.15% while the Philadelphia Gold and Silver Stock Index has declined –2.13%.
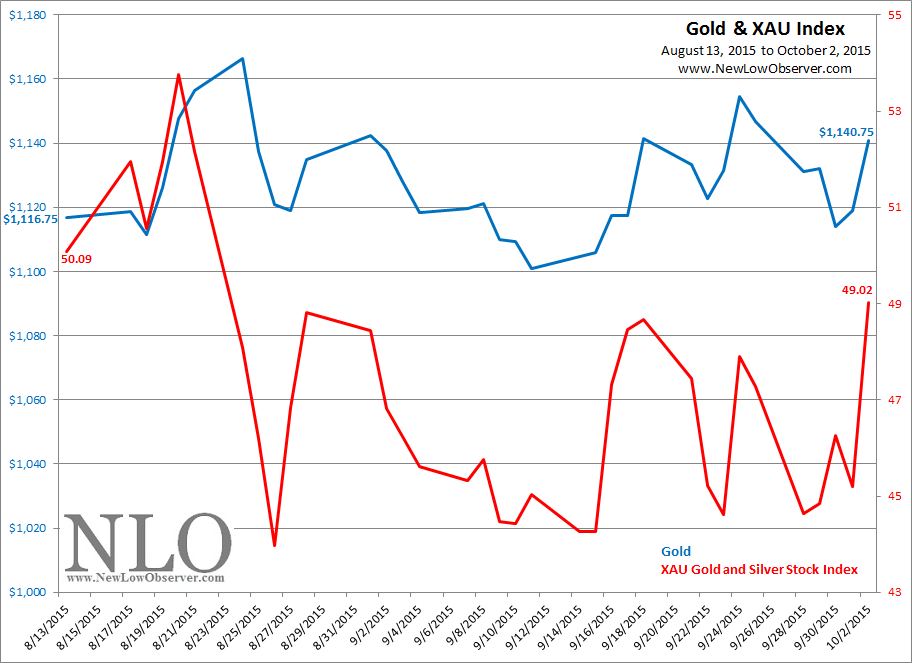
The price of gold could be considered to be on a tear given the fact that it isn’t falling, at the moment.
The market roared back this week and started the month of October strong. However, this is after a 7% decline in 3rd quarter. Trading this market can be difficult but long-term investors should find some value from out watch list. Below, you will find 39 companies that may be worth exploring. Continue reading
On October 8, 2014, when GoPro (GPRO) was trading at $89.93, we said the stock had a conservative downside target of $68.93 and an extreme downside target of $31.28. On December 23, 2014, after falling to the mid-range target of $45.50, we thought that the rout in the stock was over, for the most part. Although we thought that there was resistance at the $60 level, we figured an investment from the December 23rd level was acceptable with only a portion of the intended investable funds. We suggested “…putting only ¾ of the intended amount into GPRO with the remaining ¼ for the ‘unlikely’ event of falling to $31.28.”
Unfortunately, GPRO was never able to sustain the initial $60 level and fell as low as $37 before making a discernable rebound. It was from this level ($37), that GPRO did make a surge to $65. However, the $65 level was not to last as GPRO declined to the extreme downside target that was indicated as early as October 2014.
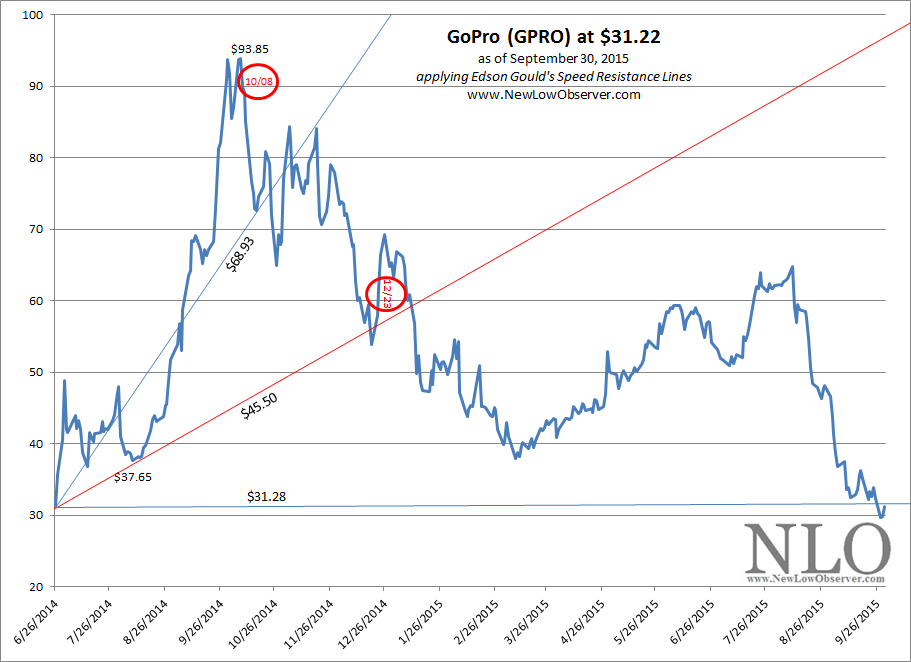
Now that GPRO has declined to the extreme downside target, a cursory review of Value Line Investment Survey is in order. Based on the October 2015 Value Line, GPRO is short on meaningful data. However, the analyst for Value Line has the following thoughts:
The analyst for Value Line has the closing remark that “…the recent price correction may afford risk-tolerant accounts an attractive entry point…” At the current price, we can’t argue about attractiveness but the future risks are the only concern.
Posted in GPRO
On September 23, 2013, the committee that makes changes to the Dow Jones Industrial Average added and dropped three companies from the index. The three companies dropped were Alcoa Co. (AA), Hewlett-Packard (HPQ) and Bank of America (BAC). The three companies added to the index were Nike (NKE), Goldman Sachs (GS) and Visa (V). Below is the price performance of all six companies since those changes to the Dow Jones Industrial Average were made.
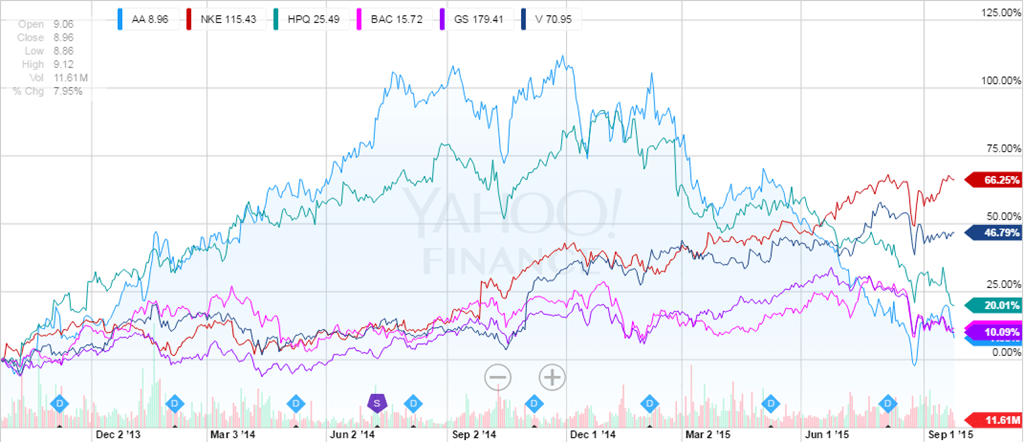
Worth noting is the fact that Alcoa Co. and Hewlett-Packard exceeded the price performance of all three additions to the index until June 2015. Nike and Visa have recently achieved outperformance of all three stocks dropped from the index, however, if the current decline in the stock market continues, we suspect that the recent gains of Nike and Visa could be short lived, until the eventual rebound in the market.
On March 19, 2015, Apple Co. (AAPL) was added to the Dow Jones Industrial Average while AT&T (T) was dropped from the index. The performance of the two stocks since that time shows Apple down –10.06% and AT&T down –3.10%.
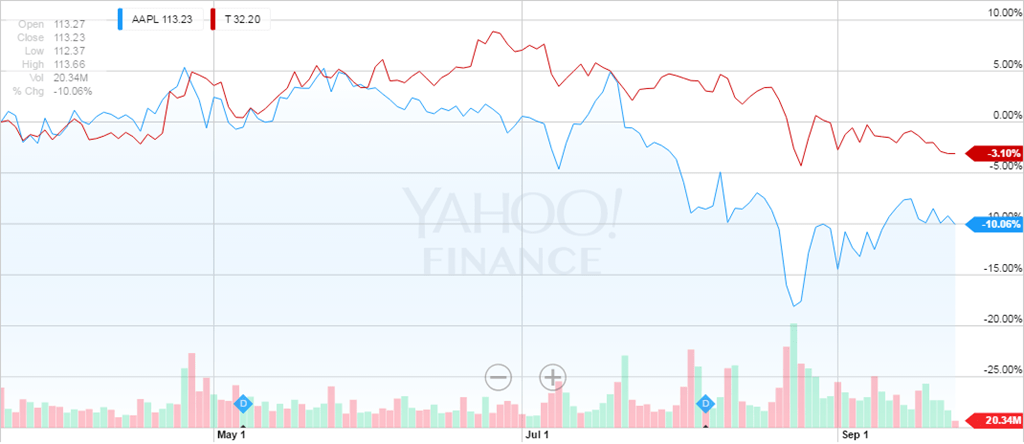
The outperformance of stocks dropped from an index is not as unusual as it would seem. Typically, index managers tend to drop stocks that appear weak in price performance and going through a transition to resolve the internal issues contributing to their weakness. At the same time, stocks that are added to an index just coming off a period of exceptional growth and are about to experience a readjustment period resulting in a decline in their stock price. The result is stocks being added to the index will adjust lower in price while the timing of the companies dropped from the index coincides with a resurgence in earnings surprises and increased stock price.
Posted in Additions and Deletions
On December 9, 2010, we wrote an article titled “Real Estate: The Verdict Is In”. At the time, we said the following:
“As we come to the close of 2010, it appears that based on the narrow scope of sources that we’ve selected, the bottom in real estate has come and gone.”
Our call of a bottom was a bold claim at the time because of the following points against a rise in real estate:
Each of the above ideas were probably legitimate on their own and in a vacuum. However, financial markets tend to discount all of the issues that are generally known. Only a “black swan” event can take away the discounting mechanism of the markets. Thankfully, it is precisely because a “black swan” can’t be predicted that makes it out of the purview of any market analysis.
Through the passage of time, we have been able to see that our guess for a bottom in the real estate cycle was fairly close, based on the indicators presented at the time. This article will review the indicators that we cited in previous works. Finally, we’ll review the real estate cycle as described by Roy Wenzlick, which is the basis for much of our projections on this topic.
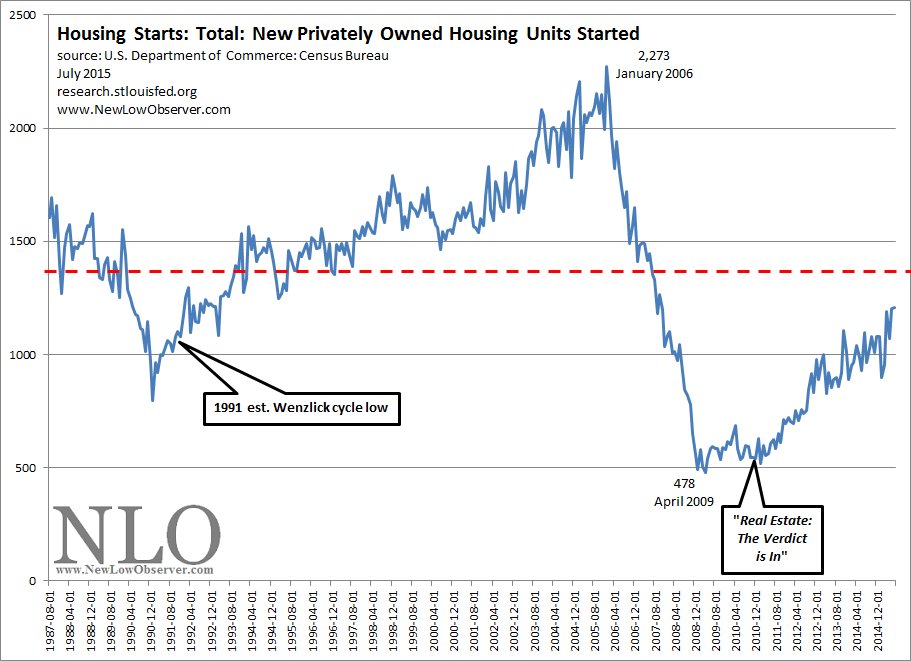
The first indicator is the Housing Starts of New Privately Owned Housing Units. Since our December 2010 article, the indicator has increased +124.44%, or more than double.
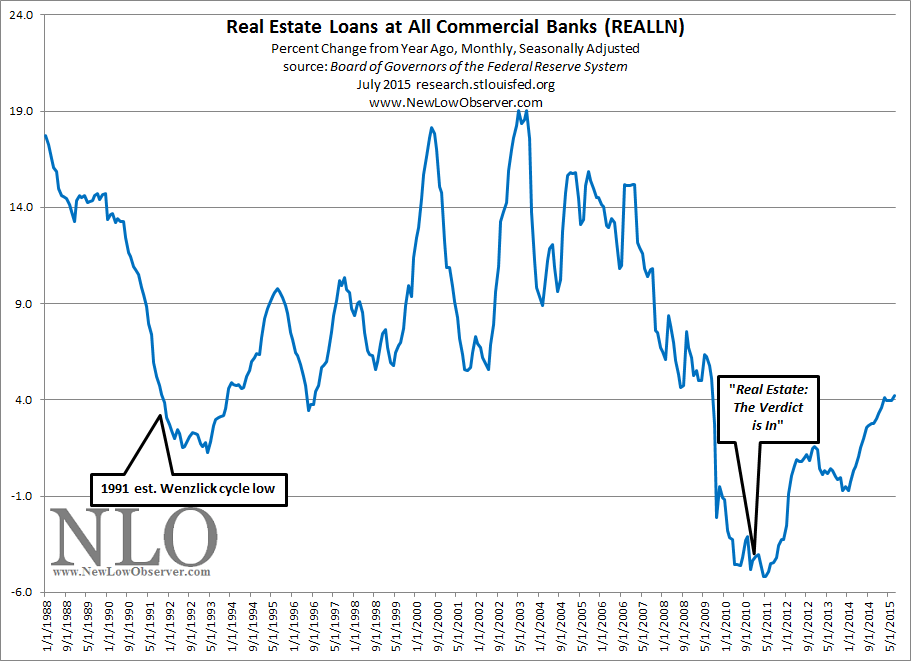
The next indicator is the Real Estate Loans at All Commercial Banks. This indicator should be clear, if banks aren’t lending then homes won’t be sold.
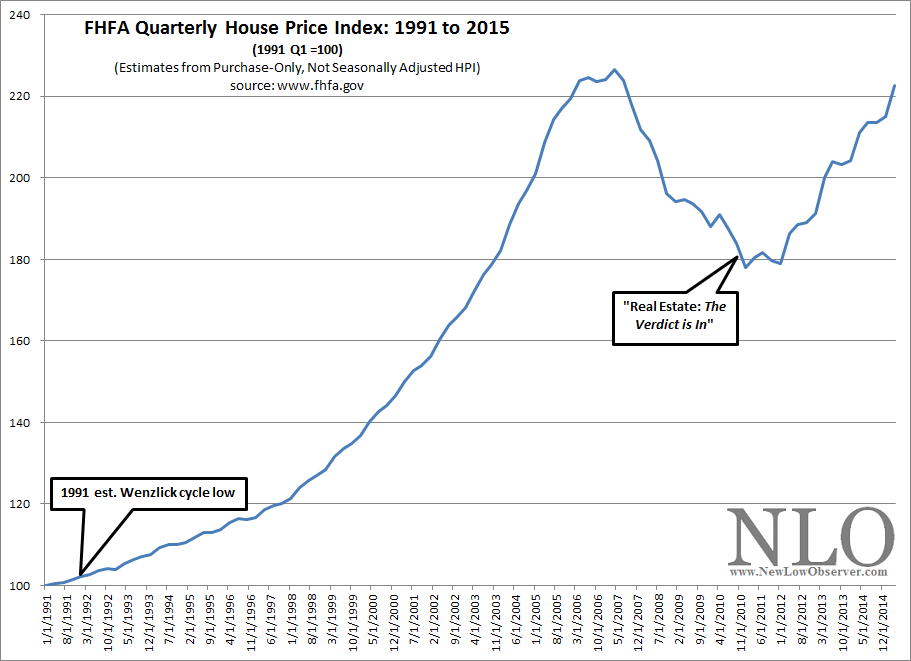
The next indicator plots the price of real estate for the U.S. Although there are regional differences, the general trend is the most important for assessing if a “rising tide is lifting all boats”.
Real Estate Cycle Analysis
Below we’ve included a revised and adjusted chart of Roy Wenzlick’s cycle of real estate based on the low of 2010/2011.
Posted in Black Swan, cycle analysis, Dakin, Dewey, real estate, Secular Bull Market, Wenzlick
The performance of the Canadian Watch List from September 2014 is listed below:
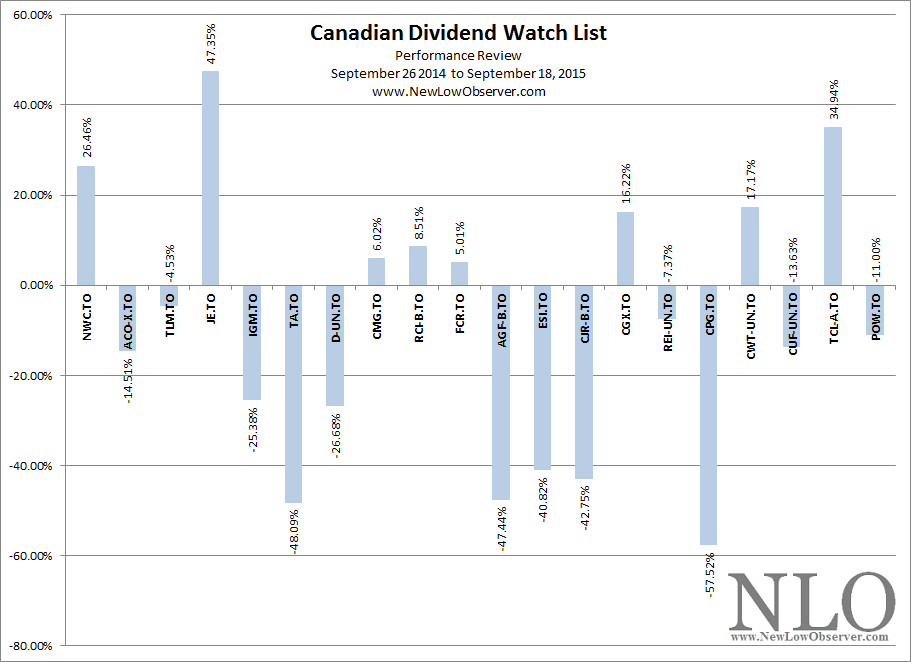
From left to right, the first five stocks on the list averaged a gain of +5.88% in the last year while the entire list averaged a loss of –8.90% compared to the Toronto Stock Exchange decline of –7.95%.
Of the companies listed, Just Energy (JE.TO), Transcontinental (TCL-A.TO) and North West Co. (NWC.TO) were the top three performers with an average gain of +36%. At the bottom of the performance scale were Crescent Point Energy (CPG.TO), TransAlta (TA.TO) and AGF Management (AGF-B.TO) with an average loss of –51%.
Canadian Dividend Watch List September 2015