
Author Archives: nlo-admin

Gold Stock Indicator: July 17, 2015

Since June 29, 2015, the price of gold has declined –3.67% while the gold and silver stock index (XAU) declined -15.19%.

image

The recent declines are nothing compared to the full extent of the carnage that has been witnessed since the 2010 peak in gold stocks which have fallen –76%.  Meanwhile, the price of gold from the 2011 peak has declined -40.22%.

image

This decline is very much similar to the percentage declines experienced in the period from 1974 to 1976 when gold fell –44% and gold stocks fell –68%.

image

The following two quotes from Richard Russell (near the low in the gold market) seem appropriate given the current market conditions:

“The great fortunes have been made in the market by buying shares that no one wanted. S. African golds are nearing that point now. For those willing to "buy'em and put'em away," for those willing to write off a possible loss against a possible major gain, many of the marginal S. African gold shares are interesting now (Russell, Richard. Dow Theory Letters. April 2, 1976. page 6.).”

“In August of 1975 the golds fell out of the triangle and entered into one of the worst bear market collapses I have ever seen. By mid-1976 about 75% of all gold mine values were wiped out. Guessing at bear market bottoms for stock groups is always a hazardous occupation. Certainly, the action of the last month must be considered a panic in gold shares.  Bear markets often end with downside panic action. Therefore, in view of the time element of the bear market, the severity of the recent chaotic panic action, and the current gold pessimism, I am guessing that we will see the lows for most gold shares in this area. But I would say that holding gold shares is an uninteresting proposition unless relative strength for the group turns bullish. It hasn’t yet (Russell, Richard. Dow Theory Letters. July 30, 1976. page 5.).”

Quote of the Day: Robert Rodriguez

“The problems of tomorrow are being created today as we write this letter. Furthermore, there are risks in the balance sheets that we cannot see. Companies such as Fannie Mae (FNM), Freddie Mac (FRE) and American International Group (AIG) are now showing financial strains from previous actions taken to enhance the look of their financial reports. We are also concerned that many of these companies have used financial derivatives that are totally unanalyzable by outsiders, since there is insufficient information disclosed in their financial statements for a risk assessment.”

Robert L. Rodriguez. Letter to Shareholders. April 16, 2005. Page 4.

  • Fannie Mae: Bailed Out/Bankrupt 2008
  • Freddie Mac: Bailed Out/Bankrupt 2008
  • AIG: Bailed Out 2008

U.S. Dividend Watch List: July 10, 2015

Top Five Watch List Performance Review

In our ongoing review of the NLO Dividend Watch List, we have taken the top five stocks on our list from July 11, 2014 and have checked the performance one year later. The top five companies on that list can be seen in the table below.

Symbol Name 2013 Price 2014 Price % change
ROST Ross Stores 32.90 50.86 54.6%
FCBC First Community Bancshares 14.14 18.39 30.1%
SCL Stepan 52.80 50.50 -4.4%
CHFC Chemical Financial Corp. 27.49 33.21 20.8%
WWW Wolverine World Wide 26.00 29.15 12.1%
      Average 22.6%
         
DJI Dow Jones Industrial 16,943.81 17,760.41 4.8%
SPX S&P 500 1,967.57 2,076.62 5.5%

The top five companies combined for an average gain of +22.6%, far exceed the performance of the market. The biggest gainer was Ross Stores (ROST) which gained +54.6%, split adjusted. The worse performer was Stepan (SCL) which lost -4.4% over the year.

U.S. Dividend Watch List: July 10, 2015

This week, we highlight 27 companies that are on our dividend watch list. Continue reading

Dow’s Theory on Growth

Charles H. Dow says slow and steady wins the race

"Confidence has to be earned and has been truthfully pronounced a plant of slow growth (Dow, Charles H. Wall Street Journal. Review and Outlook. October 12, 1900)."

National Dairy Products: 1927-1937

The chart below highlights two issues:

1) How long did it take for a stock to get to breakeven?

In the case of National Dairy Products, the stock did not get to breakeven by the 1937 peak. National Dairy declined approximately -90% in price from 1929 to 1933.  From late 1933, National Dairy rose as much as +180% to the 1936 peak. 

2) What happened to the dividend during the stock market crash and "Great" Depression?

In spite of the market decline from the 1929 peak, National Dairy’s earnings continued higher by the end of 1930.  Once earnings started to slide in 1931, the pace of dividends continued to move higher.  In 1932, it became apparent to management that the dividend policy had to be reduced.  The pace of the decline in dividends tracked closely the decline in earnings.  However, when earnings started to increase, the dividend was not pushed higher until two years after the trend reversed in earnings.

The change in dividend policy is a great example of management’s expectation of future prospects.  However, when a policy of cutting the dividend started, in 1932, most dividend investors were probably becoming fearful of the prospects going forward and reacted by selling their stock.  In reality, 1932-1933 was the time to start accumulating shares of the stock.

image

Nasdaq 100 Watch List: June 26, 2015

Below is the performance of the stocks from our June 20, 2014 Nasdaq 100 watch list compared to the Nasdaq 100 Index gain of +17.84% over the last year.

Symbol 2014 2015 actual chg
LMCA 35.07 37.26 6.24%
WFM 39.22 40.35 2.88%
COST 115.36 138.06 19.68%
BBBY 60.07 71.11 18.38%
SPLS 11.19 16.05 43.43%
FOSL 105.6 71.79 -32.02%
VRSK 60.46 74.51 23.24%
ROST 33.65 50.27 49.39%
DLTR 53.68 81.66 52.12%
EBAY 49.34 61.03 23.69%
DISCA 37.71 33.84 -10.26%
CA 28.73 29.89 4.04%
NTAP 35.79 32.36 -9.58%

Below is the analyst estimates from last year compared to the actual performance of the stocks.

image

At the extremes we see that Liberty Media (LMCA), Whole Foods (WFM), Fossil (FOSL), Discovery Communications (DISCA) and NetApp (NTAP) went in opposite directions of the analysts.  At the same time, the expectations for the remaining stocks didn’t quite come as close as anticipated.  The lone exception is Ebay (EBAY) which was expected to gain +16.34% as opposed to +23.69% of actual change.

Nasdaq 100 Watch List

Below is the latest list of stocks that we believe present the best investment opportunities from the Nasdaq 100 Index.

U.S. Dividend Watch List: June 26, 2015

Top Five Watch List Performance Review

In our ongoing review of the NLO Dividend Watch List, we have taken the top five stocks on our list from June 27, 2014 and have checked the performance one year later. The top five companies on that list can be seen in the table below.

Symbol Name 2013 Price 2014 Price % change
ROST Ross Stores 32.90 50.27 52.8%
SCL Stepan 52.35 55.00 5.1%
C Citigroup Inc 47.14 56.34 19.5%
WWW Wolverine World Wide 26.19 29.34 12.0%
FCBC First Community Bancshares 14.38 18.52 28.8%
      Average 23.6%
         
DJI Dow Jones Industrial 16,851.84 17,946.68 6.5%
SPX S&P 500 1,960.96 2,101.61 7.2%

Out top five companies surpassed the market performance by a wide margin. The overall gain was +23.60% compared with +7.20% for the S&P 500.

Ross Stores (ROST) was the largest contributor with a +52.8% gain. ROST also did a 2-to-1 split on June 12th of this year. Our assessment of Ross was inaccurate when we said that the stock doesn't have enough margin of safety at the current level. However, we may have identified a key attribute for stocks that may outperform the market. One of the biggest takeaway is the fact that ROST raised its dividend by +17% while maintaining a low payout ratio of 19%. The fact that the dividend yield was only 1.12% confirms our theory that the dividend growth and sustainability is more important than absolute yield.

Of the top five, Stepan (SCL) was the worst performer. The street had an optimistic view of the stock and expected it to grow net income by +36%. This made Stepan's forward P/E of 9 very attractive. However, that all depended on one important fact, that the net income must rise by more than a third. Because the stock was trading at its 5-year high on P/E, any earnings miss would not be good. When Stepan reported earnings in October 2014, the street expected EPS to come in at $0.89 but the actual result was $0.68. The stock fell from $52 to $38. Next, the inevitable event occurred, analysts revised their estimate downward.  Stepan's EPS came in at $0.38 in the February quarter, above the street's estimate of $0.35. Three months later, EPS came in at $0.90 when the street's estimate was $0.68. Shares rose back from $38 to $55. SCL_6.27.2015

U.S. Dividend Watch List: June 26, 2015

There are 33 companies on our watch list. Continue reading

Gold Stock Indicator: June 26, 2015

Since our last Gold Stock Indicator posting, the price of gold has increased <1% while the Philadelphia Gold and Silver Stock Index (XAU) declined –4.49%.

image

Below are is the GSI for Barron’s Gold Mining Index from 1973 and XAU Index from 1983.  Based on these two charts, an investors can easily discern where we are from a valuation perspective.

Transaction Alert

On Friday June 26, 2015, we executed the following transactions:

Continue reading

Borden: 1927-1937

The chart below highlights two issues:

1) How long did it take for a stock to get to breakeven?

In the case of Borden, the stock did not recover to the 1929 peak of $92 by the end of 1937. In fact, by 1954, Borden got as high as $74. Borden was later acquired in a KKR deal struck in September 1994. Buyers of Borden in 1934 did very well, however, recovery was only achieved in due time through the virtue of total return.

2) What happened to the dividend during the stock market crash and "Great" Depression?

The dividend was increased or maintained in 1929, 1930, and 1931. However, in the year of the stock market bottom, Borden pursued a dividend cutting campaign. In 1932 the full year dividend was $2.27. By 1939, the dividend was $1.27. In this case, the dividend cut ended at $1.27 which preceded the final decline in earnings. Earnings finally ascended in 1935. By 1954, the full year dividend was $2.64 This increase in earnings was later reflected in the growth of the dividend.

370503 Borden

Union Carbide: 1927-1937

The chart below highlights two issues:

1) How long did it take for a stock to get to breakeven?

In the case of Union Carbide, the stock nearly recovered all of its losses by 1937 before the next major stock market decline. The loss of nearly -90% was difficult for anyone to experience so it is assumed that most investors would have sold the stock at or near the depths of the decline in 1932.

2) What happened to the dividend during the stock market crash and "Great" Depression?

The dividend tracked earnings with a lag of 9 to 12 months. As earnings bottomed in 1932, so too did the dividend. However, in spite of being in a "Great" Depression, earnings steadily grew for Union Carbide until the 1937 peak. This increase in earnings was reflected in the growth of the dividend.

image

Canadian Dividend Watch List: June 19, 2015

Below is the 1-year performance of the Canadian dividend stocks from our June 2014 watch list (found here):

Symbol Name 2014 2015 % chg
JE.TO Just Energy Group Inc. 6.04 6.69 10.76%
D-UN.TO Dream Office REIT 28.9 24.97 -13.60%
TA.TO TransAlta Corp. 12.93 9.82 -24.05%
EMP-A.TO Empire Company Limited 67.44 89.4 32.56%
CUF-UN.TO Cominar REIT 18.65 17.9 -4.02%
NWC.TO North West Company Inc. 23.51 25.06 6.59%
GWO.TO Great-West Lifeco Inc. 29.37 36.37 23.83%
FTS.TO Fortis Inc. 31.75 36 13.39%
TLM.TO Talisman Energy Inc. 11.52 9.67 -16.06%
POW.TO Power Corporation of Canada 29.3 31.63 7.95%
ESI.TO Ensign Energy Services Inc. 16.78 11.59 -30.93%
PWF.TO Power Financial Corporation 32.88 35.93 9.28%

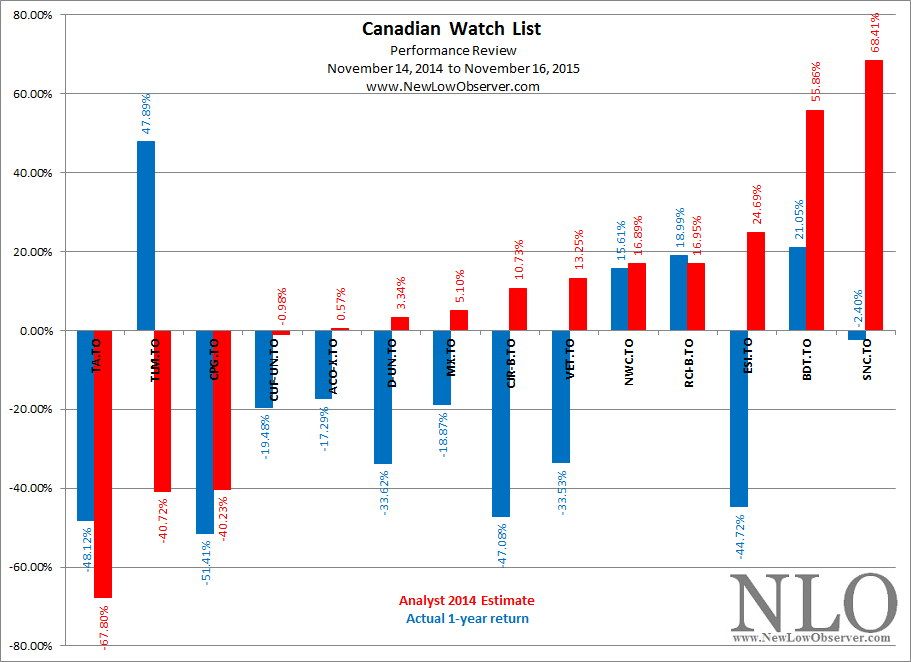
The performance of the analyst estimates fit with our view that analyst earnings expectations are aligned with past performance and not future reality.

image

In the watch list from last year, we commented on Just Energy:

“…it should be said that Just Energy (JE.TO) has been left for dead by analysts and therefore has the most potential for surprises on the upside.”

Coincidentally, Just Energy managed to gain +10.76% when the expectation was that the stock would fall significantly.

U.S Dividend Watch List: June 19, 2015

It was a good week for the market as it gained +0.75% despite the indecision with Greece. It appears that the market may be looking beyond the Greece and has priced in the exit from the Euro monetary system.

Despite climbing a wall of worry, a key element needed for a rising market, several sectors remain relatively weak. The sectors include energy, utilities, and real estate investment trust. Two of these are driven by the interest rate outlook. We are not making a macro forecast but we know where interest rates will be eventually heading, the only real question is the timing. That being said, we want our readers to be caution of the macro factors that may suppressed or adversely affect some companies on the watch list below. Continue reading

Real Estate Investment Trusts: 1971

This is a review of the Real Estate Investment Trust (REIT) sector from an era that has already passed. These article reviews are intended to highlight the risks of investing in REITs.  We’re hoping that insight can be gained from these reviews and translated into meaningful investment education.

This review will cover the beginning of the REIT investment cycle starting in 1971.  The review is based on a single New York Times article.  Ultimately, we hope to include a series of REIT articles that range from 1971 to 1979.

1971: In The Beginning

The first article under review is titled “Personal Finance: Real Estate Investment Trusts Gain New Luster as Money-Making Medium Personal” by Elizabeth M. Fowler published on July 22, 1971.  This article was an introduction to the general public about the virtues of investing in REITs.  An attempt to find similar introductory material before 1971 was not readily available.  Therefore, we relied on this article as a good overall intro to the topic.

In Fowler’s article, it was pointed out that REITs operate like the property management division of large companies like “…American Standard, the Ogden Corporation, Boise Cascade and many others.”  The article also pointed out that new entrants to the REIT model of property management included “…some of the nation's major insurance companies and banks.”

Some statistical facts about the REIT industry by 1971 were that there was “…80 large REIT’s, many of them formed in the last few years…” and that they held more that $3.8 billion in assets.   By 1971, approximately 48 REIT’s were publicly traded.

Of the categories of REITs available at the time, there were four categories, long-term mortgage investments, intermediate-term investments, short-term investments and “…then there is a hybrid type or they are sometimes called combination trusts.”  The general merits of REITs were outlined, however, the closing paragraph pointed out this warning from Standard and Poor’s:

“Most REIT shares have advanced strongly this year and are near records. It may pay to await a period of temporary weakness to make purchases."

In fact, the temporary weakness did not come for REITs until 1973.  However, by 1973, it was too late to warn investors about the risks of investing in REITs as the momentum was too strong on the upside. Below are the prices and yields comparison for a select few of the REITs in 1971 and 1974.

REIT 7/22/1971 Price 1971 Yield 5/16/1974 Price 1974 Yield % chg
American Century Mortgage $25.00 8.80% $5.25 4.76% -79.00%
First Mortgage Investors $30.00 6.90% $3.00 57% -90.00%
Republic Mortgage Invest. $20.00 9.00% $6.87 24% -65.65%
Wachovia Realty $34.00 6.40% $11.50 20% -66.18%
Conn. General Mortgage $31.00 5.40% $16.00 11% -48.39%
Equitable Life Mortgage $27.00 3.30% $14.38 15.36% -46.74%
Mass Mutual Mortgage $25.00 2.50% $12.00 15.58% -52.00%
MONY Mortgage  $12.00 7.20% $6.00 14.66% -50.00%
Hubbard REIT $21.00 6.90% $15.58 10% -25.81%

Source:

  • Fowler, Elizabeth M. “Personal Finance: Real Estate Investment Trusts Gain New Luster as Money-Making Medium Personal” New York Times.  July 22, 1971.
  • New York Stock Exchange Transactions. New York Times.  May 16, 1974. page 60.

Nasdaq 100 Watch List: June 5, 2015

Below are the analyst estimates (in red) from our May 30, 2014 Nasdaq 100 Watch List and the actual performance of the stocks (blue).

image

The actual performance continues to reflect our theory that, at the time of the estimates, the analysts are likely to be too pessimistic of those stocks that have recently fallen on hard times while too optimistic for the stocks that have performed “better.”  Keep in mind that the list of stocks that we follow are already considered to be unloved.  However, the analyst estimates are routinely far off the mark.

The following was our commentary on the watch list last year:

“As we head into the month of June, we have to expect that LMCA and ISRG are the most likely to provide upside surprises as these stocks are considered by most analysts to underperform the market by a wide margin.”

As expected, LMCA and ISRG went in the opposite direction of the analyst estimates. Liberty Media gained +16.25% instead of falling –69.24% while Intuitive Surgical (ISRG) gained +33.90% instead of falling –31.50%.

Our specific stock of interest was Ross Stores (ROST).  Of ROST, we said the following:

“If a repeat of the previous decline were to occur, we should expect $61.49 to appear on our radar before a meaning[ful] attempt at the old high.  We would not be buyers of the stock at the present time, however, the extreme upside target for this stock is $113.19 based on the work of Gould.”

Since our May 30, 2014 posting, ROST declined to $61.83 (within 1% of our estimated downside target) before climbing as high as $108.91 (within 4% of our estimated upside target) by March 24, 2015.

image 

Nasdaq Watch List

Below are the Nasdaq 100 companies that are on our radar.