Author Archives: nlo-admin

Shanghai Composite Index: Where To Now?

On August 23, 2015, we said the following:

“The next move in the price to the downside should confirm the downside move or indicate the ongoing battle between buyers and sellers.  The point indicated as the critical support will reveal the overall short-term direction of the index.  Although the move up or down is academic, it is the size of the move that will be most fascinating as we believe it will be massive.”

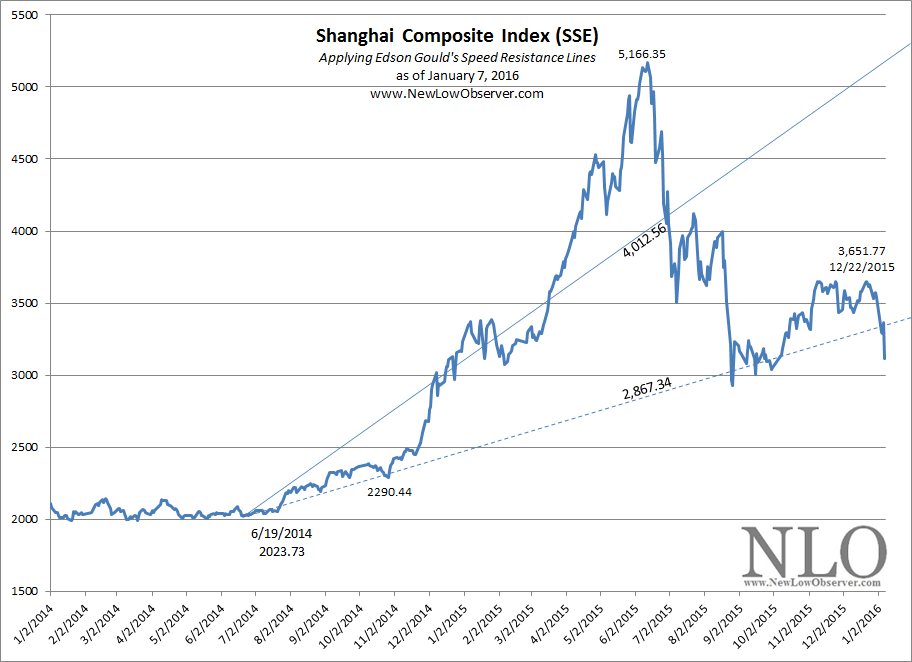
So far, the Shanghai Composite Index (SSE) has confirmed that the direction of the index is down, now it is only a matter of magnitude.  Already the Shanghai Composite Index has reached the mid-range downside target of 2,867.34.

image

A large bounce at this level is hoped for as a continuation of the declining trend could spark a genuine panic.  If an upside bounce were to occur at this level, the SSE would face resistance at the ascending conservative downside target of 4,012.56.   It would be a +48% rise to the 4,400 ascending conservative downside target from the close of August 25, 2015. 

The flip side of a reversal to the upside is a decline to the extreme downside target of 1,722.12.  Our breakdown of the potential reversal points are as follows:

  • 2,450
  • 2,100
  • 1,722

The actions of the Chinese government have not been constructive for a change in the declining trend of the market.  The sooner restrictions intended to stop prices from falling are lifted the better the chance for Chinese stocks to fully recover.  The more involved the government becomes in the stock market the more we believe that 1,722 on the SSE is likely to occur.

Shanghai Composite Index: Downside Targets

The index to watch in the coming week is the Shanghai Composite Index (SSE) as it represents the raw emotions of the stock market in China.  Below we have applied Edson Gould’s Speed Resistance Lines [SRL] to the SSE to determine the potential downside targets to watch for.

image

The SRL is ideally suited for a stock or index that has experienced a parabolic move to the upside.  When viewed from a historical perspective, the Shanghai Index meets the criteria of entering the entropy stage. 

Already the Shanghai Composite Index has declined below the conservative downside target of 4,012.56.  The July 23, 2015 upside failure coincided with the ascending conservative target.  This is the first true test of weakness in the upside move.  The next move in the price to the downside should confirm the downside move or indicate the ongoing battle between buyers and sellers.  The point indicated as the critical support will reveal the overall short-term direction of the index.  Although the move up or down is academic, it is the size of the move that will be most fascinating as we believe it will be massive.

Because the Shanghai Composite Index has a history of parabolic rises and subsequent crashes, our guess is that  declining to the 1,722.12 level should be expected.  In addition, if the SSE were to replicate the previous rise and fall in the period from 2005 to 2008, the index could drop as low as 1,447.37.

Canadian Dividend Watch List: August 2015

Below is the performance of the stocks that were on our Canadian Dividend Watch List from August 2014:

symbol Name 2014 2015 % Chg
TA.TO TransAlta Corp. 12.72 6.42 -49.53%
ESI.TO Ensign Energy Services Inc. 16.25 9.06 -44.25%
CGX.TO Cineplex Inc. 40.35 46.29 14.72%
RCI-B.TO Rogers Communications Inc. 43.24 46.9 8.46%
D-UN.TO Dream Office REIT 28.95 21.48 -25.80%
TLM.TO Talisman Energy Inc. 11.32 9.48 -16.25%
CMG.TO Computer Modelling Group Ltd. 12.46 11.68 -6.26%
CJR-B.TO Corus Entertainment Inc. 24.85 13 -47.69%
NWC.TO North West Company Inc. 24.29 27.12 11.65%
IGM.TO IGM Financial Inc. 50.64 36.24 -28.44%
CWT-UN.TO Calloway REIT 26.25 29.41 12.04%

The entire list lost –15.58% which is compared to the Toronto Stock Exchange decline of –12.16% in the period from August 15, 2014 to August 21, 2015.  The top five stocks on our list averaged a loss of –19.08% which is substantially more than the index.  Below we’ve outlined the performance of the watch list stocks compared to the analyst estimates.

image

This is one of the best examples (so far) of the analysts being accurate about the estimated price change that we’ve seen so far.  Talisman, TransAlta, Dream Office REIT, Rogers Communications, North West Co. and Cineplex all came within reasonable distance of the projected targets or move in the stock price.  The remaining stocks that did not meet expectations failed miserably and in a directions that was highly unfavorable to investors.

Canadian Dividend Watch List for August 2015

Below is the list of stocks that we think are worth your consideration and due diligence.

In-Depth Analysis: W.W. Grainger

We came across W.W. Grainger (GWW) on  last week's U.S. Dividend watch list. At the time, Grainger traded down to its yearly low and on the surface appeared to be very intriguing. As such, we did some research and would like to share some findings. Continue reading

U.S. Dividend Watch List: August 14, 2015

The market was flat for the week as trading volume continued to decline. Although there was a good deal of chatter about the technical pattern know as the "death-cross", which is when 50-day moving average crosses 200-day moving average to the downside. The "death-cross" a bearish pattern that suggest a change in the trend. Only time will tell if this bearish indication will materialize. Until then, we will continue to search for good companies trading below fair value. Continue reading

Gold Stock Indicator: August 14, 2015

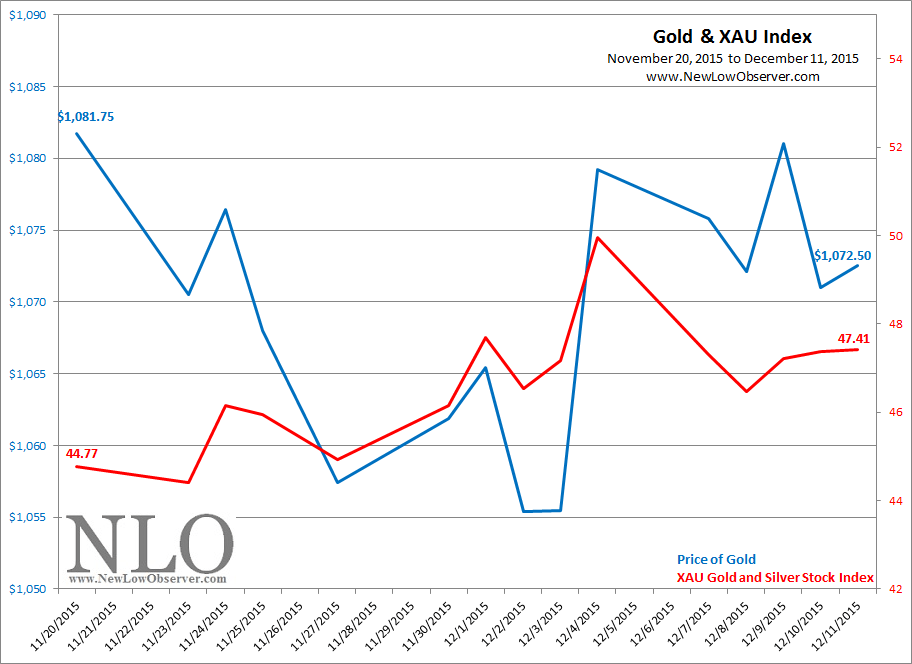
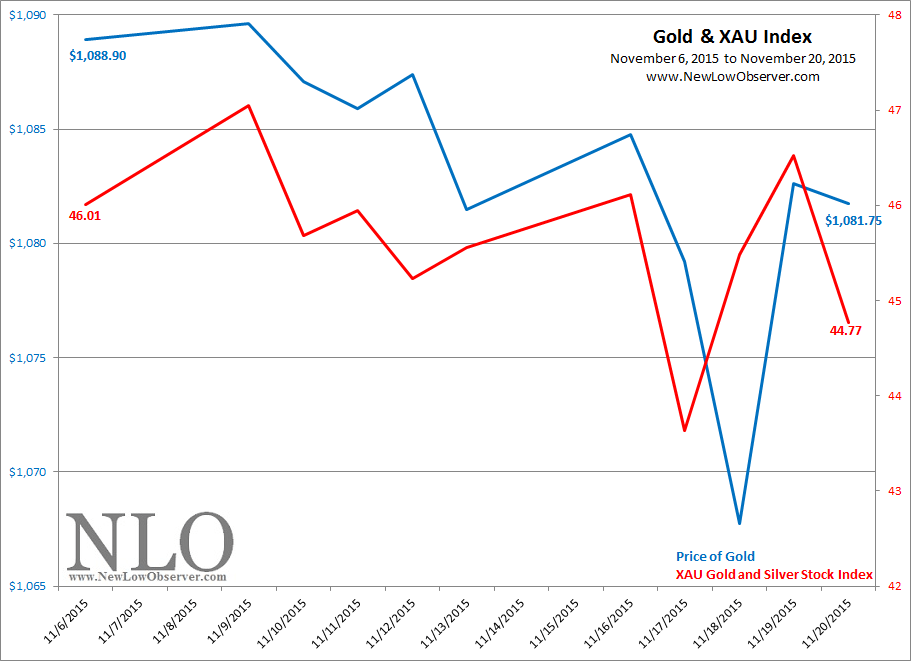
In the past month, gold and gold stocks have been on a rollercoaster ride.  Gold declined as much as –4.59% while gold stocks, as represented by the Philadelphia Gold and Silver Stock Index (XAU), declined –17.88%.

image

Although there has been a recovery of sorts, we cannot be sure that the decline is over.

Transaction Alert

On Wednesday August 12, 2015, we executed the following transaction(s):

Continue reading

Coppock Curve: July 2015

It's been quite sometime since we've updated our readers on Coppock Curve.  We've gotten more excited to see this indicator approach zero because it would point to a major opportunity to be long equities. While the indicator provides buy signals it doesn't offer any sell indication. As such, one can only take this as a buy only indicator.

Coppock July 2015

About Coppock Curve

The Coppock Curve is one of the technical indicators that we focus on for long-term buy signals for the stock market. The Coppock Curve is only useful as a BUY indicator when the chart goes from positive territory to the negative territory then turns decidedly upward. As previously indicated, the Coppock Curve does not provide SELL signals in any way.

Green Mountain Coffee Roasters: On Target

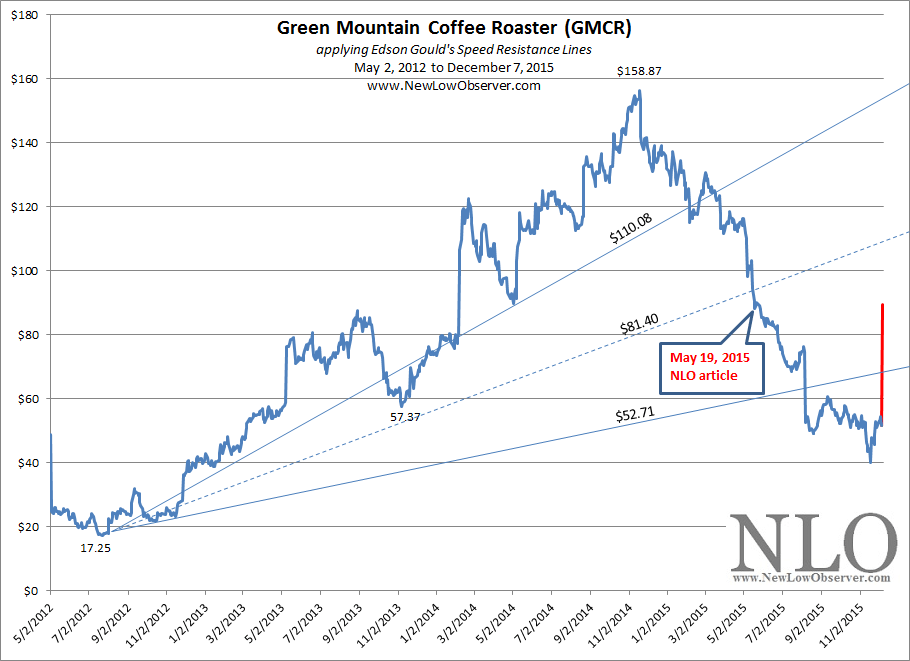
On May 19, 2015, we did a downside review of Green Mountain Coffee Roasters (GMCR) based on the work of Edson Gould.  At the time, GMCR was trading at $88.69.  Our downside assessment was as follows:

“As can be seen above, the price of GMCR has declined below the conservative and mid-range downside targets of $110.08 and $81.40.  The acceleration of the current decline seems to indicate that achieving the $52.71 extreme downside target is very likely.”

On August 6, 2015, GMCR declined as low as $52.40.  This falls well within the indications that were provided by Gould’s Speed Resistance Lines [SRL] at $52.71.  We closed our downside assessment of GMCR with the following comment:

“The fact that GMCR is prone to extreme moves up and down suggests that the extreme downside target is the point at which to start assessing risk and accumulating shares.”

Now that GMCR has fallen below the extreme downside target of $52.71, we think now is the time to review GMCR as a going concern for a potential transaction.

The Setup

Assuming that an investor is willing to accept total loss of funds, now is a great time to review the fundamentals of GMCR and determine if it will survive on its own or ultimately get acquired.  Below is the updated SRL based on the work of Edson Gould.

image

Our best guess is that buying GMCR in three stages on the way down is the most “prudent” approach.  For those interested in the stock but don’t like the prospect of catching a falling knife, we’ve outlined three potential starting points for investment at $40.66, $31.33 and $23.04.  We’d suggest investments of 50%, 25% and 25% of allotted funds.

Again, this recommendation is not for the faint of heart.  Additionally, it is safest to assume all money put to this stock are a total loss and requires a significant amount of due diligence before any commitment is made.  From a historical standpoint, a  retest of the prior low ($17.25) is not unusual.

U.S. Dividend Watch List: July 31, 2015

The market rebounded this week with a gain of +1.2%. The S&P 500 appears to be consolidating as it trades sideways for nearly 6 months now. The volatility in the market is having a material effect on our watch list. We continue to see a large number of companies trading at or near their yearly low. There are many large blue-chip names to review on our list below. Continue reading

U.S. Dividend Watch List: July 24, 2015

Top Five Watch List Performance Review

In our ongoing review of the NLO Dividend Watch List, we have taken the top five stocks on our list from July 25, 2014 and have checked the performance one year later. The top five companies on that list can be seen in the table below.

Symbol Name 2013 Price 2014 Price % change
SCL Stepan 49.88 47.00 -5.8%
TR Tootsie Roll Industries Inc 27.31 31.64 15.9%
FCBC First Community Bancshares 13.60 17.84 31.2%
WWW Wolverine World Wide 24.27 28.81 18.7%
YORW The York Water Company 19.20 21.26 10.7%
      Average 14.1%
         
DJI Dow Jones Industrial 16,960.57 17,568.53 3.6%
SPX S&P 500 1,978.34 2,068.26 4.5%

Our top five gained an average of 14.1%. This far exceeded the market performance. The only company that failed to meet or exceed the market performance was Stepan (SCL) which fell -5.8%. The other four companies had gains ranging from +10.7% to +31.2%. Our commentary about Stepan and Tootsie Roll is worth reviewing. Regarding Stepan, we said the following:

When we look at the price level compared to various fundamental figures (cash flow, earning, and book value), you will see that price has risen far beyond the fundamental. From 2003 to 2013, the stock has risen around 17% on an annual basis. Compared that to 5.6% for cash flow, 13% for earning, 10% for bookvalue, and 5.5% for dividend. While stock purchased at the low will mark a better entrance than stock at the high, we think that this stock will have some catching up to do on the fundamental front.

As for Tootsie Roll (TR), we all know there isn't anything exciting to write about the company other than it managed to gain nearly +16% while the S&P 500 had risen only +4.5%. The stock of Tootsie Roll has always appears to be 'expensive' on P/E basis but time after time, the company manages to maintain a consistent level of appreciation. That may be due to the predictability of their revenue and profit. We stated that the stock was worth a look at the current price while making note that it wasn't a screaming buy.

U.S. Dividend Watch List: July 24,2015

It was a train wreck for the market this week as the S&P 500 fell -2.2% while Industrial average lost nearly -3%. For those with cash on the sidelines, this is music to their ears. A pullback in the market will allow long-term investors to accumulate assets and utilize our dividend watch list to position themselves for income investing. Continue reading

Dow’s Theory on What exactly is an Industrial Stock

Charles H. Dow defines what Industrials stocks are

"The stocks of trust companies and banks are simply industrial stocks... (Dow, Charles H.Wall Street Journal. Review and Outlook. October 12, 1900)."

Chesapeake Energy is on Target

On April 26, 2012, we posted an article titled “A Warning For Chesapeake Energy Stockholders”.  In that article we said the following:

“While it appears that Chesapeake Energy  (CHK) has seen all the punishment that could possibly lay ahead, we’re concerned that the previous technical pattern in the period from 1993 to 1999 is about to repeat.”

The period from 1993 to 1999 saw (CHK) decline from as high as $27 to under $1.00.  The 2012 article was written when CHK was at $18.10 and had already fallen more than –66%.  So far, CHK is on track to replicate the decline achieved from 1993-1999.  The next downside target for Chesapeake Energy is $4.50.

image

IBM: A Value Investor’s Delight

In April 2012, we published an article titled, “What Does Warren Buffett See In IBM?”  At the time we concluded the article with the following thought:

“…just imagine what IBM will look like after falling to a 52-week low.”

A reader of our article took exception to the idea of IBM declining in price with the remark:

“I have no idea why you think you could buy IBM on a 52 week low. There is nothing fundamental about the company that would lead one to think that might happen. IBM is a difficult company to short because people who own it primarily intend to hold it for a longer term, do not trade on margin, and do not sell their shares based on fear (Momintn. What Does Warren Buffett See in IBM? April 19, 2015. link.).”

Since our article, IBM has declined from $207 to $161 with upside movement being limited to $213.

image

In spite of the price decline of nearly –22% since 2012, IBM has increased the dividend by +53%.   This has resulted in a situation where the price of IBM has becomes very compelling from a value perspective.  As indicated in our original article on IBM, the growth of the dividend has become an overpowering force which is creating a stock that could eclipse all expectation for long-term investors.  This leaves aside the topic of IBM share repurchases which Warren Buffett discussed in his 2011 shareholder letter.

Our premise of IBM’s valuation is narrowly perched on the work of Edson Gould’s Altimeter.  Below is an update of Gould’s Altimeter since our April 2012 article.

image

According to Gould’s Altimeter, IBM is now undervalued below the levels of the 2008 low.  We think that a value investor would have fun pouring over the data to determine the actual value of IBM.   Gould’s Speed Resistance Lines [SRL] indicate that the conservative downside target for IBM is $130.  However, we think a process of accumulation at the current price, and below, is a prudent long-term strategy.

Canadian Dividend Watch List: July 2015

Performance Review

Below is the performance of the Canadian Dividend Watch List from July 2013:

symbol name 2013 2015 % chg
D-UN.TO Dundee REIT 31.77 24.7 -22.25%
REI-UN.TO Riocan Real Estate Investment Trust 25.11 27.06 7.77%
CUF-UN.TO Cominar REIT 20.83 17.97 -13.73%
CAR-UN.TO Canadian Apartment Properties REIT 22.31 28.45 27.52%
CWT-UN.TO Calloway REIT 26.09 30.17 15.64%
AX-UN.TO Artis Real Estate Investment Trust 15.1 13.68 -9.40%
IFC.TO Intact Financial Corporation 57.53 90.17 56.74%
FCR.TO First Capital Realty Inc. 17.79 18.29 2.81%
FTS.TO Fortis Inc. 32.34 36.99 14.38%
BEI-UN.TO Boardwalk Real Estate Investment Trust 60.3 59.78 -0.86%
EMA.TO Emera Inc. 33.75 42.55 26.07%
LB.TO Laurentian Bank of Canada 45.05 48 6.55%
TRP.TO TransCanada Corp. 46.77 49.34 5.49%
FTT.TO Finning International Inc. 22.68 21.9 -3.44%
NA.TO National Bank Canadian Equity SP 36.14 45.51 25.93%
CM.TO Canadian Imperial Bank of Commerce 77.15 91.18 18.19%

The average return for the entire watch list was +9.84% compared to the Toronto Stock Exchange Composite index change of +13.33% in the period from July 19, 2013 to July 22, 2015.  At the time, we said the following of the watch list:

“We recommend careful examination of the listed companies in the REIT arena as they have less upside potential than is ideal.”

Since July 2013, the REIT related companies on the watch list generated a return of +0.94% while companies not in the REIT sector gained an average of +18.94%.

July 2015 Canadian Dividend Watch List

Below is the Canadian stocks of interest: