Author Archives: nlo-admin

Quick Take: Helmerich & Payne

It is clear that the commodity market is in the dumps.  The chart below outlines the course of the Bloomberg Commodity Index since the July 2008 peak.

image

With the decline that has occurred in the index, it would be obvious to any long-term investor that there are values to be had.  Yeah, there are risks but we’re investors not savers (anyone confused about the difference between saving and investing?  Savers expect the money to be there no matter what, investors are taking the risk that more or less will be there, after the passage of time).  One idea that we think is worth entertaining (or researching) is a stock that we’ve followed for many years.

U.S. Dividend Watch List: September 11, 2015

Top Five Watch List Performance Review

In our ongoing review of the NLO Dividend Watch List, we have taken the top five stocks on our list from September 12, 2014 and have checked the performance one year later. The top five companies on that list can be seen in the table below.

Symbol Name 2013 Price 2014 Price % change
SCL Stepan 47.11 41.61 -11.7%
WSO Watsco Inc. 89.31 123.00 37.7%
FLO Flowers Foods Inc 18.63 24.22 30.0%
VIVO Meridian Bioscience 18.67 17.78 -4.8%
GTY Getty Realty Corp. 17.94 15.44 -13.9%
      Average 7.5%
         
DJI Dow Jones Industrial 16,987.51 16,433.09 -3.3%
SPX S&P 500 1,985.54 1,961.05 -1.2%

We didn't have much to say about last year's watch list. However, the average gain for the top five companies was +7.5% compared to -1.2% for the S&P 500. The biggest contributors were Watsco (WSO) and Flowers Foods (FLO). We made a quick note on Stepan (SCL) and said that the stock was getting somewhat intriguing at the current level. The stock has fallen -11.7% over the year so we would venture to say the stock is even more intriguing at the current level.

U.S. Dividend Watch List: September 11,2015

Below are 48 companies that are on our watch list. Continue reading

Nasdaq 100 Watch List: September 11, 2015

Quick Take: Dover Corp.

According to Yahoo!Finance, “Dover Corporation manufactures and sells a range of equipment and components, specialty systems, and support services in the United States. The company operates in four segments: Energy, Engineered Systems, Fluids, and Refrigeration & Food Equipment. The Energy segment provides solutions and services for the production and processing of oil, natural gas liquids, and gas to drilling and production, bearings and compression, and automation end markets.”

image

The price of Dover Corp. (DOV) has declined by –32.46% since the early July 2014 peak.  Looking at the stock, it appears that the downward spiral is locked in.  The following are some thoughts about the stock.

Continue reading

Netflix Downside Targets

It’s that time again.  We’re going to see what the effectiveness of Gould’s Speed Resistance Lines (SRL) is in predicting the downside for Netflix (NFLX).  But first we’re going to review the last time that we ran an SRL on Netflix.  The very first time we ran numbers on NFLX was on December 3, 2010 when the stock was trading at the pre-split price of $185.45. 

image

At the time, we were testing out the quality of Gould’s work.  We came up with a conservative downside target of $117.76 and an extreme downside target of $68.63.  The most challenging part of the assessment was the fact that Netflix increased +50% before achieving the first downside target.

A follow-up review of the SRL on Netflix was done on September 22, 2011 where we had the following to say:

“…in reviewing the chart pattern of Netflix (NFLX), we have the peak of NFLX at $298.73. The conservative estimate for the stock is that it would fall to $148 which has already taken place. The extreme downside target would be $99.58. Because of the nature of the rise, we believe that Netflix (NFLX) is slated to fall at least to the $99.58 level.”

At the time, we proposed that NFLX would decline at least -66% from the peak of $298.73.  The actual decline was -79.89%.  Will it happen again? We don’t know.  However, if it does, there will be good buying opportunities ahead.

Dow Altimeter Review

On May 20, 2014, we said the following about the Dow Jones Industrial Average Altimeter based on the work of Edson Gould:

“Currently, the Altimeter is closing in on the 2007 peak of 47.37.  If the Dow were to attain the 47.37 level in the Altimeter, the index would sit at 17,062.67.  There is no rule that says the Dow Industrials must stop at the prior turning point.  However, our cautious nature instinctively pushes us to wonders if the run from the 2009 low is about to come to an end.”

Since that time, the Altimeter for the Dow peaked at 47.03 on March 2, 2015, just short of the 2007 level of 47.37, and has declined below the 32.05 support level.  From a performance standpoint, the Dow Industrials has fallen -11.95% since March 2, 2015.

image

Naturally we can’t say that we predicted any of the changes in the market since May 2014.  However, our primary goal is to observe indicators that most accurately guides our thinking about possible scenarios for the stock market.  In this case, we believe that the best way to assess the possible scenarios is by applying Dow Theory to Gould’s Altimeter, as seen below.

Oil and Gas Stock Index Update

On January 6, 2015, we said the following about the NYSE Oil and Gas Stock Index (XOI):

“The conservative downside target of 1,454.79 has been constructed while the mid-point of 1,015.10 is also indicated.  However, we did not include the extreme downside target of 575.41.  We did indicate in red the 812.08 level which was the extent of the decline in the period from the 2008 high to the 2009 low.

“Suffice to say that we expect the XOI index could easily fall to 1,015.10 and subsequently to the 812.08.  Those interested in the oil sector should start initiating positions at or below the ascending 1,015.10 level. ”

At the time, the NYSE Oil and Gas Stock Index was trading at 1,287.66.  The September 4, 2015, XOI close was 1,085.81, down –15.67%.  At least from the perspective of the last posting, the SRL achieved the expected downside target.

image

However, lurking in the background is the extreme downside target of 575.41.  Since our experience has been that the extreme downside target is commonly achieved, we hazard to guess what would happen globally to the oil market in order to decline to such a low point.

For now, we’ll resign ourselves to the idea that the 812.08 is the next downside target.  If that target is achieved we believe that the 575.41 level is highly achievable.  Given our concern for the downside risk, oil sector stocks should be bought in three stages at 958, 812 & 575.

Coppock Curve: August 2015

It didn't take long for the market to cave in after our July post on the Coppock Curve. The Dow Jones Industrial Average shed -6.5% in August alone. Immediately, we were curious what type of damage this decline did to the indicator and how close are we to that negative territory. As a reminder, the Coppock Curve serves as a buy signals only. Continue reading

Baidu: Downside Targets

On April 27, 2013, we wrote a short piece on Baidu (BIDU) that concluded with the following remark:

“The conservative downside target of $93.43 has been achieved and we are now sitting at the extreme downside target of $54.79. All indications, based on the SRL, are that Baidu is worth considering in a two stage purchase plan, once at the current level and again at $67 or lower.”

The chart that we included for the above assessment was based on the work of Edson Gould’s Speed Resistance Lines (SRL) and is shown below.

image

Since that recommendation to buy at $85, Baidu had increased to as high as $251.  What was not included at the time was the upside targets based on the work of Edson Gould.  At that time, the upside targets were:

  • $140.16 (conservative target)
  • $210.23 (mid target)
  • $280.31 (extreme target)

Baidu was able to achieve two of the three upside targets that were indicated for the stock based on the interpretation of Gould’s work.  With the Chinese stock market experiencing significant turmoil, Baidu has declined from the $251 level to the current price of $144 making a review of the technicals useful.

Baidu Downside Targets

Below is the updated Speed Resistance Lines based on the work of Edson Gould:

Continue reading

Commodity Index Review: Upside Targets

The Bloomberg Commodity Index has finally reached the extreme downside target of 79.26.  Initially, we didn’t think that the index would fall to the extreme downside target as indicated in our October 29, 2013 posting.  However, after declining below the long-term technical support level, we had to acknowledge what is now obvious.

image

Continue reading

U.S. Dividend Watch List: August 28, 2015

There's no secret that it has been a rough ride for the market. Two weeks have gone by and the S&P 500 shed -4.9%. The sudden drop in the market can be scary but alternatively, it provides an opportunity to purchase quality equities at lower prices. Because of the quick recovery this week, there are fewer companies than our previous U.S. Dividend Watch List and those that appear on our list below are likely to be the lowest relative strength companies as they remain close to their yearly low. Continue reading

Berkshire Hathaway: 10-year Price Projections

In our May 6, 2012 posting on Berkshire Hathaway (BRK-A) titled “Should Berkshire Hathaway Be Trading at 1995 Prices?”, we gave price projections based on Edson Gould’s Altimeter using very conservative estimates if BRK-A paid a dividend.

The data based on that 2012 article has proven to be accurate as we’ve managed to achieve all of the undervalued levels for Berkshire Hathaway since then.  Below is the 10-year price where BRK-A would be considered undervalued.  As of August 28, 2015, BRK-A closed at a price of $205,344.

Nasdaq 100 Watch List: August 28, 2015

Performance Review

Below is the performance of the companies that appeared on our August 26, 2014 watch list.

symbol Name 2014 2015 % chg
MAT Mattel, Inc. 34.66 23.2 -33.06%
CA CA Technologies, Inc. 28.31 27.26 -3.71%
SPLS Staples, Inc. 11.06 13.75 24.32%
WFM Whole Foods Market, Inc. 38.495 32.85 -14.66%
XLNX Xilinx Inc. 41.78 42.27 1.17%
FOSL Fossil Group, Inc. 102.5 61.6 -39.90%
FAST Fastenal Company 45.73 38.69 -15.39%
DLTR Dollar Tree, Inc. 53.51 76.73 43.39%
EXPD Expeditors Intl of Wash 41.64 49.66 19.26%
SRCL Stericycle, Inc. 119.06 142 19.27%

The list of stocks achieved an average gain of +0.07% compared to the Nasdaq 100 gain of +6.28%.

image

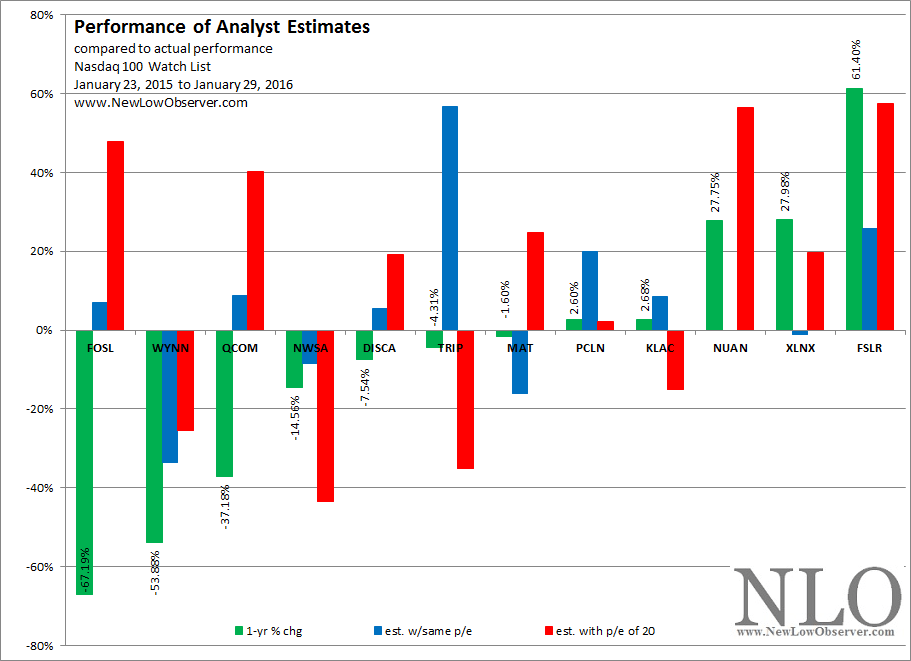
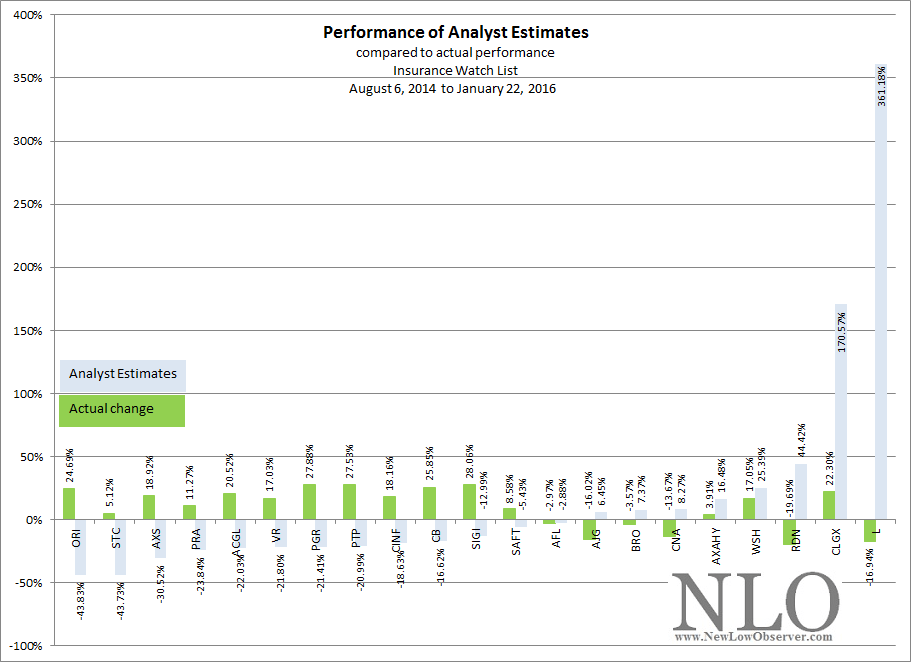
This watch list achieved exceptional performance based on the analyst estimates as six of the ten stocks exceeded analyst expectations (MAT, WFM, DLTR, EXPD, SPLS, SRCL).

Nasdaq 100 Watch List

Below are the Nasdaq 100 stocks worth your consideration along with the analyst estimates of price change for the coming year.

Shanghai Composite Index: Upside Target

On August 26, 2015, the Shanghai Composite Index traded as low as 2,850.71.  While the most recent rise may only be a bear market rally, we think that resistance to the rise might kick in around the 4,400 level.  Rising above 4,4oo would suggest that a run to the previous peak of 5,166.35 is not out of the question.  Keep in mind that a bull market in this index is not confirmed until the index exceeds the prior high, until that time the Shanghai Composite is in a bear market rally.

image

Dow’s Theory on the Role of Dividends and Earnings

Dividends are a reward after earnings have been applied to improving prospects

“It may be said that only a part of these gains in earnings can be fairly credited to dividend accounts.  That is true, because it has been deemed wise to take a portion of the earnings in each of the cases above named for betterments (Dow, Charles H.Wall Street Journal. Review and Outlook. October 12, 1900)."