Below is a chart of Netflix (NFLX) from 2003 to 2019 reflecting the year-over-year (YoY) percentage change.
-
Topics
Archives
-
-
Recent Posts
-
-
-
-

Below is a chart of Netflix (NFLX) from 2003 to 2019 reflecting the year-over-year (YoY) percentage change.
Below is the next upside resistance target for Yokohama Reito (2874.T) along with the downside support level.
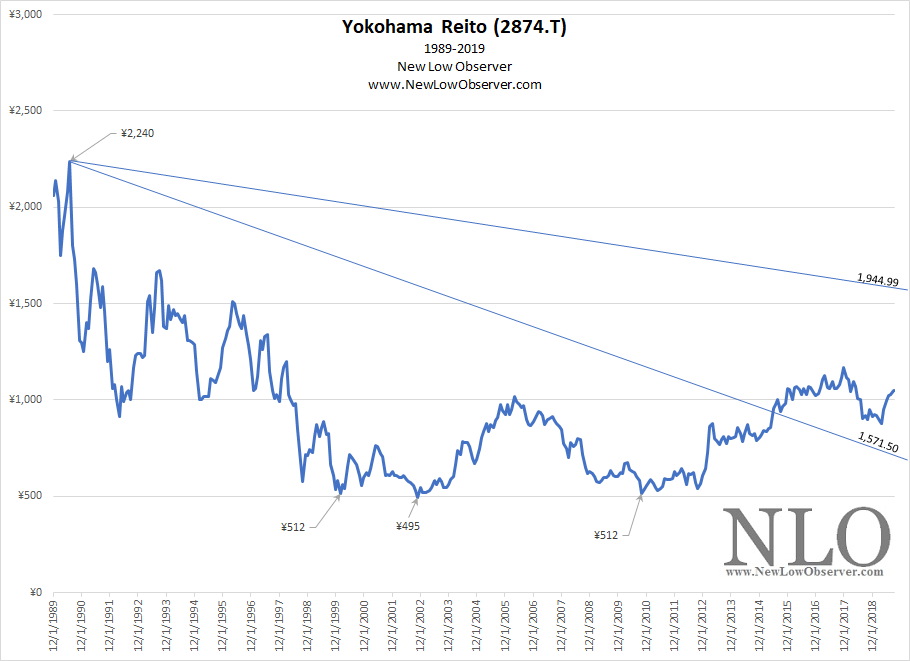
Our expectation is that the 1999 low along with the 2009 re-test of the same level at ¥512 was the confirmation of the reversal in the declining trend from the ¥2,670 peak in September 1989.
Below are the downside targets for Roku Inc. (ROKU).
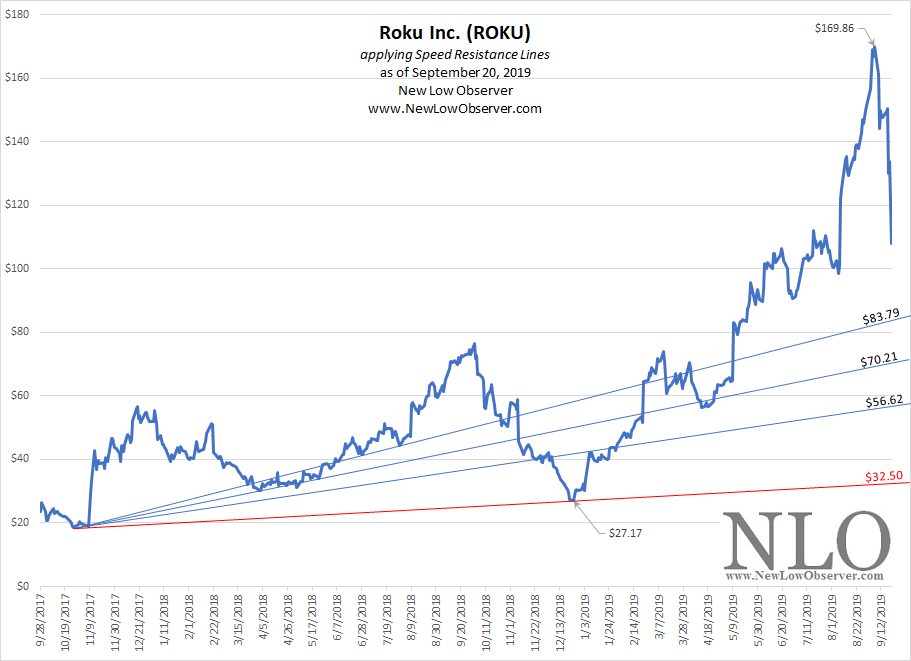
Our experience with all Speed Resistance Lines is that the conservative target is going to be achieved, no matter the reason. The targets are as follows:
Posted in downside, Edson Gould, ROKU, Speed Resistance Lines
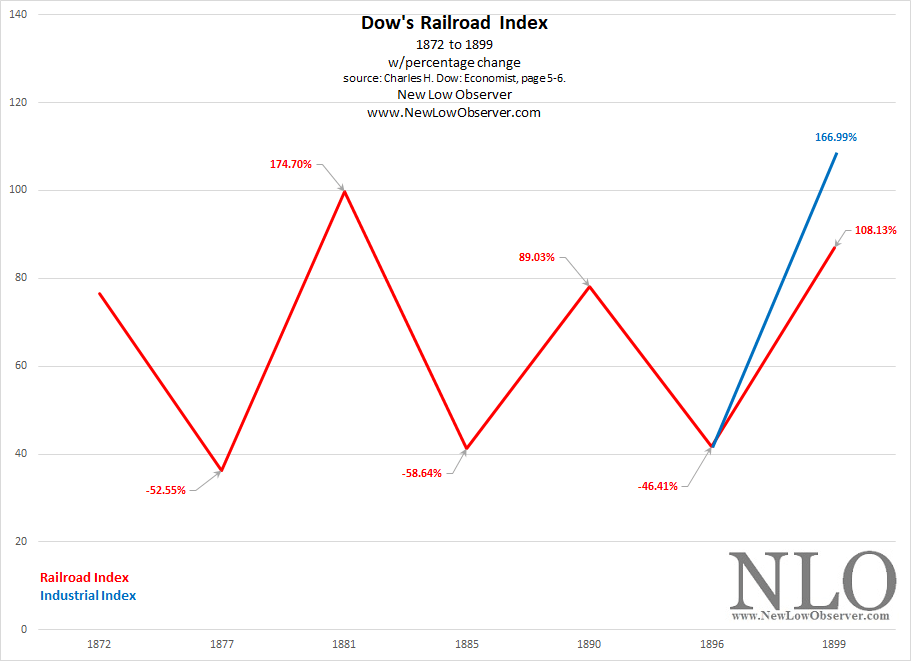
The railroad index consisted of leading rail stocks that exhibited the high average trading volume. Industrial stocks* as defined by Charles H. Dow as:
“…stocks of trust companies and banks are simply industrial stocks... (Dow, Charles H.Wall Street Journal. Review and Outlook. October 12, 1900)."
*See also December 10, 2016 for more on the 1899 definition of industrial stocks.
Posted in Dow Transports, Dow's Value Theory, railroads
Below is the performance review of the top five stocks based on price-to-book, price-to-earnings and dividend yield ratios from our September 21, 2018 U.S. Dividend Watch List.
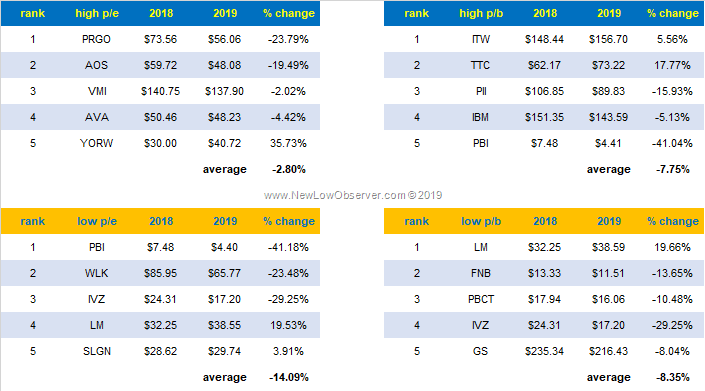
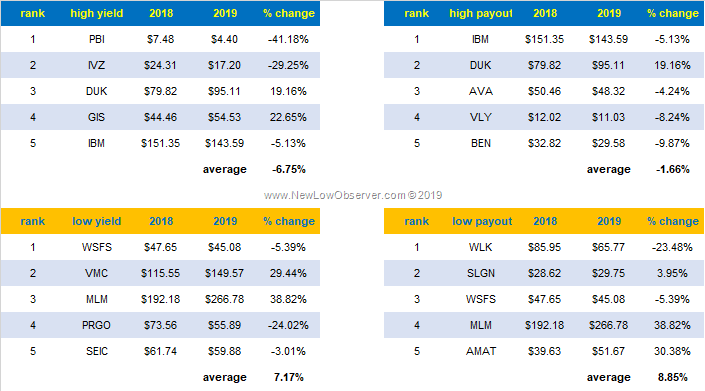
In the period from September 21, 2018 to September 20, 2019 (intraday), the Dow Jones Industrial Average increased +1%. The best performing group was the low payout ratio stocks with a gain of +8.85%. The worst performing group was the low p/e stocks was a loss of –14.09%.
Worth noting is the performance of the low yield stocks which gained +7.17% while the counterpart high yield stocks lost –6.76%. This continues to bolster our position that low yield stocks will routinely outperform the high yield stocks.
Also of interest is the fact that high p/e stock beat low p/e stocks, high p/b stocks beat low p/b stocks and low payout stocks beat high payout stocks.
Posted in Dividend Watch List, Performance Review
Below is a chart of Altria Group (MO) from 1971 to 2019 reflecting the year-over-year (YoY) percentage change.
Below are the valuation targets for Altria Group (MO) over the next 10 years. Continue reading
Posted in 10-year Targets, Altimeter, MO
Below is the breakdown of top 5 stocks from our September 13, 2019 list based on the fundamental ratios that we track. Continue reading
Below is a chart of Ulta Beauty Inc. (ULTA) from 2008 to 2019 reflecting the year-over-year (YoY) percentage change.
The market is attempting to test the all-time highs once again. This upward movement is dwindling the number of companies on our watch list. In fact, this is the lowest number of companies on our watch list this year. Continue reading
Posted in Dividend Achiever Watch List, Dividend Achievers, Dividend Watch List
Tagged members
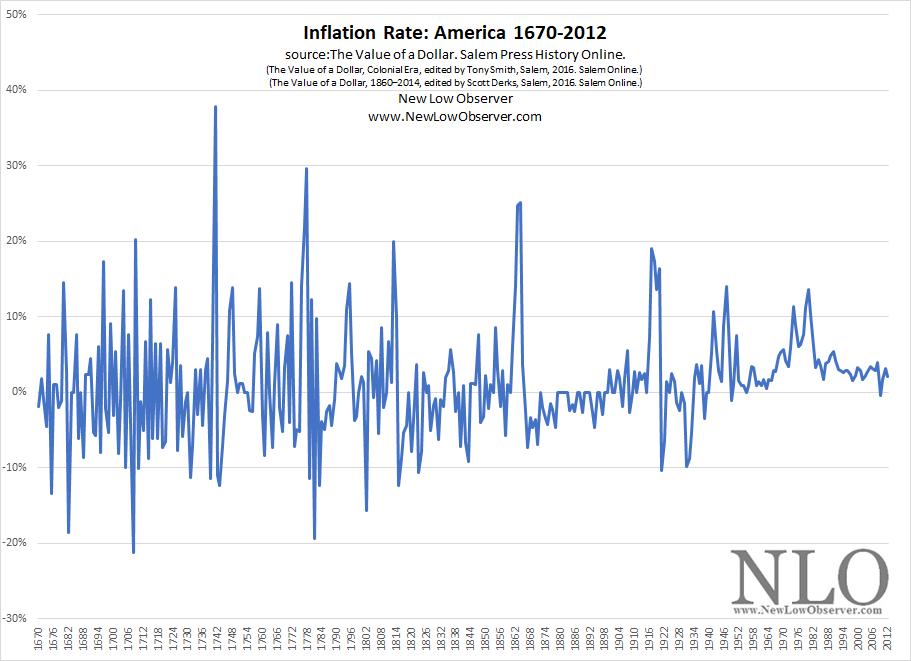
Below is the inflation rate in America from the colonial period to 2012.
source:
Overview
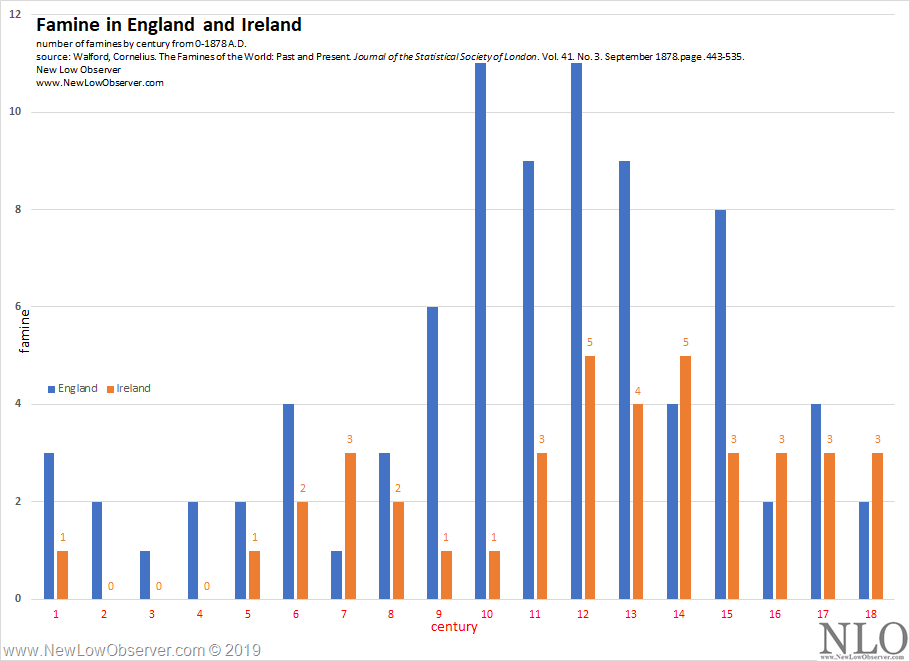
Below are the number of indicated famines by century in both England and Ireland from 0-1845 A.D. as found in the work of Cornelius Walford’s work “The Famines of the World: Past and Present” as found in the Journal of the Statistical Society of London.
Below is a chart of Craft Brew Alliance (BREW) from 1996 to 2019 reflecting the year-over-year (YoY) percentage change.
Review
On September 1, 2016, when Craft Brew Alliance (BREW) was trading at $19.41, we said there was considerable downside risk. BREW fell nearly -40%.
On April 7, 2017, we indicated that the downside had effectively run its course after falling to $13.15. BREW increased in price from that point forward.
On December 16, 2017, we highlighted a downside pattern that seemed likely from the price of $19.20. That pattern has finally played out.
Today
Many questions remain about the direction of BREW. One element is certain, our reasoned assessment in real time on the stock. Below is the pattern that has played out and will likely not be repeated going forward. This means that it would be absurd to expect minimal downside risk and retest of the prior high from the current level at $9.69.

Speculators should be willing to lose it all and watch the stock decline to $7.11 and $5.34. However, in spite of that warning, the 1,2,3 & 4 pattern has been successfully replicated as outline in the December 16, 2017 article, suggesting a temporary low has been achieved, for now.
Posted in BREW
Previous Year Performance Review
In our ongoing review of the NLO Dividend Watch List, we have taken the top five stocks on our list from August 31, 2018 and have checked the performance one year later. The top five companies on that list can be seen in the table below.
| Symbol | Name | 2018 Price | 2019 Price | % change |
| LM | Legg Mason | 31.20 | 36.79 | 17.9% |
| IVZ | Invesco Ltd. | 24.10 | 15.70 | -34.9% |
| AMAT | Applied Materials | 43.02 | 48.02 | 11.6% |
| BEN | Franklin Resources | 31.74 | 26.28 | -17.2% |
| VMC | Vulcan Materials | 110.80 | 141.25 | 27.5% |
| Average | 1.0% | |||
| DJI | Dow Jones Industrial | 25,964.82 | 26,403.28 | 1.7% |
| SPX | S&P 500 | 2,901.52 | 2,926.46 | 0.9% |
The average gain for the top five companies was 1.0% which is comparable with S&P 500 gain of 0.9%. The best performer was Vulcan Materials (VMC) with 27.5% gain. The worse performer was Invesco (IVZ) with a loss of 34.9%.
U.S. Dividend Watch List: August 30, 2019
Our team is starting to get defensive and raised more cash. However, we will always utilize the watch list below as a starting point for investment opportunities. Continue reading
Posted in Dividend Achiever Watch List, Dividend Achievers, Dividend Watch List
Tagged members