Below is a chart of Altria (Philip Morris) from 1920 to 1987.
See our 10-Year price targets for MO at the following link (here).
Below is a chart of Altria (Philip Morris) from 1920 to 1987.
See our 10-Year price targets for MO at the following link (here).
Posted in 1920, 1987, Altria, Chart of the Day, MO
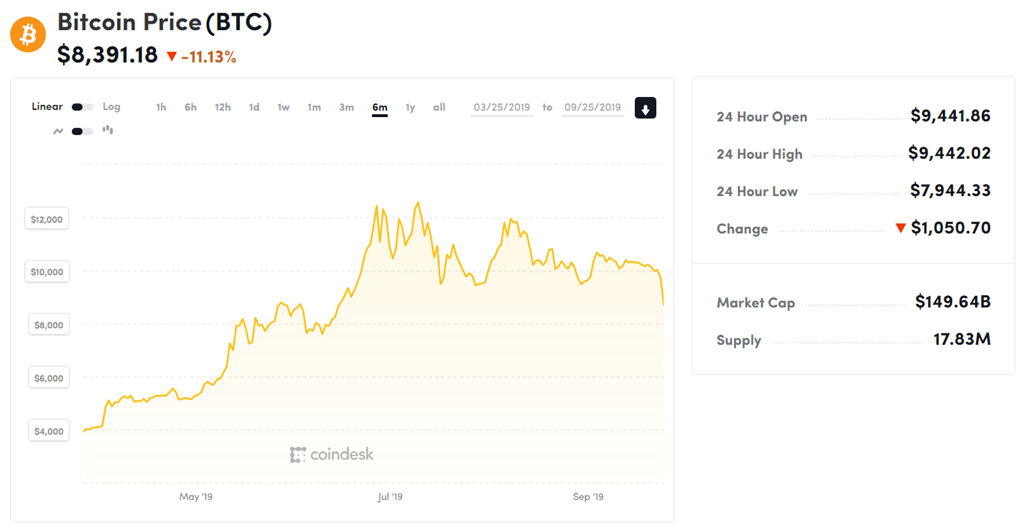
According to Coindesk, Bitcoin achieved a high of $13,884.77 on June 26, 2019. Based on the data provided by Coindesk, we have the following downside targets: Continue reading
Again the financial media gets the assessment wrong when commenting on financial markets. In this case, it is Barron’s which gets it wrong about the resurgence of Bitcoin.
On June 24, 2019, Barron’s gave the following headline:
In the eyes of Barron’s, Bitcoin has finally arrived on the scene due to the news that Facebook announced that they will issue their own cryptocurrency called Libra. Facebook made their announcement of Libra on June 18, 2019.
Let’s look at Facebook’s announcement of Libra relative to the price of Bitcoin from December 2017 to June 26, 2019.
In the price chart above, Bitcoin crashed from $19,343.04 in December 16, 2017 to a low of $3,194.96 on December 17, 2018. The amount of increases from the December 17, 2018 low was +183.61%. This was approximately the same level the Bitcoin achieved on May 27, 2019 when it traded at $8,800.
Attributing the move up in the price of Bitcoin, after it had already bottomed six months earlier, mistakes correlation as causation. This also highlights the potential power of Bitcoin which, at this point in time, adds more credibility to Bitcoin as a viable “investment” versus a pure speculation.
Posted in Bitcoin
Below are the valuation targets for SJW Group (SJW) for the next 10 years. Continue reading
Below are the valuation targets for The Kroger Co. (KR) for the next 10 years. Continue reading
Below are the valuation targets for Barrick Gold Corp. (GOLD) for the next 10 years. Continue reading
On April 23, 2019, we said the following of interest rates:
“If the current run of stability in rates is anything like the period of 2015 to 2016, we should see a sharp drop in rates…”
At the time, rates had been in a trading range, as seen below.
The drop in the 3-month Treasury has been nothing short of phenomenal. However, the question on everyone’s mind is, how far down? We attempt to address this in the following commentary. Continue reading
Below is the annual 52-week low for New England Electric Systems (NES) from 1958 to 1967. We’ve also included the 3-month Treasury Bill as a comparison to show how utility stocks perform against the backdrop of rising interest rates.
In this example, the 3-month Treasury Bill increased from 1.77% to 4.31%. Meanwhile, New England Electric Systems (NES) had a 52-week low range from $14.50 to $23.50.
Below is the annual 52-week low for Ohio Edison (OEC) from 1958 to 1967. We’ve also included the 3-month Treasury Bill as a comparison to show how utility stocks perform against the backdrop of rising interest rates.
In this example, the 3-month Treasury Bill increased from 1.77% to 4.31%. Meanwhile, Ohio Edison (OE) had a 52-week low range from $12.75 to $27.87.
Posted in 10-year Targets, 1958-1968, Chart of the Day, interest rates, Ohio Edison, OSE
Performance Review
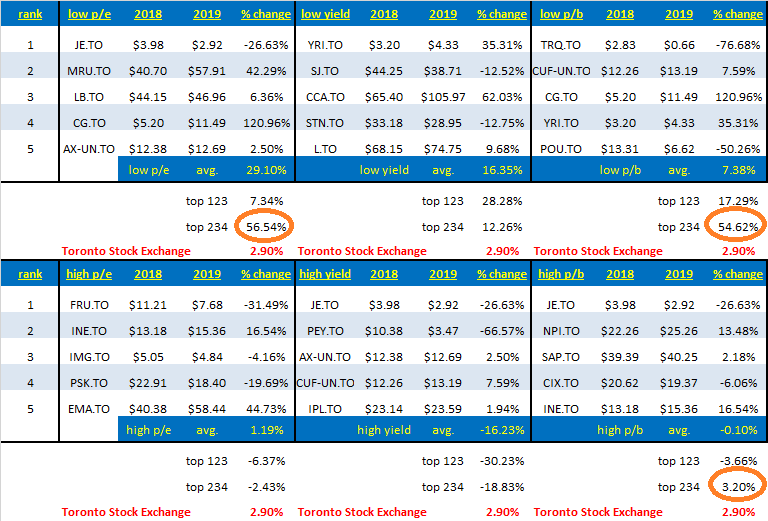
Below we compare the performance of the top five stocks in the respective fundamental categories as published on May 20, 2018 covering the period from May 18, 2018 to June 18, 2019 (intraday).
On May 18, 2018, the Toronto Stock Exchange closed at 16,162.30 while on an intraday basis, The TSX currently trades at 16,504.73. The change in the Toronto Stock Exchange from May 2018 to June 2019 is +2.11%.
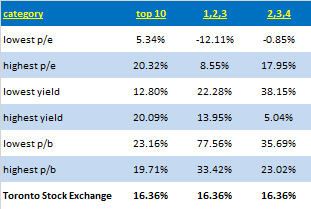
Overall, our categories exceeded the TSX by a wide margin which is a testament to the overall methodology that we apply to ranking the stocks.
At the time of our posting on May 20, 2018, we thought that the “low” category stocks would perform the best however, only the low yield stocks came close in the performance ranking.
The consistency of the low yield group to beat the high yield group should change minds when it come to “Dogs of the TSX” investment strategy which espouses buying the high yield stocks in order to beat the Toronto Stock Exchange. Yes, the high yield stocks did beat the TSX, however, wouldn’t the extra boost of nearly 12x the index be preferred over the 4x gain?
June 2019 Canadian Watch List Continue reading
Below is the annual 52-week low for Consolidated Edison (ED) from 1958 to 1968. We’ve also included the 3-month Treasury Bill as a comparison to show how utility stocks perform against the backdrop of rising interest rates.
In this example, the 3-month Treasury Bill increased from 1.77% to 4.31%. Meanwhile, Consolidated Edison (ED) had a 52-week low range from $22.00 to $30.63.
Posted in 1958-1968, Chart of the Day, Consolidated Edison, ED, interest rates
Below are the valuation targets for Nacco Industries Inc. (NC) for the next 10 years. Continue reading