The NLO team executed the following transaction(s): Continue reading
-
Topics
Archives
-
-
Recent Posts
-
-
-
-

The NLO team executed the following transaction(s): Continue reading
On August 4, 2019, we said the following of Consumer Sentiment:
A trend doesn’t define the future prospects. However, we believe that the declining trend has not completely played out. This means that we expect that the economy and stock market will languish, in the best case scenario.
Alternatively, if the Dow Jones Industrial Average can exceed the 28,750 level, the Consumer Sentiment Survey will reflect this change of direction and move above the short-term peak of May 2019.
On August 30, 2019, the University of Michigan Consumer Sentiment Survey (UMCSENT) came out with a reading of 89.8 for August 2019.

The year-over-year change in the index, along with the Dow Jones Industrial Average (DJIA), is charted below:
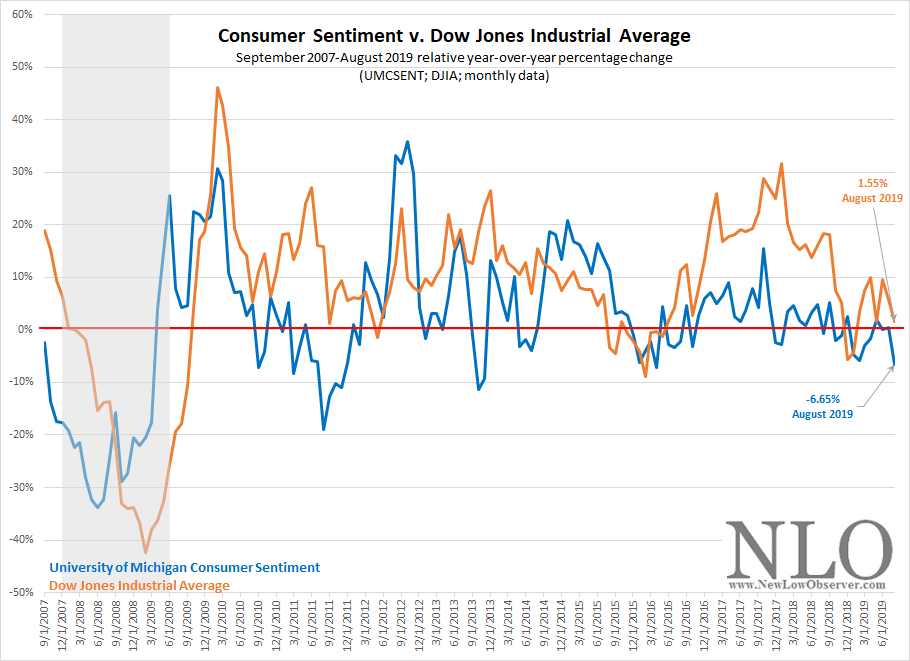
So far, our belief (that the trend for consumer sentiment is down) has played out. This was not a feat of economic forecasting, just an observation of the overall trend since the October 2017 and January 2018 peaks in the UMCSENT and the DJIA, respectively.
A quick resolution on the tariff front could bode especially well, pushing the DJIA higher (on a YoY basis) which will be quickly translated into the UMCSENT.
Data Review
Some discussion has been made of the fact that on a month-over-month (MoM) basis, the August 2019 UMCSENT number has declined the most in seven years. However, the -8.74% MoM decline ranks 25th among the largest declines since the inception of the UMCSENT. We’re in a wait and see mode as the economic picture evolves. We believe that the DJIA will be the real-time indication of the direction for the September 13, 2019 release of the UMCSENT.
See Also: Dow’s Theory on Consumer Sentiment
Below are the valuation targets for Costco Wholesale Corp (COST) for the next 10 years. Continue reading
On January 28, 2014, Barry Rithholtz came out with a piece about Lowry’s 90/90 Day indication. The article suggested that more downside days were likely as 90% downside days were not quickly resolved to the upside.
On January 31, 2014, we reviewed the available data on Lowry’s 90/90 Day indicator. Our concluding commentary at the time was as follows:
“The result of our narrow interpretation of the data indicates that the average decline of the market, by the time of the first 90% Downside Day, was -48% of the total expected decline.”
“What does this analysis suggest for the January 24, 2014 90% Downside Day? On the conservative side the Dow Industrials could bottom at 15,144.16. On the extreme the slide in the market could end at 14,076.66.”
Below is the illustration of where the January 24, 2014 decline stood relative to the peak at 16,576.66 and the bottom at 15,372.80 and the subsequent rise that followed.
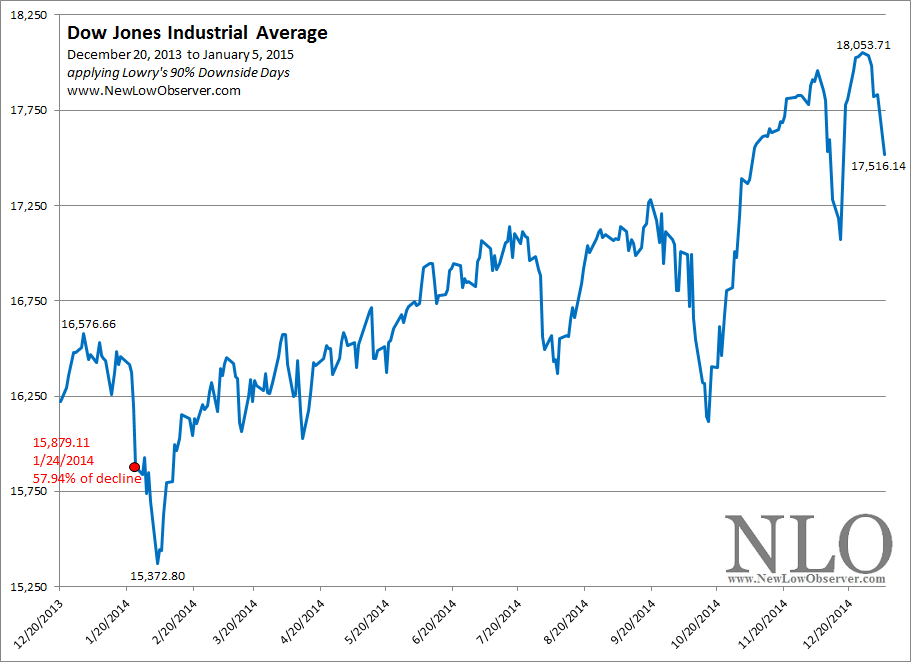
A distinction that needs to be made is Rithholtz’s assertion that the 90% Downside Day was reflective of an impending decline of at least –10% in the market. However, our limited review of the data has suggested that the very first 90% Downside Day had typically come when almost half of the down move had passed.
More data is needed so drop us a line if you see any reference to the next 90% Downside Day and we’ll run the numbers again to see what the market might do.
Posted in 90%, Lowry's, Paul Desmond, Rithholtz
Review
On May 5, 2011, when the iShares Silver Trust (SLV) was trading at $34.39, we said the following:
“What remains is a high level of uncertainty for (SLV) going forward. However, in general, we should see SLV tread water for a brief period of time before falling back to the prior low which began with the current run back in November 2008. Dow Theory suggests that a reasonable buying opportunity would exist at below line B (blue line B). However, we wouldn’t jump in at the slightest move below line B. Instead, we’d like to see the price decline to the dashed blue line at $15.41 or below.”
The chart below highlights the points of interest on the iShares Silver Trust (SLV) based on the peak price, the date we gave downside targets and the first date that the price of SLV closed below our target of $15.41.

Since our May 5, 2011 posting, SLV has not exceeded the prior peak of $47.26. Additionally, SLV has reached the $15.41 level and has outlined a significant basing pattern at that price point. Using the price of silver, we will outline the upside resistance targets based on the December 2015 low. Continue reading
Below is a chart of Wells Fargo (WFC) from 1973 to 2019 reflecting the year-over-year (YoY) percentage change.
Below are the valuation targets for Wells Fargo (WFC) over the next 10 years. Continue reading
Posted in 10-year Targets, Altimeter, WFC
In James Grant’s book Minding Mr. Market, in an article titled “Hot Light On GE” that was originally published September 14, 1990, Grant highlights a curious thought experiment (emphasis ours):
“In the time saved by not visiting GE headquarters in Stamford, Connecticut, Jay Diamond, our associate publisher, compiled a fascinating historical table. The information describes the parent company’s consolidated finances in a succession of business downturns, starting with 1932, which happens to be the year in which the forerunner to GECC was started. It ends in what may or may not prove to be a recession year, pending statistical revisions, 1989. Evolution has meant more leverage, thinner coverages, lower returns on assets, and rising contributions to consolidated income by financial activity.
“Interestingly, GE’s debt rating hasn’t changed in the past fifty-eight years, even though its financial profile has. At the bottom of the Great Depression, long-term debt was negligible, interest coverage was massively redundant, and the current ratio was better than 2:1. In 1989, a non-depression year, long-term debt constituted 77 percent of equity, interest coverage was less than 2:1 (surely a remarkably low reading) and the current ration was less than 1:1. (Grant, James. Minding Mr. Market. Times Book, Random House. 1993. page 362).”
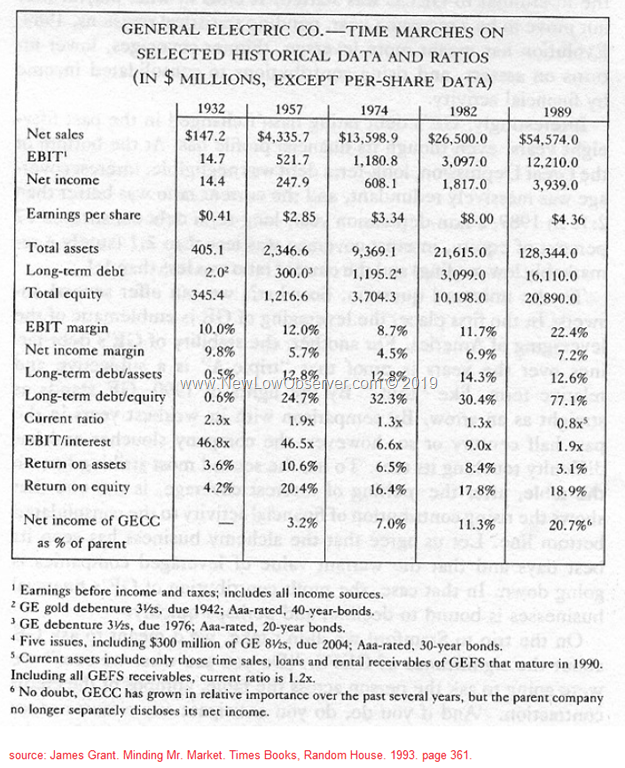
Grant goes on to explore the various rationales given by ratings agencies as to why GE could maintain a AAA rating in spite of their deteriorating financial position. What was the outcome of this erosion of financial security while holding on to a AAA rating?

GE was rewarded with a stock increase of +1,111.97% from the September 1990 close to the October 2000 peak. Somehow, GE couldn’t lose it’s AAA credit rating until after the March 9, 2009 low, after a decline in stock price of –83.96%. In fact, GE’s change in credit status was effectively a marker for the bottom in the market.
The questions for today is, after the 2009 low and recovery in the stock market while GE sinks to the lowest level in 24 years, do we think that GE has more problems that have not been revealed since September 1990? Will the recent accusation of GE committing accounting fraud be the marker for the top after the long run-up in the market since 2009?
See also: Andrew Left is Wrong About GE
Posted in accounting fraud, book, book list, General Electric, James Grant, rating agency
Previous Year Performance Review
In our ongoing review of the NLO Dividend Watch List, we have taken the top five stocks on our list from August 17, 2018 and have checked the performance one year later. The top five companies on that list can be seen in the table below.
| Symbol | Name | 2018 Price | 2019 Price | % change |
| LM | Legg Mason | 31.44 | 36.53 | 16.2% |
| IVZ | Invesco Ltd. | 24.48 | 15.64 | -36.1% |
| VMC | Vulcan Materials | 110.34 | 141.80 | 28.5% |
| AMAT | Applied Materials | 43.77 | 46.63 | 6.5% |
| PBI | Pitney Bowes Inc | 8.08 | 3.46 | -57.2% |
| Average | -8.4% | |||
| DJI | Dow Jones Industrial | 25,669.32 | 25,886.01 | 0.8% |
| SPX | S&P 500 | 2,850.13 | 2,888.68 | 1.4% |
The average loss for the top five companies was 8.4% compare to the market gain of 1.4%. The largest contributor of this loss was Pitney Bowes (PBI) whose market value fell 57%. Any company with dividend yield of 6% or more should be avoid and Pitney Bowes had a yield of nearly 10%. We thought Illinois Tool Works (ITW) is ripe for accumulation and shares gained 7.7%. At the time, we didn't think that Applied Materials (AMAT) was attractive but shares managed to gain 6.5%. However, shares of Applied Materials did fall 33% to $29 before rebounding to the current level.
U.S. Dividend Watch List: August 16, 2019
The market was on a roller coaster. After reaching an all-time high of 3,025, the fear of recession and tariff took the market down by about 5%. There is an important technical level to watch out for at 2,745 so keep an eye on it as we wait and see if the market can consolidate to move higher or lower. Continue reading
Posted in Dividend Achiever Watch List, Dividend Achievers, Dividend Watch List
Tagged members
In a recent article, Bloomberg BusinessWeek referred to their “The Death of Equities” article that was published on August 13, 1979.
Bloomberg owned up to an article that they didn’t have much to do with and used it as a point of reference for the market’s change since 1979. It seems that very often, bad calls are buried when they can be used as lessons. Good job Bloomberg BusinessWeek.

What stood out to us about the article is the reference to the performance of the Dow Jones Industrial Average at +9,000% compared to the S&P 500 Index at +7,000%. Many contend that the Dow Jones Industrial Average is an outdated index and that the S&P 500 is “better” because of the broader diversification being representative of the U.S. economy.
Our view has always been, go with the index that has the longest history of data. In this case, the Dow Jones Industrial Average has published record of data going back to 1896 while the S&P 500 goes back to 1957. Also, greater concentration does better than broad diversification when selecting within the “blue chip” category of stocks.
See Also:
Summary
Review
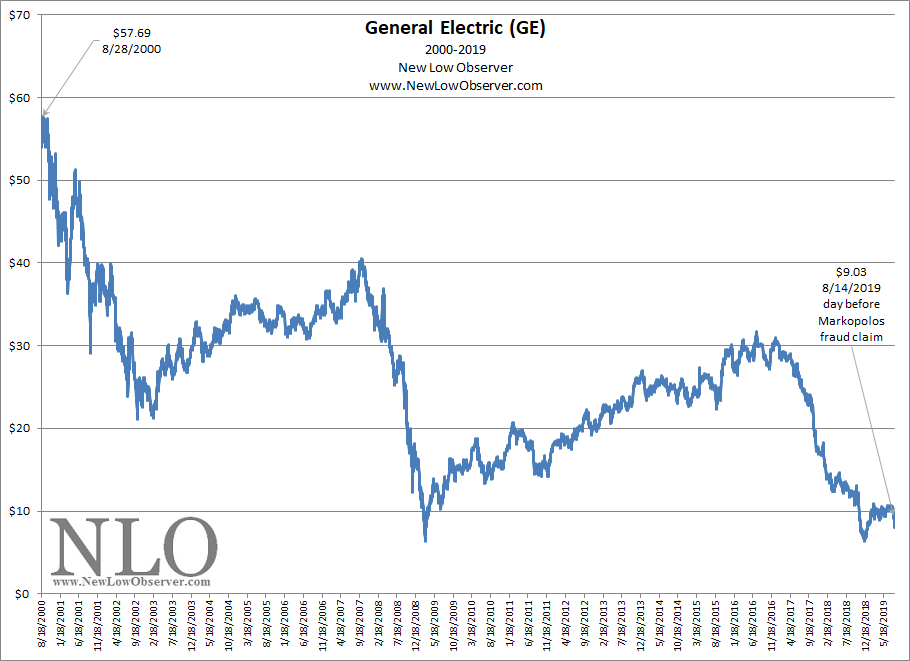
On August 28, 2000, the closing high for General Electric (GE) was $57.69. On August 14, 2019, the closing price for General Electric was $9.03.
The Charge
In a republished Bloomberg article written by Katherine Chiglinsky, Richard Clough and Jack Pitcher found at Yahoo!Finance, Harry Markopolos claims that General Electric is committing “accounting fraud.”

The Rebuttal
For its part, General Electric rejects the claim of Markopolos and says:
“The claims made by Mr. Markopolos are meritless. The Company has never met, spoken to or had contact with Mr. Markopolos, and we are extremely disappointed that an individual with no direct knowledge of GE would choose to make such serious and unsubstantiated claims. GE operates at the highest level of integrity and stands behind its financial reporting. We remain focused on running our businesses every day, following the strategic path we have laid out.”

In Defense of General Electric
On August 16, 2019, in defense of GE, according to Andrew Left of Citron Research:
“Aggressive accounting and fraud are two different animals. The SEC has allowed aggressive accounting for years, which has helped fuel a growing economy. If GE was committing fraud then it has been a grand scale conspiracy by thousands of accountants, auditors, and division CFOs who have all secretly collaborated over the past 20 years.”

Aggressive Accounting is Fraud
On August 4, 2009, the Securities and Exchange Commission (SEC) announced that it had reached a $50 million fraud settlement with General Electric. In the published press release, it was said that:
“‘GE bent the accounting rules beyond the breaking point,’ said Robert Khuzami, Director of the SEC's Division of Enforcement. ‘Overly aggressive accounting can distort a company's true financial condition and mislead investors.’”

Conclusions
See Also:
Posted in accounting fraud, Andrew Left, GE, Harry Markopolos, SEC
Below is a chart of Berkshire Hathaway (BRK-A) from 1981 to 2019 reflecting the year-over-year (YoY) percentage change.
Below are the valuation targets for Berkshire Hathaway (BRK-A) over the next 10 years. Continue reading
Posted in 10-year Targets, Altimeter, BRK-A
The NLO team executed the following transaction(s): Continue reading
Below is the Year-Over-Year percentage change data from FINRA’s Margin Statistics.
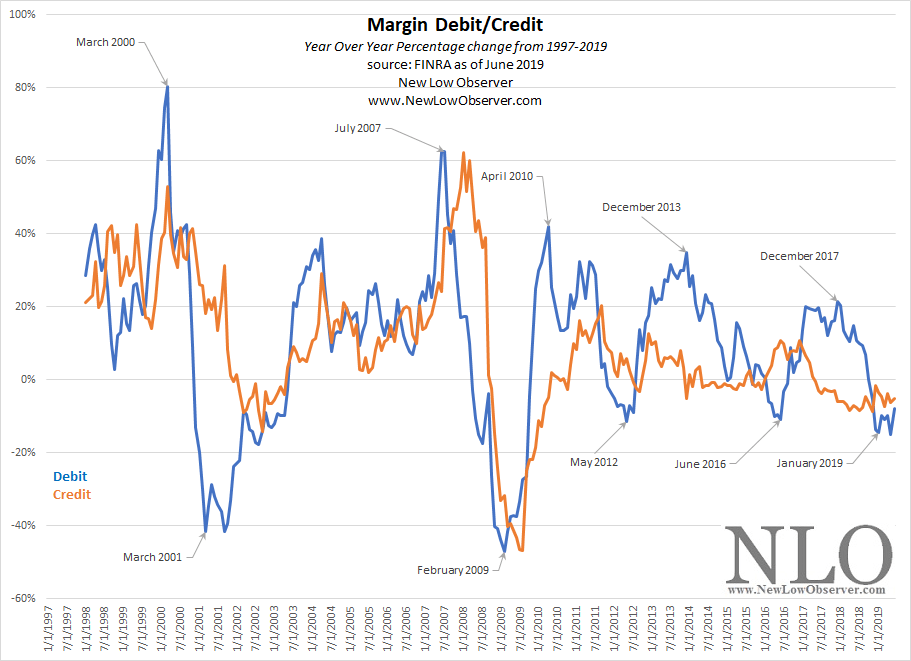
We’ve combined the data that ends in January 2010 with the data that begins in February 2010 from the same data source. The dates on the chart generally coincide with market peaks and trough.
Posted in Margin Debit-Credit