Monthly Archives: October 2010

Homestake Mining: The Exception that Proves the Rule

In order to better understand the relationship of precious metals and precious metal stocks it is critical that investors get familiar with the periods of peaks and troughs of the gold and silver markets. Without this knowledge hardened gold and silver investors will succumb to forces that will result in major losses of capital.
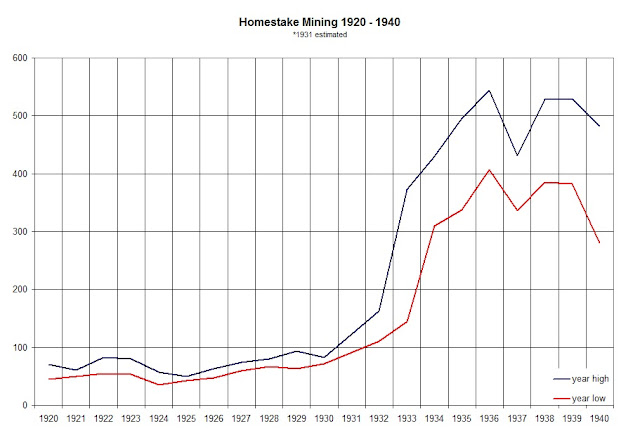
In a prior article on gold we gave an example of how gold stocks in general suffered their biggest percentage loss from 1924 to 1932. However, in that same period, one gold stock, Homestake Mining [HM], managed to not only defy the declining trend but increased in value beyond all expectation. In the period from 1891 to 1987, Homestake Mining increased in value from $9 over $5000 per share. Because it is our assertion that gold and gold stocks rise and fall with the general market (either leading or slightly lagging), we will demonstrate that Homestake Mining is the exception that proves the rule.
Homestake Stock Splits:
  • 8 for 1 1937
  • 2 for 1 1968
  • 2 for 1 1974
  • 3 for 2 1980
  • 2 for 1 1983
  • 2 for 1 1987
This article will address several specific reasons why Homestake Mining [HM] was able to increase in value from $71 to $528 in the period from 1920 to 1940. It is important to note that of the reasons that we provide, no one factor could answer for the rise of Homestake Mining. However, the extent of the combined characteristics far outweighed the concerns gold investors had about the alternative gold stocks during the same period, especially from 1924 to 1933.
There are two kinds of factors that affected the price of Homestake Mining [HM]. One set are those that Homestake Mining cannot control while the second set are those that can be controlled. Those matters not in the control of the management of Homestake Mining [HM] helped to provide a support for the price of the stock. At the same time, those actions taken by the management of Homestake helped to significantly boost the price of Homestake Mining. The combination of the two elements allowed Homestake to emerge as the best performing gold stock in the worst possible markets.
We’ll first address the issues that were not in the control of Homestake Mining [HM]. The most important matter not in the control of Homestake management was the fixing of the gold price. With the price of gold being fixed, the share price and earnings of gold stocks were considered to be stable. This was especially true when the price of other commodities were falling. Few gold bugs will take on the seemingly tabooed topic of the price of gold being fixed as the reason gold and gold stocks were a refuge to investors. However, this alone, being fixed, is the basis by which all myths of gold being a safe haven are built upon.
In more recent times, without a guaranteed price for gold, the commodity has fallen precipitously while gold stocks have been decimated. Some eternal gold bulls would say that during the market decline of 2007 to 2009 with the price of gold “only” falling 25%, in contrast to the Dow Industrials falling 40%, then it was an appropriate hedge. However, using the Philadelphia Gold and Silver Stock index (XAU), (a comparison of equity index to equity index) the decline was nearly 70% in a span of less than 1 year from March 2008 to November 2008. Gold was far from a source of stability during market panics of centuries past.
The next issue not in Homestake’s control was the limiting of the ability of the public to actually own (hoard) gold through the use of Executive Order 6102 issued by Franklin D. Roosevelt on April 5, 1933. This forced investors and savers in the U.S. to seek out the only alternative that existed which was gold equities. When markets seem to be falling apart, investors will seek out whatever happens to be the most stable option. Since owning gold wasn’t available the next best alternative was publicly traded gold stocks.
Also in 1933, President Franklin D. Roosevelt, through Executive Order 6260, authorized the U.S. Treasury to purchase gold at the highest traded world price allowing gold mining companies to increase their earnings by almost 50%. The purpose of this was to incentivize domestic producers to increase their output to shore up the U.S. government’s large outflow of gold that took place from 1929 to 1933.
Factors that were in the control of the management of Homestake Mining [HM] were many and especially effective in getting the stock price to increase in value. The cornerstone of Homestake’s success was their dividend policy. 53 years of continuous dividend payments helped Homestake grow to become the default choice for gold stock investments. The only year that Homestake didn’t pay a dividend was in 1920 which was a reflection of the state of the market for that year.
During times of crisis or when it was felt that the monetary situation was weakening, the management of Homestake Mining would increase the dividend or they would pay an extra dividend. This kind of proactive behavior boosted demand for the stock from institutions and the public even when the dividend exceeded the actual earnings. As an example, after Great Britain abandoned the gold standard, Homestake increased the dividend from $6 to $7.80 in 1931.
On other occasions, Homestake would routinely declare an extra dividend of $1. This dividend would typically come each September, which was in addition to the previously declared payments. While not guaranteed, the $1 extra dividend was paid almost every year and sometimes two or three times within a single year.
Inevitably the payments of dividends would only go so far. Without a profitable business, Homestake would be broke. To resolve this issue, Homestake Mining management was aggressive at increasing efficiencies. In the span of a five-year period, Homestake management was able to nearly double the gold recovery from $3.77 in 1925 to $6.17 in 1930.
The final piece that was essential to the incredible increase of Homestake Mining was the fact that the stock was thinly traded. This critical element, along with the others mentioned before, ensured that a gold mine in the Dakota territory, initially started by George Hearst (father of William Randolph Hearst), Lloyd Tevis and J.B. Haggin, would increase from $9 in 1891 to well over $5000 (unadjusted) by 1987.
The lessons of Homestake Mining may simply be a matter of circumstance, unfair labor practices, below market wages and the acquisition of land in the most unscrupulous fashion. However, some lessons about how Homestake management operated are likely to prove useful to the understanding the reasons why Homestake’s stock price continued to go up in value when others didn’t but should have.


Source Citations:

  • “Abreast of the Market.” Wall Street Journal. December 16, 1931. page 8.
  • “Abreast of the Market.” Wall Street Journal. May 6, 1932. page 8.
  • Rice, Claude T. “Premium Paid for Homestake.” Wall Street Journal. May 4, 1933. page 10.
  • “Gold Ruling Adds to Miners’ Income.” Wall Street Journal. August 30, 1933. page 1.
  • Poor’s High and Low Prices 1920-1930. Poor’s Publishing Company. 1931.
  • Poor’s High and Low Prices 1924-1933. Poor’s Publishing Company. 1934.
  • Poor’s High and Low Prices 1932-1940. Poor’s Publishing Company. 1941.

November Ex-Dividend Dates

Below are the approximate ex-dividend dates for the month of November for companies that appear on our Dividend Achiever, Nasdaq 100, Dow Jones Transportation Index and International Dividend Achiever Watch Lists. All companies are ranked by ex-dividend dates.
Companies that show up on our Watch Lists could be considered the equivalent of the bargain bin of high quality blue chip stocks. Because these companies have increased their dividends every year for at least 10 years in a row or are part of the Nasdaq 100 and within 20% of their respective 52-week low, you know that you’re not overpaying for a company that has demonstrated profitability and the ability to rebound from challenging times.
Symbol Name Price % from Low Yield payout ratio Ex-Div
TMP Tompkins Financial Corp. $38.99 12.54% 3.40% 43.04% 11/2/2010
WFC Wells Fargo & Co $25.94 12.68% 0.80% 11.70% 11/2/2010
WSC Wesco Financial Corp $360.83 13.35% 0.50% 18.02% 11/2/2010
CWT California Water Service $37.29 10.29% 3.20% 64.32% 11/3/2010
SJW SJW Corp $24.30 15.99% 2.80% 79.07% 11/3/2010
INTC Intel Corp $20.47 16.31% 3.10% 33.87% 11/3/2010
AWR American States Water $37.34 19.68% 2.80% 63.80% 11/3/2010
SHEN Shenandoah Tele $18.16 16.71% 1.70% 32.67% 11/5/2010
EGN Energen Corp $44.65 10.93% 1.10% 13.47% 11/9/2010
UL Unilever PLC $28.86 12.12% 3.80% 58.82% 11/9/2010
PBI Pitney Bowes Inc. $21.60 13.33% 6.60% 88.48% 11/9/2010
UN Unilever NV $29.67 14.03% 3.70% 58.82% 11/9/2010
OTTR Otter Tail Corp $20.91 14.64% 5.60% 495.83% 11/9/2010
TFX Teleflex Inc $56.12 17.11% 2.30% 30.49% 11/9/2010
XOM Exxon Mobil Corp $66.22 18.38% 2.60% 33.98% 11/9/2010
MSEX Middlesex Water Co $17.77 20.56% 4.10% 85.71% 11/9/2010
LLY Eli Lilly and Co $35.15 9.78% 5.60% 44.95% 11/10/2010
DHI D.R. Horton, Inc. $10.40 10.52% 1.40% 115.38% 11/10/2010
ALTE Alterra Capital Holdings $20.29 19.21% 2.30% 13.04% 11/11/2010
MSA Mine Safety Appliances $26.97 20.40% 3.70% 89.29% 11/14/2010
HNI HNI Corp $24.77 8.64% 3.30% 1075.00% 11/16/2010
STR Questar Corp $17.00 14.40% 3.30% 20.00% 11/16/2010
PRE PartnerRe Ltd. $79.86 15.52% 2.40% 13.09% 11/16/2010
MSFT Microsoft Corp $26.28 15.62% 2.50% 30.48% 11/16/2010
PSO Pearson, Plc $15.28 17.90% 2.60% 42.27% 11/16/2010
RBA Ritchie Bros. Auctioneers $20.71 20.62% 2.00% 60.87% 11/16/2010
TGT Target Corp $52.36 16.07% 1.90% 27.47% 11/17/2010
TRH Transatlantic Holdings $52.21 18.44% 1.60% 13.38% 11/17/2010
ATO Atmos Energy Corp $29.49 14.04% 4.60% 66.34% 11/21/2010
SBSI Southside Bancshares, Inc. $18.82 8.22% 3.50% 25.76% 11/22/2010
AMAT Applied Materials $12.25 19.28% 2.30% 62.22% 11/22/2010
FMER FirstMerit Corp $17.24 4.17% 3.60% 65.31% 11/24/2010
BOH Bank of Hawaii Corp $43.34 4.18% 4.10% 49.32% 11/25/2010
ESLT Elbit Systems $53.96 11.26% 2.20% 24.69% 11/25/2010
ALL Allstate Corp $30.43 13.29% 2.40% 43.24% 11/25/2010
JNJ Johnson & Johnson $63.56 11.78% 3.40% 44.35% 11/26/2010
ONB Old National Bancorp $9.51 4.51% 2.90% 147.37% 11/28/2010
MLM Martin Marietta Materials $79.87 11.71% 2.00% 88.89% 11/28/2010
CFR Cullen/Frost Bankers $52.83 15.68% 3.40% 55.05% 11/28/2010
BGG Briggs & Stratton $17.68 12.76% 2.50% 59.46% 11/29/2010
AROW Arrow Financial $25.04 17.61% 3.70% 50.26% 11/29/2010
UFPI Universal Forest Products $30.43 18.13% 1.30% 47.06% 11/29/2010
If you happen to be researching these companies for potential investment, it would be advisable to consider the ex-dividend date prior to possible purchases. Owning the shares of the company that you're interested in before the ex-dividend date entitles you to the upcoming dividend payment.
Owning the shares on or after the ex-dividend date means that you would have to wait at least three months before receipt of the next dividend payment. Please verify the ex-dividend date and payout ratio before committing funds to these stocks. Additionally, do not base your next long or short-term purchase on the dividend payment or yield. Instead, get as much research in as you possibly can before the ex-dividend date "just in case" you're actually interested in buying the stock. Payout ratios that exceed 100% should be considered speculative investments.

Please revisit New Low Observer for edits and revisions to this post. Email us.

NLO Dividend Watch List

Top Five Performance Review
The following is a total return (appreciation plus dividends) performance review of our top five Dividend Watch List from October 22, 2009 to October 22, 2010:

Name symbol
with div.
without div.
Shenandoah Tel.
shen
12.79%
10.67%
Wal-Mart
wmt
9.50%
7.09%
C.R. Bard
bcr
8.89%
7.97%
Weyco
weys
16.34%
13.26%
Aqua America
wtr
35.95%
31.47%
Group Average:
16.69%
14.09%
Dow Industrials ^dji
13.46%
10.43%
As a group, the average gain for the stocks mentioned was 16.69%. This is contrasted by the Dow Jones Industrial Average gain of 13.46% in the same period of time. Excluding the dividend, the top five watch list stocks gained 14.09% and the Dow Jones Industrial Average gained 10.43%.  According to the graph below, all stocks accomplished 10% within 6 months of being on the list.
 It is our expectation that only 1/3 of the companies that are part of our list will outperform the market over a one year period. However, when the market of 5,000 investment opportunities is winnowed down to what we believe are the best 50, we think that selecting one out of four companies become so much easier.

October 22, 2010 Watch List

Symbol Name Price % Yr Low P/E EPS (ttm) Div/Shr Yield Payout Ratio
BBT BB&T Corp. 22.62 4.14% 21.34 1.06 0.60 2.65% 57%
CBSH Commerce Bancshares, Inc.  36.80 4.84% 14.66 2.51 0.94 2.55% 37%
CL Colgate-Palmolive Co. 76.84 5.09% 18.34 4.19 2.12 2.76% 51%
NTRS Northern Trust Corp.  47.81 5.54% 15.68 3.05 1.12 2.34% 37%
WFSL Washington Federal, Inc.  14.78 5.80% 14.08 1.05 0.20 1.35% 19%
HRB H&R Block, Inc. 10.78 6.42% 7.38 1.46 0.60 5.57% 41%
VLY Valley National BanCorp.  13.13 8.04% 17.99 0.73 0.72 5.48% 99%
FFIN First Financial Bankshares, Inc.  47.84 9.85% 18.33 2.61 1.36 2.84% 52%
WABC Westamerica BanCorp.  51.87 10.17% 16.26 3.19 1.44 2.78% 45%
WST West Pharmaceutical Services, Inc. 36.10 10.26% 15.76 2.29 0.68 1.88% 30%
MLM Martin Marietta Materials, Inc. 78.91 10.36% 43.84 1.80 1.60 2.03% 89%
LLY Eli Lilly & Co. 35.40 10.56% 8.76 4.04 1.96 5.54% 49%
SBSI Southside Bancshares, Inc.  19.24 10.64% 7.29 2.64 0.68 3.53% 26%
PEP PepsiCo Inc. 65.01 10.66% 16.38 3.97 1.92 2.95% 48%
FUL HB Fuller Company 20.45 10.72% 13.82 1.48 0.28 1.37% 19%
BCR CR Bard, Inc. 83.01 10.87% 16.91 4.91 0.72 0.87% 15%
16 Companies


On our current list, we excluded companies that have no earnings and payout ratios in excess of 100%. Stocks that appear on our watch lists are not recommendations to buy. Instead, they are the starting point for doing your research and determining the best company to buy. Ideally, a stock that is purchased from this list is done after a considerable decline in the price and extensive due diligence.
Because our list has many great companies, we urged investors to filter for companies with less than 50% payout ratio. This should minimized the risk of dividend reductions if earnings are to fall by half. If you understand the companies' history and their ability to pay the dividend, then payout ratios in excess of 50% may be considered. We suggest readers use the March 2009 low (or companies' most distressed level in the last 2 years) as the downside projection for investing. Our view is to embrace the worse case scenario prior to investing. The November 2008 to March 2009 time frame fits that description. It is important to place these companies on your own watch list so that when the opportunity arises, you can purchase them with a greater margin of safety.
Please revisit New Low Observer for edits and revisions to this post. Email us.

Nasdaq 100 Watch List

Watch List Summary
At the end of the week for October 15, 2010, the top performing stocks from our Nasdaq 100 list for September 17, 2010 are Seagate (STX) with a gain of 38.98%, Logitech (LOGI) with a gain of 25.15% and Google (GOOG) with a gain of 22.71%.  Gains of 10% or more in a month may require mental trailing stops or selling in our estimation.  The trajectory of the top performing stocks in this category cannot continue at the same rate for too long; expect reversion to the mean.
The worst performing stock from our September 15th watch list are Urban Outfitters (URBN) down –9.12%, FLIR Systems (FLIR) down –5.32% and Steel Dynamics (STLD) down –4.40%. The average gain for the Watch List was 6.67%. In the 1-month period from September 17th to October 15th, 86% of the stocks were up while 14% of the stocks were down.
The average gain for stocks that were up was 8.45% while the average loss for stocks that fell was –3.76%. Among the top ten performing stocks the average gain was 17.94%.
From prior observations, FLIR Systems (FLIR) and Adobe Systems (ADBE) should be examined carefully as potential investment opportunities.  It is our expectation that Apollo Group will be among the companies that will be rotated out of the Nasdaq 100 index in the coming new year.
Nasdaq 100 Watch List
Below are the Nasdaq 100 companies that are within 11% of their respective 52-week lows. Stocks that appear on our watch lists are not recommendations to buy. Instead, they are the starting point for doing your research and determining the best company to buy. Ideally, a stock that is purchased from this list is done after a considerable decline in the price and rigorous due diligence.
Symbol Name Trade P/E EPS Yield P/B % from Low
APOL Apollo Group, Inc. 36.58 9.37 3.9 0 4.05 2.29%
URBN Urban Outfitters, Inc. 31 20.17 1.54 0 3.83 3.06%
FLIR FLIR Systems, Inc. 25.79 17.53 1.47 0 3.05 7.46%
INTC Intel Corporation 19.32 11.56 1.67 3.30% 2.35 9.77%
ADBE Adobe Systems 28.08 31.34 0.9 0 2.77 10.33%

Watch List Performance Review
The following is a total return (appreciation plus dividends) performance review of our Nasdaq 100 Watch List from October 15, 2009:
  • Stericycle (SRCL) up 37.95%
  • Genzyme (GENZ) up 28.93%
  • Cephalon (CEPH) up 14.33%
  • Gilead (GILD) down -19.09%
As a group, the average gain for the stocks mentioned was 15.53%. This is contrasted by the Nasdaq 100 gain of 19.64% in the same period of time. It is our expectation that only 1/3 of the companies that are part of our list will outperform the market over a one year period. However, when the market of 5,000 investment opportunities is winnowed down to what we believe are the best 50, we think that selecting one out of four companies become so much easier.
Please revisit New Low Observer for edits and revisions to this post. Email us.

Investment Observation: West Pharmaceutical Services (WST) at $36

Our investment observation today is on West Pharmaceutical Services (WST). On October 4, 2010, WST announced that it would increase the dividend payment for the 18th consecutive year by 6.25%. The dividend will be paid to shareholders of record on October 20, 2010.
According to Value Line Investment Survey, “West Pharmaceutical Services manufactures systems and component parts (stoppers, seals, syringe components) used in the delivery of injectible drugs. Also supplies packaging and delivery system components to food processors and makers of personal care products.”
With the stock of West Pharmaceutical Services (WST) trading around the $36.00 range, Value Line has estimated that the fair value is $42.60. This means that there exists 18.33% of price appreciation that has gone unrecognized so far. Value Line also indicates that WST is conservatively expected to increase to the $50 level with an annualized total return of 11% by 2013.
Although Value Line has a favorable fair value target on West Pharmaceutical Services (WST), we must take the most conservative fair value target that we can find to build into our expectations. The best alternative to arriving at fair value is with Dow’s Theory.
According to Dow Theory, West Pharmaceutical Services (WST) is fairly valued at $39.90. From the current price of $36.00, WST could easily rise 10.83% within the next six months. However, any price above the fair value mark should be considered as exceptional. According to Dow Theory, West Pharmaceutical Services (WST) has the following targets:

  • $51.67
  • $43.82
  • $39.90 (fair value)
  • $35.97
  • $28.12
WST has been on our watch list for so long that it was sufficiently overlooked until we pulled up Edison Gould’s Altimeter and realized the technical support/resistance exhibited at the $29.28 level was too pronounced to be ignored. In the chart below, you will notice that the altimeter support level is in perfect alignment with the resistance level set from 1994 to 2004 (blue line).

Our best guess of the upside and downside targets based on the altimeter are as follows:
Upside Targets Downside Targets
$39.04 $28.96
$44.16 $21.45
$57.12 $12.00
$60.96
The prospect that West Pharmaceutical Services (WST) could fall below the altimeter support level of $28.96 is not out of the question. Anyone interested in investing in this stock should put heavy emphasis on the downside targets as a means to measure personal risk tolerance.  In our view, the price action at this stage reflects the market's assessment on whether or not this company can operate as a going concern. As investors, we should only seek to acquire WST at a price below fair value with the expectation that the stock should be sold at or above fair value. Any purchases of a stock above fair value should be considered speculation at best.

Please revisit New Low Observer for edits and revisions to this post. Email us.

Flash Crash Follies

Flash Crash Follies is a running tally of stocks that get ensnared by regulations as an outgrowth of the May 6, 2010 "flash crash."  While the explosive crash of stocks (either up or down) on the NYSE is a symptom to a bigger problem, we want to chronicle what was never reported to have happened before May 6, 2010.  Action packed moves in the price of stocks that will bring pleasure, pain and finally resignation at the state of the free market as we know it. 
We've added commentary from the mouthpiece of the NYSE or NASDAQ to explain away "erroneous" trades or canceled orders.  Before long we're going to hear politicians getting into the fray on specific "erroneous" trades.  What will this devolve into nobody knows for sure.  However, we're willing to bet that in due time, the treatment of the symptom will become a distinct problem of its own.

"...the folly of human laws too often encumbers its operations." Adam Smith

September 28, 2010 (date contains Bloomberg screen shots from third party source)
Apple (AAPL), Research In Motion (RIMM), IBM (IBM), Dell (DELL), General Electric (GE), Oracle (ORCL), Microsoft (MSFT), Hewlett-Packard (HPQ)
Stocks of the above noted companies took a dive at the same time on September 28, 2010.  The exchanges didn't provide commentary on the actions taken as a result of the instantaneous decline and rise in value.  many have attributed specific declines to "newsworthy" issues related to the specific companies.  However, no one has stepped forward to explain the statistical anomally of so many companies experiencing the same issue at exactly the same time.

July 29, 2010 (date contains article link from third party source)
Cisco Corp. (CSCO)
At 10:41am EST, Cisco (CSCO) shares spiked by 11% due to an order imbalanced triggered by 100 shares.  CSCO rose from $23.37 to $26 which triggered circuit breakers prompting Jamie Selway, managing director at broker White Cap Trading LLC in New York, “We’re stopping trading in incomparably liquid products because of dumb mistakes...”  In this instance, the NYSE-owned AMEX which handles very few trades in CSCO could not fulfill orders placed on their exchange even through there were plenty of shares being trades on alternative exchanges.  Ultimately, CSCO was trading with the liquidity of a penny stock.  Soon enough, firms with intimate knowledge of where they place their trade can play the illiquidity to their advantage.  The AMEX and other small exchanges will be under attack.

July 23, 2010 (date contains article link from third party source)
Genzyme Corp. (GENZ)
At 1:18pm EST and 1:25pm EST, Genzyme Corp. (GENZ) triggered circuit breakers when the stock attempted to rise by more than 10% on two separate occasions within the same day due to rumors about a takeover. Nasdaq OMX spokesman Robert Madden gave no justification for the halt in trading. However, traders and money managers expressed the sentiment that “at some point, you need to let efficient market theory rule how stocks trade.” In this case, Genzyme wasn't allowed to rise as much as speculators were willing to bid the price up.

July 6, 2010 (date contains article link from third party source)
Anadarko Petroleum (APC)
At 10:56am EDT to 11:01am EDT, Anadarko shares trade from $39.14 to $99,999.99. “‘We are still learning from the experience,’ he [Ray Pellechia] said.”
June 29, 2010  (date contains article link from third party source)
Citigroup (C)
At 1:03pm EDT, Citigroup shares trade from $3.80 to $3.3174 or down 12.7%. “The erroneous trade was subsequently canceled, NYSE spokesman Ray Pellechia said.”

June 16, 2010 (date contains article link from third party source)
Washington Post (WPO)
At 3:07pm EDT Washington Post stock trades from $450 to $919 or up 104%. All trades were cancelled. “‘What happened today was not due to a substantive, true move in the stock. It was simply an error,’ NYSE spokesman Ray Pellechia said.”
 
Email our team here.

NLO Dividend Watch List

Watch List Summary
Revisiting the previous list has provided great insight into those stocks that have either underperformed or overperformed.  The best performing stock from our September 24th list was Flushing Financial (FFIC).  After being listed as the top 10 bank stocks on TheStreet, the shares of FFIC are finally getting some recognition.


Although we don't have much insight into FFIC, we suggest readers look into our recent commentary on Northern Trust (NTRS).  Northern Trust was listed #3 on TheStreet's 10 Banks That Defy The Great Recession.  The #1 bank on that list was Bank of Hawaii (BOH). We wrote about this name back on January 12, 2009 and more recently in our article titled "The Anatomy of a Bear Market Trade." Another bank that made TheStreet.com's list and our list as well is US Bank (USB).  Although we're typically averse to investing in banking institutions, we find the current environment favorable to regional and multinational banks.


The worst performing stock from our September 24th list was Colgate (CL).  After falling 4% in two weeks, this name is becoming interesting at the current dividend yield.  Colgate is in the undervalued range, according to Investment Quality Trends (http://www.iqtrends.com/).

Top Five Performance Review

In our ongoing review of the NLO Dividend Watch List, we have taken the top five stocks on our list from October 9, 2009 and have check their performance one year later.  The top five companies on that list were Wal-Mart (WMT), Cardinal Health (CAH), Weyco Group (WEYS), Bard Corp. (BCR), and Piedmont Natural Gas (PNY).

As a group, the top five companies on our Dividend List averaged a gain of 14.47% in the last year.  This compares with the Dow Jones Industrial Average gain of 11.57% in the same one year time frame.  The top performing stock of the group was Piedmont Natural Gas (PNY) which closes out the year with a gain of 23.81%.  The worst performing stock was Bard Corp. (BCR) with a paltry gain of 6.47% in the one year time period.  The graph below demonstrates that all stocks achieved 10% gains within six months of reaching a new low.

Chart courtesy of Yahoo!Finance and Commodity Systems Inc (CSI)


October 8, 2010 Watch List
Symbol Name Price % Yr Low P/E EPS (ttm) Div/Shr Yield Payout Ratio
CL Colgate-Palmolive Co. 74.90 2.43% 17.88 4.19 2.12 2.83% 51%
CAG ConAgra Foods, Inc. 21.87 6.42% 13.84 1.58 0.92 4.21% 58%
NTRS Northern Trust Corp.  48.35 6.73% 15.85 3.05 1.12 2.32% 37%
WST West Pharmaceutical 35.11 7.24% 15.33 2.29 0.64 1.82% 28%
BBT BB&T Corp. 23.58 8.56% 22.25 1.06 0.60 2.54% 57%
MDT Medtronic 33.45 8.60% 10.59 3.16 0.90 2.69% 28%
BEC Beckman Coulter 47.95 9.10% 22.83 2.10 0.72 1.50% 34%
SBSI Southside Bancshares 18.98 9.14% 7.19 2.64 0.68 3.58% 26%
USB U.S. BanCorp. 22.31 9.15% 16.05 1.39 0.20 0.90% 14%
WFSL Washington Federal 15.27 9.31% 14.54 1.05 0.20 1.31% 19%
FUL HB Fuller Company 20.31 9.96% 13.72 1.48 0.28 1.38% 19%
HCC HCC Insurance Holdings 26.24 10.02% 9.02 2.91 0.58 2.21% 20%
TR Tootsie Roll Industries 25.53 10.04% 28.05 0.91 0.32 1.25% 35%
HGIC Harleysville Group Inc.  33.08 10.08% 12.48 2.65 1.44 4.35% 54%
FFIN First Financial Bankshares 47.99 10.20% 18.39 2.61 1.36 2.83% 52%
MLM Martin Marietta Materials 78.96 10.43% 43.87 1.80 1.60 2.03% 89%
OMI Owens & Minor 28.21 10.54% 14.32 1.97 0.71 2.52% 36%
CBSH Commerce Bancshares 38.13 10.63% 15.50 2.46 0.94 2.47% 38%
BOH Bank of Hawaii Corp. 45.30 10.87% 12.41 3.65 1.80 3.97% 49%
INTC Intel 19.52 10.91% 11.69 1.67 0.63 3.23% 38%
20 Companies


On our current list, we excluded companies that have no earnings and payout ratios in excess of 100%. Stocks that appear on our watch lists are not recommendations to buy. Instead, they are the starting point for doing your research and determining the best company to buy. Ideally, a stock that is purchased from this list is done after a considerable decline in the price and extensive due diligence.
Because our list has many great companies, we urged investors to filter for companies with less than 50% payout ratio. This should minimized the risk of dividend reductions if earnings are to fall by half. If you understand the companies' history and their ability to pay the dividend, then payout ratios in excess of 50% may be considered. We suggest readers use the March 2009 low (or companies' most distressed level in the last 2 years) as the downside projection for investing. Our view is to embrace the worse case scenario prior to investing. The November 2008 to March 2009 time frame fits that description. It is important to place these companies on your own watch list so that when the opportunity arises, you can purchase them with a greater margin of safety.
Email our team here.

Dick Bove Tries to Salvage a Bad Call on Northern Trust

A hotly debated topic of the New Low Observer team is a note that came out on Monday October 4, 2010 (indicated in the green circle below) from renown Rochdale Securities banking analyst Dick Bove. Because we know that Mr. Bove hasn’t been very consistent or successful with his comments about the banking sector recently, we weren’t too sure how to take the commentary that “…Credit Suisse (CS) should buy Northern Trust.” After all, we had issued an Investment Observation of Northern Trust on September 1, 2010 (indicated in the purple circle below) indicating that regardless of the direction of the economy, Northern Trust (NTRS) would be among the leading banking/money management firms.
On one side of the debate, it was thought that Bove was implying that Northern Trust (NTRS) was undervalued and should be bought. On the other side of the debate, it was thought that maybe we overlooked something about NTRS and therefore we should reconsider our Investment Observation. Both views have their merit however the truth of the matter may be something else altogether.
It turns out that Dick Bove gave a buy recommendation of NorthernTrust (NTRS) on August 19, 2009 (indicated in the red circle below) when the stock price was at $59.92. As part of his recommendation of NTRS, Bove said that, “Northern Trust’s balance sheet is so strong it actually shames its competitors.” Almost as if on cue, the price of NTRS fell 20% by December. After falling to the $48 level, NTRS went right back to the $59 level in the next 4-month period, topping out in April of 2010. After the April top, NTRS fell as low as $46 in early July 2010.
It seems that the reality of Bove’s October 4, 2010 comments that Credit Suisse buy Northern Trust and that “[NTRS] management has no ability to withstand a takeover bid. Nor has [NTRS] management shown any skill in getting the price of the stock higher," is more of a reflection of an attempt to salvage a bad call or an unwillingness to “reiterate” his August 19, 2009 buy recommendation.
Our recommendation of Northern Trust (NTRS) at $47.26 still stands. In addition, for those who have already bought the stock, we recommend reconsidering additional purchases if the stock falls by 20% or more.

When, Not If, Dividends Matter

In a note on Barry Ritholtz’s The Big Picture there is an article dated October 3, 2010 that asks the age old question, “Do Dividends Matter?” The author of the article compares the performance of dividend paying stocks against non-dividend paying stocks that are constituents of the S&P 500. After selecting a period of time from December 31, 2009 to September 29, 2010, the author breaks down the analysis by separating the performance of the stocks into three distinct periods; 12/31/2009 to 9/29/10, 4/23/2010 to 9/29/2010 and 12/31/2009 to 4/23/2010.
The conclusion of the article is that whether a company pays a dividend isn’t as important as people think. However, the conclusion comes as no surprise since the period in question is less than a year and the goal was to determine the impact dividends play in the performance of a stock’s price. All measures within a year cannot reveal the same amount of impact of dividends over several decades. In a strange twist, the article proves exactly what the New Low Observer has been saying all along.
First, market performance is often measured in a year or less. As market observers, we don’t control this characteristic, we only make certain that our investment strategy reflects and caters to this fact. This “research” on Ritholtz’s site doesn’t hold up since it doesn’t even span a decade of continuous examination. An individual would do better to accept the mountains of buy-and-hold evidence; which indicates that dividends contribute more than half the total return when measured over a span of 40 years or more. Just be sure that you’ve got a 40-year investment time horizon before you act on such factual data.
Second, the performance of the dividend paying stocks in Tier 1, Tier 2 and Tier 3 over the December 31, 2009 to April 23, 2010 period, beat the non-dividend paying stocks resoundingly. Tier 3, the lowest performing of the dividend paying stocks, outperformed the non-dividend paying stocks by 2% over the given timeframe. As regular readers of our site know, we seek mediocre returns of 9%-12% from each investment. This means that we would have sold somewhere short of 20% and then moved on to the next stock. The worst performing group, Tier 5 of the dividend paying stocks, was only able to achieve 7.57% in the 4-month period. However, if Tier 5 stocks were bought and sold in the time selected, the annualized return would have been 24.41%.
Finally, low dividend yielding stocks easily outperform high yielding stocks. In the survey, Tier 1 had the lowest yielding stocks while Tier 5 had the highest yielding stocks. Tier 1, Tier 2 and Tier 3 of the dividend paying stocks in the “study” easily outperformed the market and the non-dividend paying stocks. Our article titled “Low Yielding Stocks Offer Exceptional Gains” outlined the importance of quality of dividends rather than dividend yield. We were specific in pointing out that what is lacking in yield is typically made up for in appreciation of the stock price. This is very important because most people who have been burned in their investments typically seek out alternatives that might seem to help make up for substantial losses. Unfortunately, this is the time when the markets are about to turn around and the high yielding stocks underperform on the upswing.
Again, we don’t attempt to explain why information on the markets comes in two incongruent varieties, focused in the short-term data with an inappropriate strategy or focused on long-term data that is incompatible with real world investment time frames. We only observe that, within any one-year time span a stock reaches a new low. If narrowed down to the number of companies that have a proven track record of dividend increases or are part of an index that most mutual funds are required to buy, then the odds are in your favor to obtain reasonable gains that exceed the historical market returns. This (il)logical thinking only works if you’re willing to sell in the same time frame that your analysis takes place. These factors are frequently left out of the “research” of whether dividend matter or not.

International Dividend High Fliers

Below are the top current and former international dividend high fliers that are within 20% of their 52-week low and trade as ADRs on the New York Stock Exchange. These are companies that have had a history of dividend increases over the last several years in a row according to MergentOnline.com.
Symbol Name Trade P/E EPS Yield P/B % from Low
IMO Imperial Oil Ltd 38.2 16.2 2.36 1.10% 3.2 8.70%
DEG Etablissements Delhaize Freres 71.9 10.5 6.86 2.00% 1.1 9.48%
ESLT Elbit Systems Ltd. 53.1 11.1 4.78 2.20% 2.5 9.51%
SNN Smith & Nephew SNATS, Inc. 46.2 14.9 3.11 1.30% 3.5 12.05%
CRH CRH PLC 16.7 16.2 1.03 2.80% 0.8 13.35%
UL Unilever PLC 29.2 16.1 1.82 3.80% 4.9 13.60%
TEVA Teva Pharmaceutical Industries 53.5 19 2.82 1.30% 2.5 13.90%
UN Unilever NV 29.9 16.4 1.82 3.70% 5 14.95%
CHL China Mobile Ltd 51.5 11.9 4.32 3.20% 2.6 16.05%
PRE PartnerRe Ltd 80.5 5.26 15.28 2.50% 0.9 16.37%
STO Statoil ASA 21.4 13.7 1.57 3.70% 1.9 16.48%
TMX Telefonos de Mexico 15.2 9.61 1.58 5.10% 4 16.77%
PBR Petroleo Brasileiro 36.5 9 4.05 0.40% 1.6 16.82%
ALTE Alterra Capital 19.9 5.41 3.68 2.40% 0.8 17.10%
SYT Syngenta AG 50.3 19.3 2.61 1.80% 3.4 17.10%
NGG National Grid Transco 43.2 9.78 4.42 8.20% 3.2 17.65%
RNR RenaissanceRe 59.5 4.28 13.9 1.70% 1.1 17.84%
ASR Grupo Aeroportuario del Sureste 47.9 16.4 2.92 4.00% 1.3 18.05%
SNY Sanofi-Aventis 33.1 10.6 3.12 3.30% 1.2 18.24%
TLM Talisman Energy Inc. 17.5 24.6 0.71 1.40% 1.6 18.98%
CWCO Consolidated Water Co. Ltd. 9.72 37.5 0.26 3.20% 1.1 20.00%
International Watch List Performance Review
Below is the performance of the top ten companies on our International Dividend Achiever Watch List from August 13, 2010.

It is interesting to note that only two stocks, Consolidated Water (CWCO) and CRH (CRH), continued their declining trend. It remains to be seen whether or not we've witnessed the bottom for both stocks. However, the gains made from 7 of the 10 stocks has exceeded the average return for the group. If viewed from our short-sighted perspective of annualized return, the worst that could have been done would be 47.45%.

Symbol Name 10/1/2010 8/13/2010 % Change
SNY Sanofi-Aventis SA $33.12 $28.64 15.64%
ALTE Alterra Capital Holdings Ltd $19.93 $17.65 12.92%
PRE PartnerRe Ltd. $80.45 $72.55 10.89%
UN Unilever NV $29.91 $27.02 10.70%
UL Unilever PLC $29.24 $26.66 9.68%
DEG Etablissements Delhaize Freres $71.92 $66.30 8.48%
TEVA Teva Pharmaceutical $53.52 $49.97 7.10%
ESLT Elbit Systems Ltd. $53.11 $52.10 1.94%
CWCO Consolidated Water Co. Ltd. $9.72 $9.68 0.41%
CRH CRH PLC $16.73 $19.17 -12.73%
Average: 6.50%