
- Japan
- Market Indicator
- Price Momentum Indicators
- Richard Russell
- Silver
- Speed Resistance Lines
- U.S. Dividend Watch List
Category Archives: wsc
Munger, Buffett, and Dow Theory
Posted in BRK-A, Charlie Munger, Dow Theory, Warren Buffett, Wesco Financial, wsc
Tagged members
Should Berkshire Hathaway Be Trading at 1995 Prices?
No, this isn’t an article about the prospect of Berkshire Hathaway falling from the current price of $121,950 to $32,100. Instead, this is what Edson Gould’s Altimeter suggests that Berkshire Hathaway’s (BRK-A) stock price is currently trading at.
Edson Gould’s Altimeter compares the current stock price relative to the dividend that is paid by a company. As we all know, Berkshire Hathaway does not pay a dividend. So, how did we arrive at a dividend for Berkshire Hathaway? We borrowed the dividend policy of Charlie Munger’s Wesco Financial (WSC). We thought that there would be no better corporate dividend policy to replicate other than that of Warren Buffett’s right hand man.
Exactly what portion of Munger’s dividend policy did we replicate? First, we took WSC’s average dividend payout ratio of 13% from 1999-2010 and applied it to Berkshire Hathaway’s 1977 reported operating earnings of $22.54 per share. This resulted in a dividend of $2.93.
Next, we compared the compound annual growth rate [CAGR] of the dividend for Wesco Financial which was slightly more than the book value from 1999-2010, at 3.37% and 3.01%, respectively. Additionally, we took into consideration the fact that by 2010 Wesco Financial had a 38-year history of consecutive dividend increases. Because Berkshire Hathaway has a 19.8% CAGR of their book value (2011 annual report), we opted to cut that figure in half and assign a dividend growth rate of 9.9%. Our decision to cut the CAGR of the book value in half was in deference to Buffett’s desire to better deploy the capital in other investment opportunities and the possible diminished impact of the succession team upon Buffett’s “retirement.”
After borrowing the dividend policy from Buffett’s primary business partner and creating a hypothetical dividend and a compounded annual dividend growth rate, assuming regular dividend increases for the last 35 years, we believe that we have constructed a reasonable approximation of an Altimeter which is represented in the chart below.

Based on the Altimeter, our best guess is that the period from 1996 to 2008 provided consistent indications of when to add to your positions of Berkshire Hathaway (at or below green line). The period from 2008 to 2009 provided exceptional opportunities for new investors to buy Berkshire Hathaway as the markets, economy and insurance industry were in crisis mode at the exact same time.
Once the recovery in stocks started it was off to the races for most investors. Even Berkshire Hathaway was able to participate in the run-up from the 2009 low. However, on a relative basis, Berkshire’s share price was not increasing to a level that was reflective of its true value, this is in spite of getting within 10% of the 2007 high in late February 2010. Based on the Altimeter, Berkshire is currently undervalued by at least 66% and below the 2007 peak by almost 95%.
Those considering the acquisition of Berkshire Hathaway have the following upside targets to consider in the coming 2-3 years, all things being equal:
-
$175,280
-
$197,190
-
$219,100
The following are the possible downside targets:
-
$120,767
-
$105,606
After constructing a fairly conservative dividend policy, the Altimeter clearly outlines the reasons why Warren Buffett would suggest that Berkshire Hathaway will “very aggressively” buy back shares even though the stock is well within striking distance of the all time high.
Who is Edson Gould?
"Edson Gould spent over 60 years working in and studying financial markets. Gould studied the arts at Princeton, engineering at Lehigh (from where he graduated in 1922), and finance at New York University. In 1922, after working for a short time at Western Electric, he joined Moody's Investor Service as an analyst and later was editor of Moody's Stock Survey, Bond Survey, and Advisory Reports. In 1948, he began at Arthur Wiesenberger & Company, where he developed and edited the well-known Wiesenberger Investment Report and became a senior partner. He also was Research Director at E. B. Smith (which later became Smith Barney), and worked for Nuveen."
(source: Market Technicians Association. Gould, Edson Beers, Knowledge Base. Accessed April 26, 2012. link MTA reference.)
"Market technician Edson Gould always laughed at the idea of having a significant influence on the stock market, but his predictions were the most precise around. He pinpointed major bull markets and prophesied bottom-out markets as if he had his own peephole into the future. But in place of a crystal ball and wacky off-the-cuff schemes, his were smart, intensely researched and time-tested theories that made him a legend in the investment community."
(source: Fisher, Kenneth L.. 100 Minds That Made the Market. Business Classics, Woodside, CA. 1993. page 320.)
Posted in Altimeter, BRK-A, Charlie Munger, Edson Gould, Warren Buffett, Wesco Financial, wsc
Investment Policy Q&A
A Reader Asks:
In reading "lessons learned from our worse picks", the key 'lesson' was 'not adhering to our rules', mainly "one rule is to side-step stocks that have had recent cuts or no annual increase in the dividend."
Yet, Northern [Trust] has had no increases in 3 years (so even before the crash).
I realize that one should not be totally dogmatic in an investment approach. Perhaps a large % of the "good" picks also showed similar dividend lags...but then why would it be "a rule"?
Our Response:
Thanks for the great observation. This site tracks current and former Dividend Achievers. This means that stocks that had a history of dividend increases will likely be included in our investment decisions at some point in the future, even if they don’t have a current history of dividend increases. We track companies that did have a history of dividend increases because cutting the dividend may have been done for strategic purposes.
One matter about the article titled “Lessons Learned From Our Worst Picks” is that we probably didn’t put enough emphasis on how recent a dividend policy has changed. We don’t mind if there isn’t an increase nor does it matter that there is a cut. What matters most is how recent such action took place and for what reason.
In the article mentioned above, we did say the following about cuts that occurred in stocks that we selected:
“What we should have done is wait one full year after the cut, or lack of an increase, to determine the viability of the company. Keep in mind that a cut in the dividend isn’t a death sentence. In fact, cutting the dividend might be the best management move to make. However, current shareholders of the company might abandon the stock if they have a policy to hold stocks with a steady dividend (as we advise investors to do.)”
Northern Trust (NTRS) happens to be the perfect example of our investment approach in action. Based on the history of dividend increases, Northern Trust was expected to increase the dividend on December 8, 2008. However, the economic environment, as uncertain as it was, did not warrant such actions from the board. The most prudent action was to conserve as much cash as possible.
It is interesting to note that according to Value Line Investment Survey, Northern Trust earned $3.24 per share in 2007 and $3.47 in 2008. Although the cash was available, NTRS made a prudent and accurate decision to maintain, rather than increase the dividend since 2009 earnings came in at $3.16. Despite a drop in earnings in 2009 and the economic turmoil of 2007 to 2009, the book value of NTRS has climbed from $20.44 in 2007 to $26.50 in 2009. A decision on the dividend that was made in 2008 anticipated the decrease in earnings in 2009 is what we should expect for a “well” run organization.
The management at Northern Trust (NTRS) continues to demonstrate a high level of competency that rewards the shareholders and account holders equally. First, by not overreaching as the bubble grew, NTRS avoided jeopardizing the well being of their clients. Second, by taking appropriate actions in response to the “crisis” that swirled around them by not increasing the dividend in order to conserve cash, NTRS positioned themselves to fight another day; which ultimately benefits the shareholders.
Historically, we have been reticent to make any recommendations of companies in the financial services industry, especially banks. However, the last three recommendations of Transatlantic Holdings (TRH), Wesco Financial (WSC) and Northern Trust (NTRS) have demonstrated an exceptional ability to weather the most recent storm. These characteristics, not increasing or cutting the dividend before a crash, were demonstrated by some of the best corporations with similar dividend increasing histories before the crash of 1929. This explains why we wouldn't rule out a company that has embarked on a new dividend policy.
Thank you for a great question and for carefully reading our material.
Posted in Northern Trust, NTRS, Transatlantic Holdings, TRH, Wesco Financial, wsc
Tagged members
Sell Wesco Financial (WSC) at the Market
Almost as abruptly as it was initiated, we are forced to issue a SELL recommendation for Wesco Financial Corp. (WSC). The stock has performed beyond our expectations since the Investment Observation was issued on August 24, 2010. Naturally, the rate of change in WSC couldn’t possibly continue at the same trajectory and for this reason we must issue a sell recommendation.

Warren Buffett has offered to buy the shares that he doesn’t already own of Wesco (WSC) for close to the book value of $352 per share. As we indicated in our Investment Observation, WSC is currently priced at the equivalent level of $244.55 based on the dividend increases in relation to the book value. Buffett is literally stealing the company right under our noses. There just may not be much more upside to this stock other than what the management of Berkshire Hathaway brings to the table. This is no slight to Buffett and Co. However, it would be next to impossible to obtain the same returns in such a short period of time.
WSC was recommended when it was trading at $321.24. As of the close of Thursday August 26, 2010, WSC was quoted at $363 (or $0.35 away from our estimated Dow Theory fair value level). This equals a return of 12.99% in 3 days. Conservatively, on an annualized basis this would equal approximately 1,185% return (we apologize for putting such a ridiculous number in this section but it has been our format and no one has complained about it so far.) Selling this stock now generates a return 259 times the amount of the dividend yield if the stock was held for a whole year. We will not give the run down on how the stock performed compared to treasuries.
This is not the first time that we’ve been ensnared in a recommendation that was later pursued by Warren Buffett. On the record, our May 4, 2009 recommendation of Becton Dickson (BDX) was followed up with an August 14 SEC filings by Buffett indicating that BDX was bought on June 30, 2009. At the time that the news came out, we had issued a research recommendation and a sell recommendation with a gain of 11%.
Another transaction that got caught up in the euphoria of Mr. Buffett was our Wal-Mart analysis in the article titled “Values Biding Time” published on June 18, 2009. It was not long after that article (December 23, 2009) that it was revealed that Buffett had increased his stake in Wal-Mart. We're certain that the our selection process and the tastes of Warren Buffett are merely coincidental. However, it is nice to know that we are possibly on the right track with the timing and quality of companies that we select.
We're working on two companies from our watch list that should be added to the Investment Observation List soon. It is hoped that the next two companies that we profile will be just as profitable and equally as alluring from a value standpoint.
Investment Observation: Wesco Financial Corp. (WSC) at $321.24
Today’s Investment Observation is on Wesco Financial (WSC). According to Value Line, Wesco Financial is a diversified company engaged “…in the insurance, furniture rental, and steel service center businesses in the United States.” Charles T. Munger heads Wesco Financial (WSC) and is 80% owned by Berkshire Hathaway (BRK-A). Wesco Financial (WSC) has increased its dividend for 38 years in a row.
Our initial interest in WSC is drawn directly from Edson Gould’s Altimeter, which puts the dividend payment in relative terms compared to the stock price. This is important since the continuous increase of the dividend is never reflected in the stock charts available. As seen in the chart below, WSC is now selling at a support level that was first established (on a relative basis) on May 12, 1997.
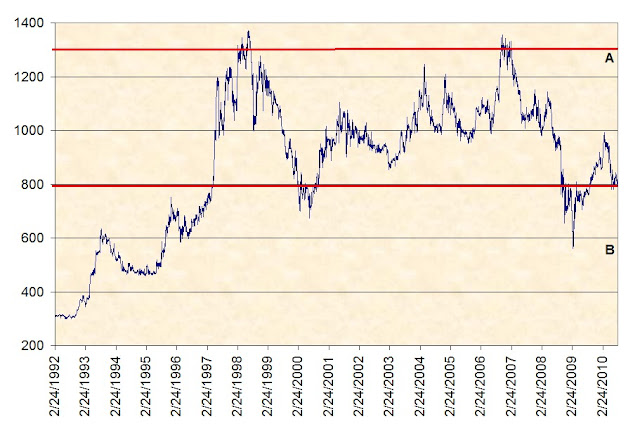
If we use the Altimeter’s peaks and troughs, we arrive at an upside target of $533 (point A). We expect that our upside target is too optimistic and therefore set our sights for the most realistic target of $410. Our downside target, based on the Altimeter, is $246 (point B) or 24% below the closing price of August 23, 2010. However, we would advise investors to build in the expectation that the stock could decline as much as 50% from the current level. The way the New Low Observer team deals with this issue is by buying 50% (of the intended amount to be invested) now and holding the remaining amount for the prospect of the decline.
Our previous experience investing in WSC was back in late 2007 to early 2008 (2008 transaction history). At the time, WSC had all the redeeming attributes that we see today. However, we sold the stock for a –4% loss just before the price jumped 13%. Although we were quick to pull the trigger on selling WSC with a –4% loss the subsequent 42% decline was worth avoiding.
Dow Theory indicates that WSC is assumed to be at fair value when the stock has reached $363.35 based on the peak from March 18, 2010 to the closing price of July 2, 2010. However, to be as conservative as possible, we would take the high of 2010 and the low of 2009 and determine a worst-case scenario of fair value and arrived at $314.22. This indicates that as long as WSC can hold above the worst-case scenario of fair value, the gains in this stock are almost assured.
There are a few other features that are of particular interest regarding WSC. According to Valueline, there has been absolutely no change in the number of shares outstanding since 2002. In addition, WSC has long-term debt that is negligible and falling since 2002 while the book value has increased by 30.26% over the same period of time. Speaking of book value, based on the dividend increases since May 1997, WSC is selling at the equivalent of $224.55, a discount of 31.25% of the current indicated book value of $352. It should be noted that the current price of WSC is the same as back in 2002.
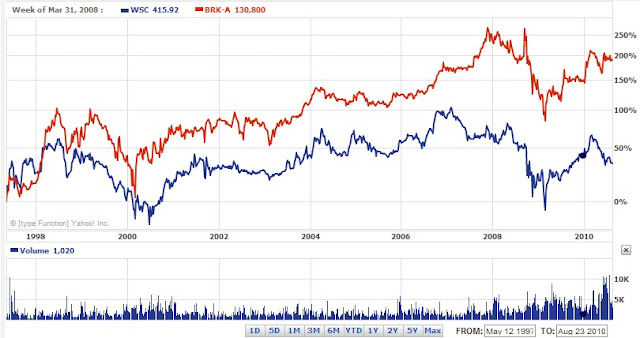
For some strange reason, we’d like to believe that WSC should mirror the performance of BRK-A even though we know this is not true. Both companies are very different not to mention the fact that BRK-A is diversified with a triple A rating. However, we couldn’t resist the temptation to include a comparison chart of WSC (blue line) and BRK-A (red line) since 1997.
In closing, we make our greatest case against WSC with the words of its CEO Charlie Munger:
“Business and human quality in place at Wesco continues to be not nearly as good, all factors considered, as that in place at Berkshire Hathaway. Wesco is not an equally-good but smaller version of Berkshire Hathaway, better because its small size makes growth easier. Instead, each dollar of book value at Wesco continues plainly to provide much less intrinsic value than a similar dollar of book value at Berkshire Hathaway. Moreover, the 7 quality disparity in book value’s intrinsic merits has, in recent years, continued to widen in favor of Berkshire Hathaway. All that said, we make no attempt to appraise relative attractiveness for investment of Wesco versus Berkshire Hathaway stock at present stock-market quotations.”Munger, Charles T. Wesco Financial Corporation, Letter to Shareholders. February 25, 2009. Page 7. http://www.wescofinancial.com/cm2008.pdf (PDF). Accessed August 23, 2010.
I’m reluctant to accept that Mr. Munger isn’t just under-promising for the sole purpose of over-performing down the road. At the time that Munger made the above statement WSC was trading at $249.24. Since February 25, 2009, WSC has climbed 30% while BRK-A has climbed 45%. I guess Munger was right. However, I’ll take the 30% increase any day of the week.
There is so much in favor of this company, from a fundamental and technical standpoint, that we recommend doing some cursory research on WSC. Despite the coming global financial collapse caused by hemorrhaging U.S. deficits, Wesco Financial will be around to match the current Dividend Achievers with continuous increases for 55 years in a row.
Posted in BRK-A, investment observation, Wesco Financial, wsc
2008 Transaction Overview
Below are all of my closed transactions for 2008 with the percentage realized gain or loss along with the percentage of the portfolio of each position. Closed positions are those that were done after the purchase of the stock took place. Therefore, purchases that took place in 2007 may have been close in 2008 while purchases in late 2008 may not have reflected a gain or loss until 2009. As an example, FDO was purchased in late December 2007 and sold late January 2008.
After transaction costs, the total return in the portfolio for 2008 was 14.35%. The dividend yield received on the account was 2.53%, with the dividend accounting for 17.62% of the total change in the account value. I am open to questions about the rational for selecting a particular stock at a given time during 2008. One thing that will be noticed about the differences between 2008 and 2009 is that 2009 has far fewer transactions.
Because this portfolio actually made money when the major indices lost close to 40% in 2008, I'm hoping to replicated this approach (mainly to avoid losing money in a market downturn.) I would appreciate any constructive insights or thoughts by you the reader. I'm hoping this will be an instructive moment for everyone involved. If you don't wish to post in the comment section then send me an email.I will be posting my transaction history for 2009 here shortly.
-Touc
|
Symbol
|
Close date
|
Total % Gain | % of Portfolio | |||
|
(FDO)
|
|
1/31/2008
|
|
10.65%
|
|
96.67%
|
|
(WSC)
|
|
2/11/2008
|
|
-3.93%
|
|
94.28%
|
|
(AIG)
|
|
2/28/2008
|
|
12.52%
|
|
82.65%
|
|
(CTAS)
|
|
3/13/2008
|
|
-3.81%
|
|
29.43%
|
|
(CDE)
|
|
3/13/2008
|
|
-12.42%
|
|
1.91%
|
|
(BSC)
|
|
3/14/2008
|
|
7.33%
|
|
26.10%
|
|
(HTX)
|
|
3/24/2008
|
|
1.73%
|
|
29.52%
|
|
(KGC)
|
|
3/24/2008
|
|
-16.73%
|
|
38.15%
|
|
(CTAS)
|
|
4/16/2008
|
|
-4.34%
|
|
31.11%
|
|
(GSS)
|
|
4/16/2008
|
|
-13.21%
|
|
1.77%
|
|
(NC)
|
|
7/23/2008
|
|
27.30%
|
|
32.11%
|
|
(MSA)
|
|
8/11/2008
|
|
19.02%
|
|
36.71%
|
|
(WIN)
|
|
8/14/2008
|
|
5.55%
|
|
27.27%
|
|
(BGG)
|
|
8/27/2008
|
|
1.27%
|
|
31.38%
|
|
(ANAT)
|
|
9/9/2008
|
|
-11.64%
|
|
28.26%
|
|
(EXPD)
|
|
9/9/2008
|
|
-5.51%
|
|
33.01%
|
|
(HPQ)
|
|
9/9/2008
|
|
115.03%
|
|
0.07%
|
|
(NSEC)
|
|
9/9/2008
|
|
-17.36%
|
|
3.08%
|
|
(TDS)
|
|
9/9/2008
|
|
-3.97%
|
|
38.10%
|
|
(NEM)
|
|
9/17/2008
|
|
3.27%
|
|
32.03%
|
|
(HL)
|
|
9/18/2008
|
|
5.70%
|
|
39.06%
|
|
(AIG)
|
|
9/23/2008
|
|
33.94%
|
|
38.27%
|
|
(ANAT)
|
|
9/29/2008
|
|
2.80%
|
|
29.25%
|
|
(ADM)
|
|
9/30/2008
|
|
-8.43%
|
|
20.77%
|
|
(WAG)
|
|
9/30/2008
|
|
-1.75%
|
|
44.09%
|
|
(TMR)
|
|
10/7/2008
|
|
-14.66%
|
|
11.36%
|
|
(NXG)
|
|
10/7/2008
|
|
-12.72%
|
|
11.40%
|
|
(AEM)
|
|
10/10/2008
|
|
-3.03%
|
|
15.58%
|
|
(FNM)
|
|
10/10/2008
|
|
-46.25%
|
|
7.14%
|
|
(GSS)
|
|
10/10/2008
|
|
-8.66%
|
|
12.11%
|
|
(JOF)
|
|
10/14/2008
|
|
2.34%
|
|
22.18%
|
|
(DOG)
|
|
10/15/2008
|
|
1.14%
|
|
43.23%
|
|
(AIG)
|
|
10/20/2008
|
|
-2.55%
|
|
66.35%
|
|
(BMI)
|
|
10/22/2008
|
|
-5.40%
|
|
35.38%
|
|
(EUM)
|
|
10/27/2008
|
|
5.26%
|
|
46.63%
|
|
(AEM)
|
|
10/28/2008
|
|
-4.08%
|
|
25.83%
|
|
(ABX)
|
|
10/28/2008
|
|
-2.92%
|
|
24.26%
|
|
(CTL)
|
|
10/31/2008
|
|
-9.93%
|
|
34.18%
|
|
(NC)
|
|
10/31/2008
|
|
-0.14%
|
|
43.42%
|
|
(NC)
|
|
11/7/2008
|
|
-12.16%
|
|
49.47%
|