Category Archives: NLO Dividend Watch List

NLO Dividend Watch List: May 27, 2011

The excitement from several IPOs couldn't push the market higher and the market remained flat for another week.  Most of the major indexes including the S&P500, Dow Jones Industrial Average, and Nasdaq 100 remained unchanged or slightly down.  Our watch list this week grew from 24 to 29 companies.  The following are stocks on our list that are within 11% of their 52-week low.

May 27, 2011 Watch List

Symbol Name Price % Yr Low P/E EPS (ttm) Dividend Yield Payout Ratio
HTLF Heartland Financial USA, Inc.  14.09 2.32% 13.17 1.07 0.40 2.84% 37%
TGT Target Corp. 49.37 2.36% 12.07 4.09 1.00 2.03% 24%
CHFC Chemical Financial Corp.  19.29 2.66% 17.54 1.10 0.80 4.15% 73%
ANAT American National Insurance 76.74 3.51% 12.98 5.91 3.08 4.01% 52%
WABC Westamerica BanCorp.  49.87 3.62% 15.68 3.18 1.44 2.89% 45%
HGIC Harleysville Group Inc.  31.56 4.12% 11.31 2.79 1.44 4.56% 52%
SJW SJW Corp. 22.8 4.20% 17.81 1.28 0.69 3.03% 54%
WEYS Weyco Group, Inc.  23.23 4.22% 20.20 1.15 0.64 2.76% 56%
HHS Harte-Hanks, Inc. 8.43 4.33% 10.67 0.79 0.32 3.80% 41%
BXS BanCorp.South Inc. 12.81 4.40% 80.06 0.16 0.04 0.31% 25%
TRH Transatlantic Holdings, Inc. 46.36 4.84% 15.15 3.06 0.84 1.81% 27%
NWN Northwest Natural Gas Co. 44.97 5.56% 17.16 2.62 1.74 3.87% 66%
SFNC Simmons First National Corp.  25.62 5.96% 11.92 2.15 0.76 2.97% 35%
NTRS Northern Trust Corp.  48.45 6.95% 17.88 2.71 1.12 2.31% 41%
GS Goldman Sachs Group, Inc.   138.66 7.07% 15.19 9.13 1.40 1.01% 15%
TMP Tompkins Financial Corp. 38.56 7.32% 12.32 3.13 1.36 3.53% 43%
SYBT S.Y. BanCorp., Inc.  24.24 7.78% 14.18 1.71 0.72 2.97% 42%
UBSI United Bankshares, Inc.  23.9 8.19% 14.40 1.66 1.20 5.02% 72%
CMA Comerica, Inc. 35.91 8.46% 19.73 1.82 0.40 1.11% 22%
BANF BancFirst Corp.  38.1 9.26% 13.51 2.82 1.00 2.62% 35%
MDP Meredith Corp. 31.6 9.27% 11.09 2.85 1.02 3.23% 36%
BMI Badger Meter, Inc. 37.14 9.30% 20.98 1.77 0.56 1.51% 32%
BOH Bank of Hawaii Corp. 46.98 9.41% 13.09 3.59 1.80 3.83% 50%
AWR American States Water Co. 34.42 10.18% 20.01 1.72 1.12 3.25% 65%
CTBI Community Trust BanCorp. 27.02 10.29% 11.65 2.32 1.22 4.52% 53%
CALM Cal-Maine Foods, Inc. 28.93 10.29% 9.27 3.12 1.88 6.50% 60%
CWT California Water Service 37.37 10.53% 20.31 1.84 1.23 3.29% 67%
MCY Mercury General Corp. 41.3 10.75% 15.18 2.72 2.40 5.81% 88%
GBCI Glacier BanCorp., Inc.  14.24 10.90% 24.14 0.59 0.52 3.65% 88%
29 Companies


Watch List Summary

On top of our list is Heartland Financial (HTLF).  This small cap, south-west regional bank, was eighth on our list two weeks back.  It's currently trading at 7% discount to its book value.  That is very low on a relative basis for a company that typically trades around 1.4x book value for the past five years.  Buying the company now would be just as cheap as buying it at the March 09' low based on the dividend yield (2.84% vs 2.95%).
Next on our list is Target (TGT).  After trading up to $52 two weeks ago, the shares traded down after the quarterly earning report.  It was announced that, as of March 31, 2011, Pershing Square (Bill Ackman) sold all of its TGT holding after shareholders rejected a board of directors nominated by the hedge-fund manager.  We believe Pershing Square's exit was the cause of the recent price declined.  We don't know how long it would take to unwind this large position.  However, we'd guess that it took three months which TGT was trading around $60.  Shares of TGT declined 16.5% since the beginning of the year.  On a relative dividend yield perspective, TGT is a great value trading at double its historical undervalue range of 1%.
Another company we'd like to highlight is American National Insurance (ANAT).  This life insurance and annuity provider is trading at a deep discount.  The current price-to-book is at 0.55 which is far from the 5-year average of 0.8.  To compensate patient investors, ANAT pays 4% in dividends which is higher than the usual 3% over the past 5 years.  Current headline risk remains as natural disasters continue to spread.  We don't know how much natural disasters are going to affect ANAT.  However, we believe it might be a good risk/reward proposition at this level.
Top Five Performance Review
In our ongoing review of the NLO Dividend Watch List, we have taken the top five stocks on our list from May 28, 2010 and have checked their performance one year later. The top five companies on that list can be seen in the table below.

Symbol Name 2010 Price 2011 Price % change
VIVO Meridian Bioscience 17.48 23.3 33.30%
FII Federated Investors 22.21 25.33 14.05%
LLY Eli Lilly & Co. 32.79 37.85 15.43%
XOM Exxon Mobil Corp.   60.46 82.63 36.67%
ADM Archer Daniels Midland 25.27 32.21 27.46%


Average 25.38%


DJI Dow Jones Industrial 10,136.63 12,441.58 22.74%
SPX S&P 500 1,089.41 1,331.10 22.18%

Our top five blew past the market by a good margin.  In addition to capital appreciation, most of these stocks pay great dividends.  Archer Daniels Midland (ADM), at the time, paid the smallest dividend yield of the group with yield of 2.37%.  While not great, that was considered undervalued according to ADM's historical relative dividend yield of 2%.  The best performer was Exxon Mobile (XOM), the largest oil and gas producer.  While many people would think it's impossible for a giant such as XOM to move substantially higher, this data proves otherwise. The runner up is one of our favorite stocks, Meridian Bioscience (VIVO).  This medical equipment supplier and a long time dividend achiever has no debt and carries a market cap of $955M.  When it appeared at the low, many people were skeptical of its ability to grow.  One year later, that concern is now behind the company and those who were skeptical missed the opportunity to buy VIVO at the low (within 1.1% of the 52wk low at the time) while sporting a 4.35% yield.

Disclaimer:

On our current list, we excluded companies that have no earnings. Stocks that appear on our watch lists are not recommendations to buy. Instead, they are the starting point for doing your research and determining the best company to buy. Ideally, a stock that is purchased from this list is done after a considerable decline in the price and extensive due diligence. We suggest that readers use the March 2009 low (or the companies' most distressed level in the last 2 years) as the downside projection for investing. Our view is to embrace the worse case scenario prior to investing. A minimum of 50% decline or the November 2008 to March 2009 low, whichever is lower, would fit that description. It is important to place these companies on your own watch list so that when the opportunity arises, you can purchase them with a greater margin of safety. It is our expectation that, at the most, only 1/3 of the companies that are part of our list will outperform the market over a one-year period.

Please consider donating to the New Low Observer. Thank you.

NLO Dividend Watch List: May 13, 2011

The market continues to struggle to move higher.  Most major indexes are virtually flat for the week.  Our watch list this week contains 24 companies that are within 11% of their 52-week low.  The following is our list for Friday the 13th.

May 13, 2011 Watch List

Symbol Name Price % Yr Low P/E EPS (ttm) Dividend Yield Payout Ratio
SJW SJW Corp. 22.44 0.85% 17.53 1.28 0.69 3.07% 54%
WEYS Weyco Group, Inc.  22.98 3.10% 19.98 1.15 0.64 2.79% 56%
WABC Westamerica BanCorp.  49.64 3.14% 15.61 3.18 1.44 2.90% 45%
HHS Harte-Hanks, Inc. 8.75 3.92% 11.08 0.79 0.32 3.66% 41%
CHFC Chemical Financial Corp.  19.67 4.68% 17.88 1.10 0.80 4.07% 73%
HGIC Harleysville Group Inc.  31.93 5.34% 11.44 2.79 1.44 4.51% 52%
BXS BanCorp.South Inc. 12.93 5.38% 80.81 0.16 0.04 0.31% 25%
HTLF Heartland Financial USA, Inc.  14.6 6.03% 13.64 1.07 0.40 2.74% 37%
SFNC Simmons First National Corp.  25.68 6.20% 11.94 2.15 0.76 2.96% 35%
BMI Badger Meter, Inc. 36.14 6.36% 20.42 1.77 0.56 1.55% 32%
NTRS Northern Trust Corp.  48.24 6.49% 17.80 2.71 1.12 2.32% 41%
TGT Target Corp. 51.52 6.82% 12.88 4.00 1.00 1.94% 25%
CALM Cal-Maine Foods, Inc. 28.04 6.90% 8.99 3.12 1.88 6.70% 60%
AWR American States Water Co. 33.52 7.30% 18.94 1.77 1.12 3.34% 63%
SYBT S.Y. BanCorp., Inc.  24.05 7.90% 14.06 1.71 0.72 2.99% 42%
TRH Transatlantic Holdings, Inc. 47.75 8.33% 15.60 3.06 0.84 1.76% 27%
CWT California Water Service 36.81 8.87% 20.34 1.81 1.23 3.34% 68%
WFSL Washington Federal, Inc.  15.27 9.31% 21.81 0.70 0.24 1.57% 34%
NWN Northwest Natural Gas Co. 45.87 9.47% 16.80 2.73 1.74 3.79% 64%
SHEN Shenandoah Telecom 16.98 9.55% 22.34 0.76 0.33 1.94% 43%
MCY Mercury General Corp. 40.87 9.60% 15.03 2.72 2.40 5.87% 88%
CMA Comerica, Inc. 36.39 9.91% 19.99 1.82 0.40 1.10% 22%
CTBI Community Trust BanCorp. 26.95 9.98% 11.62 2.32 1.22 4.53% 53%
TMP Tompkins Financial Corp. 39.72 10.55% 12.69 3.13 1.36 3.42% 43%
24 Companies


Watch List Summary

SJW Corp. or San Jose Water (SJW) remain at the top of our list but the price fell just slightly compared to our last posting. Again, the previous time this company appeared on our dividend watch list back on December 18, 2009. At that time, SJW was trading at $21.93 and had a P/E ratio of 24.42. SJW is now trading with a P/E ratio of 17.7 and a dividend yield of 3.05% despite having a higher absolute price. These numbers reflect that the company is able to consistently grow their earnings while increasing their dividends. After being on our list in December 2009, SJW rose above $27 and has steadily maintained a rising trend above $24 until recently.

Going down the list, we'd like to highlight Simmons First National (SFNC).  Our view of the company remains unchanged.  It is a play on farmland boom we expect to see down the road.  Read more on SFNC in our Investment Observation.

Target (TGT) is another name that the New Low team is focusing on.  With gas price above $4 for the most of the country,  the retail sector may not be the place to be.  But with Target's ability to bring their private label brand, Up & Up, with a variety of products, we think this is an overlooked area.  In addition, the credit card division within Target could possibly be a hidden value.  The 2% yield is at a historical high for the company and we think this is a good risk-reward opportunity.

This week we say goodbye to Sysco Foods (SYY) from our watch list.  It had been on our watch list since the beginning of the year and we've pounded the table several times about this stock.  Despite the negativity about pricing, the latest earnings report displayed the company's ability to manage the challenging environment.  For more on Sysco, click here.

Top Five Performance Review

In our ongoing review of the NLO Dividend Watch List, we have taken the top five stocks on our list from May 14, 2010 and have checked their performance one year later. The top five companies on that list can be seen in the table below.
Symbol Name 2010 Price 2011 Price % change
MON Monsanto Co. 54.61 63.79 16.81%
LLY Eli Lilly & Co. 33.92 38.95 14.83%
FRS Frisch's Restaurants, Inc 21.01 21.85 4.00%
FII Federated Investors Inc 23.16 26.14 12.87%
HSC Harsco Corp. 27.56 33.65 22.10%


Average 14.12%


DJI Dow Jones Industrial 10,620.16 12,595.75 18.60%
SPX S&P 500 1,135.68 1,337.77 17.79%
 

There are some interesting things to take from this chart.  First, noticed the ability for Harso (HSC) to rally from -30% to almost up 30%.  This company is in the steel / basic material sector and as we know, the sector has done quite well.  Monsanto (MON) may have tagged along for the ride.  Although there was heavy criticism of MON's key product, Roundup, that didn't stop the stock from rising above 30%.  With basic material costs rising, it's no wonder that Frisch's Restaurant (FRS) suffered.  A 15% hike in dividend back in September didn't do much either.  Typically, this stock is consider undervalued at 3% yield.  Our May watch list had FRS yielding 2.5%.

Disclaimer:
On our current list, we excluded companies that have no earnings. Stocks that appear on our watch lists are not recommendations to buy. Instead, they are the starting point for doing your research and determining the best company to buy. Ideally, a stock that is purchased from this list is done after a considerable decline in the price and extensive due diligence. We suggest that readers use the March 2009 low (or the companies' most distressed level in the last 2 years) as the downside projection for investing. Our view is to embrace the worse case scenario prior to investing. A minimum of 50% decline or the November 2008 to March 2009 low, whichever is lower, would fit that description. It is important to place these companies on your own watch list so that when the opportunity arises, you can purchase them with a greater margin of safety. It is our expectation that, at the most, only 1/3 of the companies that are part of our list will outperform the market over a one-year period.

Please revisit New Low Observer for edits and revisions to this post. Email us.

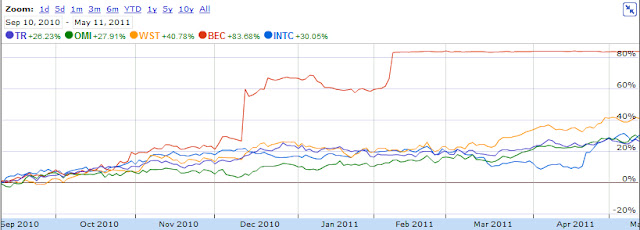
Top 5 on Watch List May Be Worth Selling

The September 10th Watch List has performed exceptionally and may require your attention if you bought any of the top 5. 

The worst performing of the top 5 in the last 8 months has been Tootsie Roll (TR) with 26.23%. Beckman Coulter (BEC) exceeded even our most conservatives estimates (article here).  Our recent assessment of West Pharmaceutical Services (WST) suggests that selling and seeking the next best alternative might be in order. 

Considering that this is a list of dividend stocks, I would say that our job is done here.

Please revisit New Low Observer for edits and revisions to this post. Email us.

NLO Dividend Watch List

The market turned down this week which was possibly commodities driven.  As we've demonstrated statistically in our 2008 commentary on gold, and every since, that when the Dow declines by more than 10%, gold and gold stocks fall by a greater magnitude.  We're not there yet, however the precious metals and the Dow are tracking each other very closely.  The S&P fell roughly 1.7% while the Dow dropped slightly less at 1.3%.  The beginning of May is looking like the old saying, "sell in May and go away."
Our watch list this week contains 25 companies that are within 11% of their 52-week low.
May 6, 2011 Watch List
Symbol Name Price % Yr Low P/E EPS (ttm) Dividend Yield Payout Ratio
SJW SJW Corp. 22.53 1.26% 17.33 1.30 0.69 3.06% 53%
WABC Westamerica BanCorp.  49.6 3.05% 15.60 3.18 1.44 2.90% 45%
CHFC Chemical Financial Corp.  19.47 3.62% 17.70 1.10 0.80 4.11% 73%
WEYS Weyco Group, Inc.  23.1 3.63% 19.41 1.19 0.64 2.77% 54%
TGT Target Corp. 50.51 4.73% 12.63 4.00 1.00 1.98% 25%
SYY Sysco Corp. 28.51 5.09% 14.70 1.94 1.04 3.65% 54%
HGIC Harleysville Group Inc.  31.87 5.15% 13.17 2.42 1.44 4.52% 60%
HHS Harte-Hanks, Inc. 8.89 5.58% 11.25 0.79 0.32 3.60% 41%
HTLF Heartland Financial USA, Inc.  14.57 5.81% 13.62 1.07 0.40 2.75% 37%
CALM Cal-Maine Foods, Inc. 27.76 5.83% 8.90 3.12 1.88 6.77% 60%
NWN Northwest Natural Gas Co. 44.61 6.47% 16.34 2.73 1.74 3.90% 64%
SHEN Shenandoah Telecom 16.52 6.58% 21.74 0.76 0.33 2.00% 43%
NTRS Northern Trust Corp.  48.43 6.91% 17.87 2.71 1.12 2.31% 41%
SFNC Simmons First National Corp.  25.89 7.07% 12.04 2.15 0.76 2.94% 35%
BXS BanCorp.South Inc. 13.17 7.33% 82.31 0.16 0.04 0.30% 25%
BMI Badger Meter, Inc. 36.59 7.68% 20.67 1.77 0.56 1.53% 32%
AWR American States Water Co. 33.65 7.71% 19.01 1.77 1.12 3.33% 63%
SYBT S.Y. BanCorp., Inc.  24.01 7.72% 14.04 1.71 0.72 3.00% 42%
CWT California Water Service 36.49 7.93% 20.16 1.81 1.23 3.37% 68%
MCY Mercury General Corp. 40.78 9.36% 14.67 2.78 2.40 5.89% 86%
TRH Transatlantic Holdings, Inc. 48.35 9.69% 15.80 3.06 0.84 1.74% 27%
WFSL Washington Federal, Inc.  15.42 10.38% 22.03 0.70 0.24 1.56% 34%
AROW Arrow Financial Corp.  23.53 10.51% 12.13 1.94 1.00 4.25% 52%
CTBI Community Trust BanCorp. 27.08 10.53% 11.67 2.32 1.22 4.51% 53%
TMP Tompkins Financial Corp. 39.75 10.63% 12.70 3.13 1.36 3.42% 43%
25 Companies


Watch List Summary
SJW Corp. or San Jose Water (SJW) last appeared on our dividend watch list back on December 18, 2009. At that time, SJW was trading at $21.93 and had a P/E ratio of 24.42.  SJW is now trading with a P/E ratio of 17.7 and a dividend yield of 3.05% despite reflecting a higher absolute price. These numbers reflect that the company is able to consistently grow their earnings while increasing their dividends. After being on our list in December 2009, SJW rose above $27 and has steadily maintained a rising trend above $24 until recently.
Sysco Foods (SYY) was last on our dividend watch list July 2009. At the time of our 2009 watch list, SYY was trading at $21.51 with a P/E ratio of 12 and a dividend yield of 4.40%.  Currently, Sysco (SYY) is trading at $28.45 and has a P/E ratio of 14. The annual dividend has increased by 8% since July 2009. Concerns about Sysco not being able to pass on the increase commodity prices is finally percolating down to the consumer as reflected in the recent Bloomberg article “Restaurants Lift Prices as Inflation Hawks See Fed Behind Curve.”
New addition to this list is Cal-Maine Foods (CALM), a major egg producers.  We decided to track CALM after evaluating its dividend policy that was established in 2007.  Under CALM's guidelines, the company will payout one-third (1/3) of quarterly income. Essentially, this mean they have tied their distribution to the profitability of the company.  As such, the 6.7% dividend yield may not hold.  We believe that this is a very prudent way to manage dividend payouts. The result is extraordinary and can be seen here. Shares of CALM have gained 16% since the implementation of this dividend policy.
Top Five Performance Review
In our ongoing review of the NLO Dividend Watch List, we have taken the top five stocks on our list from May 7, 2010 and have checked their performance one year later. The top five companies on that list can be seen in the table below.
Symbol Name 2010 Price 2011 Price % change
MON Monsanto Co. 59.09 65.27 10.46%
HSC Harsco Corp. 26.38 34.29 29.98%
FRS Frisch's Restaurants, Inc 20.77 23.1 11.22%
SHEN Shenandoah Telecom 16.95 16.52 -2.54%
VIVO Meridian Bioscience Inc.  18.29 23.66 29.36%


Average 15.70%


DJI Dow Jones Industrial 10,380.43 12,638.74 21.76%
SPX S&P 500 1,110.88 1,340.20 20.64%
Chart
The average performance of our top five stocks underperformed the market. Shenandoah (SHEN) underperformed the market and its peer over one year but shares bumped the 10% gain several times through out the year.  Any investor looking into this stock should be aware that they pay dividend once a year during November. Please note that these figure exclude dividends and are based purely on price appreciation.
Disclaimer:
On our current list, we excluded companies that have no earnings. Stocks that appear on our watch lists are not recommendations to buy. Instead, they are the starting point for doing your research and determining the best company to buy. Ideally, a stock that is purchased from this list is done after a considerable decline in the price and extensive due diligence. We suggest that readers use the March 2009 low (or the companies' most distressed level in the last 2 years) as the downside projection for investing. Our view is to embrace the worse case scenario prior to investing. A minimum of 50% decline or the November 2008 to March 2009 low, whichever is lower, would fit that description. It is important to place these companies on your own watch list so that when the opportunity arises, you can purchase them with a greater margin of safety. It is our expectation that, at the most, only 1/3 of the companies that are part of our list will outperform the market over a one-year period.

Please revisit New Low Observer for edits and revisions to this post. Email us.

NLO Dividend Watch List

The market recovered this week and gained 1.3%. The Dow broke above its previous high of 12,426 but the Transports are about 88 points (1.6%) away from the high. Next week UPS (UPS) earnings could guide us with the direction of the transports.

Our watch list this week contains 23 companies that are within 11% of their 52-week low.

April 22, 2011 Watch List

Symbol Name Price % Yr Low P/E EPS (ttm) Dividend Yield Payout Ratio
WABC Westamerica BanCorp.  48.73 1.25% 15.18 3.21 1.44 2.96% 45%
HCBK Hudson City Bancorp, Inc. 9.46 1.94% 8.68 1.09 0.60 6.34% 55%
MCY Mercury General Corp. 38.47 3.16% 13.84 2.78 2.40 6.24% 86%
SJW SJW Corp. 22.96 3.19% 17.66 1.30 0.69 3.01% 53%
TGT Target Corp. 49.9 3.46% 12.48 4.00 1.00 2.00% 25%
HGIC Harleysville Group Inc.  31.82 4.98% 13.15 2.42 1.44 4.53% 60%
SFNC Simmons First National Corp.  25.66 6.12% 11.93 2.15 0.76 2.96% 35%
SYY Sysco Corp. 29 6.89% 14.95 1.94 1.04 3.59% 54%
BMI Badger Meter, Inc. 36.33 6.92% 20.53 1.77 0.56 1.54% 32%
CHFC Chemical Financial Corp.  20.11 7.05% 22.85 0.88 0.80 3.98% 91%
WEYS Weyco Group, Inc.  24.02 7.76% 20.18 1.19 0.64 2.66% 54%
NWN Northwest Natural Gas Co. 45.24 7.97% 16.57 2.73 1.74 3.85% 64%
TRH Transatlantic Holdings, Inc. 47.69 8.19% 7.70 6.19 0.84 1.76% 14%
SYBT S.Y. BanCorp., Inc.  24.2 8.57% 14.49 1.67 0.72 2.98% 43%
CWT California Water Service 36.73 8.64% 20.29 1.81 1.23 3.35% 68%
NTRS Northern Trust Corp.  49.38 9.01% 18.02 2.74 1.12 2.27% 41%
VLY Valley National BanCorp.  13.47 9.25% 16.63 0.81 0.72 5.35% 89%
HTLF Heartland Financial USA, Inc.  15.1 9.66% 13.36 1.13 0.40 2.65% 35%
CMA Comerica, Inc. 36.31 9.66% 41.26 0.88 0.40 1.10% 45%
AWR American States Water Co. 34.39 10.08% 19.43 1.77 1.04 3.02% 59%
CL Colgate-Palmolive Co. 80.65 10.30% 18.71 4.31 2.32 2.88% 54%
KMB Kimberly-Clark Corp. 66.05 10.88% 14.84 4.45 2.80 4.24% 63%
MRK Merck & Co., Inc 34.04 10.88% 121.57 0.28 1.52 4.47% 543%
23 Companies


Watch List Summary

On the top of our list this week is Westamerica BanCorp (WABC).  According to IQTrends (www.iqtrends.com), this stock is undervalued at 3.5% dividend yield. While the yield of 2.96% doesn't quite get us there, the price-to-book-value of 2.59 is rather interesting because this stock typically trade over 3x book value. See this chart for more details. In addition to that, dividends have been steady throughout this crisis and recovery (see chart).  The payout ratio of 45% implies that earnings can fall 50% and they would still be able to cover the dividend. With next year earnings estimate to be at $3.34 compared to $3.21, we can assume that a dividend cut is unlikely.

Another interesting name is Mercury General (MCY) which trades at a little above 1x book. This is far below the historical average (see chart).  IQTrends estimated that anytime this stock dividend yield reaches 4.5%, it becomes undervalued. The current yield of 6.24% provides almost 40% upside just to get back to undervalued range. This stock would have to rise 150% for it to reach the overvalued range.  The payout ratio of 86% is something to be concerned about.  However, 2009 saw the ratio exceed 100% and yet the company continued to keep the dividend moving along.

Top Five Performance Review

In our ongoing review of the NLO Dividend Watch List, we have taken the top five stocks on our list from April 23, 2010 and have checked their performance one year later. The top five companies on that list can be seen in the table below.
Symbol Name 2010 Price 2011 Price % change
MON Monsanto Co. 65.66 67.52 2.83%
XOM Exxon Mobil Corp.   69.24 86.36 24.73%
LLY Eli Lilly & Co. 35.46 36.26 2.26%
SHEN Shenandoah Telecom 18.00 17.78 -1.22%
T AT&T Inc 26.25 30.68 16.88%


Average 9.09%


DJI Dow Jones Industrial 11,204.28 12,505.99 11.62%
SPX S&P 500 1,217.28 1,337.38 9.87%

The average performance of our top five stocks almost matched the market's performance. Shenandoah (SHEN) underperformed the market and its peer, AT&T (T). This company pays a dividend once a year during November. Any investor looking into this stock should be aware of this. Please note that these figure exclude dividends and are based purely on price appreciation.

Disclaimer:

On our current list, we excluded companies that have no earnings. Stocks that appear on our watch lists are not recommendations to buy. Instead, they are the starting point for doing your research and determining the best company to buy. Ideally, a stock that is purchased from this list is done after a considerable decline in the price and extensive due diligence. We suggest that readers use the March 2009 low (or the companies' most distressed level in the last 2 years) as the downside projection for investing. Our view is to embrace the worse case scenario prior to investing. A minimum of 50% decline or the November 2008 to March 2009 low, whichever is lower, would fit that description. It is important to place these companies on your own watch list so that when the opportunity arises, you can purchase them with a greater margin of safety. It is our expectation that, at the most, only 1/3 of the companies that are part of our list will outperform the market over a one-year period.


Please revisit New Low Observer for edits and revisions to this post. Email us.

NLO Dividend Watch List

The market was relatively flat this week. We are (cautiously) bullish going into next week after the Dow Theory re-confirmation of the cyclical bull market. Read more on that here.
Our watch list this week contains 20 companies that are within 11% of their 52-week low.

April 8, 2011 Watch List

Symbol Name Price % Yr Low P/E EPS (ttm) Dividend Yield Payout Ratio
TGT Target Corp. 49.53 2.70% 12.38 4.00 1.00 2.02% 25%
SJW SJW Corp. 22.94 3.10% 17.65 1.30 0.69 3.01% 53%
SYY Sysco Corp. 28.07 3.46% 14.47 1.94 1.04 3.71% 54%
HCBK Hudson City Bancorp, Inc. 9.87 3.79% 9.06 1.09 0.60 6.08% 55%
WABC Westamerica BanCorp.  50.73 4.17% 15.80 3.21 1.44 2.84% 45%
BMI Badger Meter, Inc. 37.98 4.23% 19.88 1.91 0.56 1.47% 29%
JNJ Johnson & Johnson   59.46 4.57% 12.44 4.78 2.16 3.63% 45%
MCY Mercury General Corp. 39.44 5.77% 14.19 2.78 2.40 6.09% 86%
WEYS Weyco Group, Inc.  24.02 7.76% 20.18 1.19 0.64 2.66% 54%
CHFC Chemical Financial Corp.  20.27 7.88% 23.03 0.88 0.80 3.95% 91%
HGIC Harleysville Group Inc.  32.70 7.89% 13.51 2.42 1.44 4.40% 60%
NWN Northwest Natural Gas Co. 45.44 8.45% 16.64 2.73 1.74 3.83% 64%
PPL PP&L Corporation 25.87 8.93% 11.98 2.16 1.40 5.41% 65%
PEP PepsiCo Inc. 65.73 8.97% 16.77 3.92 1.92 2.92% 49%
MRK Merck & Co., Inc 33.67 9.67% 120.25 0.28 1.52 4.51% 543%
KMB Kimberly-Clark Corp. 65.43 9.84% 14.70 4.45 2.80 4.28% 63%
WMT Wal-Mart Stores, Inc. 52.54 9.99% 11.78 4.46 1.46 2.78% 33%
BOH Bank of Hawaii Corp. 47.28 10.11% 12.44 3.80 1.80 3.81% 47%
CWT California Water Service 37.30 10.32% 20.61 1.81 1.23 3.30% 68%
SFNC Simmons First National Corp.  26.75 10.63% 12.44 2.15 0.76 2.84% 35%
20 Companies


Watch List Summary

On the top of our list this week is Target (TGT).  Again, according IQTrend this stock offers tremendous upside potential gauging by the relative dividend yield. Historically, shares are undervalue at 1% yield. With the stock trading at 2% yield, it has the potential to double, all else being equal.
If you are concern about inflation and looking for an investment as a derivative of that thesis, take a look at Sysco (SYY). Not much has changed since we wrote about it in 2008 (article here). Quick highlight is that SYY is an inflation hedge. Short-term, their ability to pass on costs to customer is limited but eventually those cost get passed on.
Notable to this list is the financial sector. There are about 5 companies, that's a quarter of this list. Including insurance companies and you get 7. Something to explore as a sign of a low in the industry.
Another sector is utilities. There are 4 companies on this list.
No longer on our list is Abbott Lab (ABT). Which rose 2.25% this week and closed above $50. The last time Abbott traded above that level was November 2010.

Top Five Performance Review

In our ongoing review of the NLO Dividend Watch List, we have taken the top five stocks on our list from April 9, 2010 and have checked their performance one year later. The top five companies on that list can be seen in the table below.

Symbol Name 2010 Price 2011 Price % change
MON Monsanto Co. 68.85 66.22 -3.82%
DNB Dun & Bradstreet Corp. 74.49 80.73 8.38%
XOM Exxon Mobil Corp.   68.76 85.95 25.00%
TMP Tompkins Financial Corp. 37.55 41.31 10.01%
FPL FPL Group, Inc. 49.71 56.00 12.65%


Average 10.44%


DJI Dow Jones Industrial 10,997.35 12,380.05 12.57%
SPX S&P 500 1,194.37 1,328.17 11.20%

The average performance of our top five stocks almost matched the market's performance. Please note that these figure exclude dividends and are based purely on price appreciation. Monsanto (MON) weighted down our watch list after reporting their quarterly earning on Wednesday.

Disclaimer:
On our current list, we excluded companies that have no earnings. Stocks that appear on our watch lists are not recommendations to buy. Instead, they are the starting point for doing your research and determining the best company to buy. Ideally, a stock that is purchased from this list is done after a considerable decline in the price and extensive due diligence. We suggest that readers use the March 2009 low (or the companies' most distressed level in the last 2 years) as the downside projection for investing. Our view is to embrace the worse case scenario prior to investing. A minimum of 50% decline or the November 2008 to March 2009 low, whichever is lower, would fit that description. It is important to place these companies on your own watch list so that when the opportunity arises, you can purchase them with a greater margin of safety. It is our expectation that, at the most, only 1/3 of the companies that are part of our list will outperform the market over a one-year period.

Please revisit New Low Observer for edits and revisions to this post. Email us.

NLO Dividend Watch List

The market rallied strong and finish the week on a positive note. We can't help but feel bullish going into next week after the S&P 500 worked its way passed the 1,304.28 mark prior to March 11 (when the earthquake struck Japan). We will have to wait and see if the market can continue its upward momentum and give us another Dow Theory re-confirmation of the cyclical bull market within a secular bear market.

March 25, 2011 Watch List

Our watch list this week contains 28 companies that are within 11% of their 52-week low.

Symbol Name Price % Yr Low P/E EPS (ttm) Dividend Yield Payout Ratio
SJW SJW Corp. 22.65 1.80% 17.42 1.30 0.69 3.05% 53%
SYY Sysco Corp. 27.86 2.69% 14.36 1.94 1.04 3.73% 54%
WABC Westamerica BanCorp.  50.13 2.94% 15.62 3.21 1.44 2.87% 45%
PPL PP&L Corporation 24.57 3.45% 11.38 2.16 1.40 5.70% 65%
TGT Target Corp. 49.95 3.57% 12.49 4.00 1.00 2.00% 25%
JNJ Johnson & Johnson   58.98 3.73% 12.34 4.78 2.16 3.66% 45%
HCBK Hudson City Bancorp, Inc. 9.87 3.79% 9.06 1.09 0.60 6.08% 55%
MCY Mercury General Corp. 38.83 4.13% 13.97 2.78 2.40 6.18% 86%
CHFC Chemical Financial Corp.  19.62 4.42% 22.30 0.88 0.80 4.08% 91%
PEP PepsiCo Inc. 63.98 6.07% 16.32 3.92 1.92 3.00% 49%
MRK Merck & Co., Inc 32.57 6.09% 116.32 0.28 1.52 4.67% 543%
CWT California Water Service 36.1 6.77% 19.94 1.81 1.23 3.41% 68%
HGIC Harleysville Group Inc.  32.37 6.80% 13.38 2.42 1.44 4.45% 60%
TRH Transatlantic Holdings, Inc. 47.41 7.55% 7.66 6.19 0.84 1.77% 14%
LLY Eli Lilly & Co. 34.48 7.68% 7.53 4.58 1.96 5.68% 43%
ABT Abbott Laboratories 48.03 7.71% 16.23 2.96 1.92 4.00% 65%
BMI Badger Meter, Inc. 39.65 8.81% 20.76 1.91 0.56 1.41% 29%
PRK Park National Corp. 64.37 8.92% 14.27 4.51 3.76 5.84% 83%
KMB Kimberly-Clark Corp. 65.1 9.28% 14.63 4.45 2.80 4.30% 63%
AWR American States Water Co. 34.16 9.35% 19.30 1.77 1.04 3.04% 59%
WMT Wal-Mart Stores, Inc. 52.35 9.59% 11.74 4.46 1.46 2.79% 33%
CL Colgate-Palmolive Co. 80.15 9.61% 18.60 4.31 2.32 2.89% 54%
AVP Avon Products, Inc. 27.43 9.72% 19.73 1.39 0.92 3.35% 66%
VLY Valley National BanCorp.  13.55 9.89% 16.73 0.81 0.72 5.31% 89%
NWN Northwest Natural Gas Co. 46.07 9.95% 16.88 2.73 1.74 3.78% 64%
BOH Bank of Hawaii Corp. 47.25 10.04% 12.43 3.80 1.80 3.81% 47%
WEYS Weyco Group, Inc.  24.59 10.32% 21.38 1.15 0.64 2.60% 56%
RLI RLI Corp. 56.39 10.87% 9.40 6.00 1.16 2.06% 19%
28 Companies


Watch List Summary

On the top of our list this week is San Jose, CA-based water utility SJW Corp. (SJW). The stock has been under pressure this week. The current yield of 6% is attractive but with nearly $30B of debt and only $650M of cash on hand, it may not be worth the risk/reward.
Target (TGT) is another name with tremendous upside potential gauging by the relative dividend yield establish by IQTrend. Historically, shares are undervalue at 1% yield. With the stock trading nearly 2%, it has the potential to double, all else being equal.
Another name we'd like to highlight is Abbott Lab (ABT). We go back to our 2009 analysis of the company and find some interesting qualitative changes. The stock was trading at 3.4% yield and roughly $47. Today, with a price of $48, ABT would yield 4%. We see that the stock offers more value at $48 than at $47.

Top Five Performance Review

In our ongoing review of the NLO Dividend Watch List, we have taken the top five stocks on our list from March 26, 2010 and have checked their performance one year later. The top five companies on that list can be seen in the table below.
Symbol Name 2010 Price 2011 Price % change
XOM Exxon Mobil Corp.   66.54 83.62 25.67%
FPL* FPL Group, Inc. 47.81 54.10 13.16%
MON Monsanto Co. 71.10 70.76 -0.48%
TMP Tompkins Financial Corp. 37.75 41.34 9.51%
BRO Brown & Brown, Inc. 17.81 25.09 40.88%


Average 17.75%


DJI Dow Jones Industrial 10,850.36 12,220.59 12.63%
SPX S&P 500 1,166.59 1,313.80 12.62%

*FPL is now NEE

The performance of our top five stocks topped the overall market by 5%. Thanks to two key performer, Exxon (XOM) and Brown & Brown (BRO).

Disclaimer

On our current list, we excluded companies that have no earnings. Stocks that appear on our watch lists are not recommendations to buy. Instead, they are the starting point for doing your research and determining the best company to buy. Ideally, a stock that is purchased from this list is done after a considerable decline in the price and extensive due diligence. We suggest that readers use the March 2009 low (or the companies' most distressed level in the last 2 years) as the downside projection for investing. Our view is to embrace the worse case scenario prior to investing. A minimum of 50% decline or the November 2008 to March 2009 low, whichever is lower, would fit that description. It is important to place these companies on your own watch list so that when the opportunity arises, you can purchase them with a greater margin of safety. It is our expectation that, at the most, only 1/3 of the companies that are part of our list will outperform the market over a one-year period.

Please revisit New Low Observer for edits and revisions to this post. Email us.

NLO Dividend Watch List

Theodore Roosevelt said "Do what you can, with what you have, where you are". Here are ways you can help those who are affected by the Earthquake in Japan.

Our watch list this week contains 31 companies that are within 11% of their 52-week low.
March 11, 2011 Watch List

Symbol Name Price % Yr Low P/E EPS (ttm) Dividend Yield Payout Ratio
HCBK Hudson City Bancorp, Inc. 9.92 1.54% 9.10 1.09 0.60 6.05% 55%
SYY Sysco Corp. 27.83 2.58% 14.35 1.94 1.04 3.74% 54%
SHEN Shenandoah Telecom 16.01 2.89% 17.59 0.91 0.33 2.06% 36%
BMI Badger Meter, Inc. 37.68 3.04% 19.73 1.91 0.56 1.49% 29%
WABC Westamerica BanCorp.  50.25 3.18% 15.65 3.21 1.44 2.87% 45%
FCBC First Community Bancshares 12.26 3.20% 9.97 1.23 0.40 3.26% 33%
MCY Mercury General Corp. 39.31 3.72% 14.14 2.78 2.40 6.11% 86%
CWT California Water Service 35.17 4.02% 19.43 1.81 1.23 3.50% 68%
WEYS Weyco Group, Inc.  23.21 4.13% 20.18 1.15 0.64 2.76% 56%
SJW SJW Corp. 23.34 4.90% 17.95 1.30 0.69 2.96% 53%
CHFC Chemical Financial Corp.  19.72 4.95% 22.41 0.88 0.80 4.06% 91%
JNJ Johnson & Johnson   59.69 4.98% 12.49 4.78 2.16 3.62% 45%
AWR American States Water Co. 32.93 5.41% 22.40 1.47 1.04 3.16% 71%
ATNI Atlantic Tele-Network, Inc. 32.09 5.49% 12.30 2.61 0.88 2.74% 34%
PPL PP&L Corporation 25.26 6.36% 11.69 2.16 1.40 5.54% 65%
TGT Target Corp. 51.53 6.84% 12.88 4.00 1.00 1.94% 25%
PEP PepsiCo Inc. 64.65 7.18% 16.49 3.92 1.92 2.97% 49%
HGIC Harleysville Group Inc.  32.58 7.49% 13.46 2.42 1.44 4.42% 60%
RBCAA Republic BanCorp., Inc.  18.10 7.67% 5.86 3.09 0.57 3.15% 18%
SYBT S.Y. BanCorp., Inc.  23.93 7.99% 14.33 1.67 0.72 3.01% 43%
CL Colgate-Palmolive Co. 79.18 8.29% 18.37 4.31 2.32 2.93% 54%
AVP Avon Products, Inc. 27.16 8.64% 19.54 1.39 0.92 3.39% 66%
ABT Abbott Laboratories 48.46 8.68% 16.37 2.96 1.92 3.96% 65%
LLY Eli Lilly & Co. 34.86 8.87% 7.61 4.58 1.96 5.62% 43%
RLI RLI Corp. 55.47 9.06% 9.25 6.00 1.16 2.09% 19%
KMB Kimberly-Clark Corp. 64.65 9.15% 14.53 4.45 2.80 4.33% 63%
TRH Transatlantic Holdings, Inc. 48.28 9.53% 7.80 6.19 0.84 1.74% 14%
WMT Wal-Mart Stores, Inc. 52.59 10.09% 11.79 4.46 1.46 2.78% 33%
VLY Valley National BanCorp.  13.59 10.22% 16.78 0.81 0.72 5.30% 89%
BOH Bank of Hawaii Corp. 46.96 10.26% 12.36 3.80 1.80 3.83% 47%
PRK Park National Corp. 64.10 10.65% 14.21 4.51 3.76 5.87% 83%
31 Companies


Watch List Summary

On the top of our list this week is Hudson City Bancorp (HCBK). The stock has been under pressure this week. Current yield of 6% is attractive but with nearly $30B of debt and only $650M of cash on hand, it many not be worth risk/reward.

Sysco (SYY) remains second on our list again. Our guess is that the stock has been hit by the high food costs and the inability to pass such costs on to customers. Two weeks ago shares were trading at 3.73% yield which is slightly lower than where we are. If share revert to "undervalue" range of 2% according to IQTrend, that's a 87% upside from here.

Target (TGT) is another name with a tremendous upside potential gauging by the relative dividend yield establish by IQTrend. Historically, shares are undervalue at 1% yield. With the stock trading nearly 2%, it has the potential to double, all else being equal.

Top Five Performance Review

In our ongoing review of the NLO Dividend Watch List, we have taken the top five stocks on our list from March 12, 2010 and have check their performance one year later. The top five companies on that list can be seen in the table below.

Symbol Name 2010 Price 2011 Price % change
XOM Exxon Mobil Corp.   66.80 82.12 22.93%
AWR American States Water Co. 32.50 32.93 1.32%
MON Monsanto Co. 72.35 67.51 -6.69%
FPL FPL Group, Inc. 47.07 55.69 18.31%
CWT California Water Service 36.55 35.17 -3.78%


Average 6.42%


DJI Dow Jones Industrial 10,624.69 12,044.40 13.36%
SPX S&P 500 1,149.99 1,304.28 13.42%

The performance of our top five stocks lagged the overall market. Exxon (XOM) was a slow starter but once crude price picked up, it carried on the momentum. California Water (CWT) and Monstanto (MON) were the major drag for our top five.

Disclaimer
On our current list, we excluded companies that have no earnings. Stocks that appear on our watch lists are not recommendations to buy. Instead, they are the starting point for doing your research and determining the best company to buy. Ideally, a stock that is purchased from this list is done after a considerable decline in the price and extensive due diligence. We suggest that readers use the March 2009 low (or the companies' most distressed level in the last 2 years) as the downside projection for investing. Our view is to embrace the worse case scenario prior to investing. A minimum of 50% decline or the November 2008 to March 2009 low, whichever is lower, would fit that description. It is important to place these companies on your own watch list so that when the opportunity arises, you can purchase them with a greater margin of safety. It is our expectation that, at the most, only 1/3 of the companies that are part of our list will outperform the market over a one-year period.

Please revisit New Low Observer for edits and revisions to this post. Email us.

NLO Dividend Watch List

Our watch list this week contains 22 companies that are within 10% of their 52-week low.

February 25, 2011 Watch List

Symbol Name Price % Yr Low P/E EPS (ttm) Dividend Yield Payout Ratio
RBCAA Republic BanCorp., Inc.  17.21 2.44% 5.57 3.09 0.57 3.31% 18%
SYY Sysco Corp. 27.91 2.88% 14.39 1.94 1.04 3.73% 54%
CWT California Water Service 35.13 3.90% 18.59 1.89 1.23 3.50% 65%
PPL PP&L Corporation 24.81 4.46% 11.43 2.17 1.40 5.64% 65%
MRK Merck & Co., Inc 32.19 4.85% 9.41 3.42 1.52 4.72% 44%
JNJ Johnson & Johnson   59.64 4.89% 12.48 4.78 2.16 3.62% 45%
HCBK Hudson City Bancorp, Inc. 11.38 5.37% 10.44 1.09 0.60 5.27% 55%
PEP PepsiCo Inc. 63.6 5.44% 16.22 3.92 1.92 3.02% 49%
WABC Westamerica BanCorp.  51.8 6.37% 16.14 3.21 1.44 2.78% 45%
LLY Eli Lilly & Co. 34.09 6.46% 7.44 4.58 1.96 5.75% 43%
CL Colgate-Palmolive Co. 78.12 6.84% 18.13 4.31 2.12 2.71% 49%
ABT Abbott Laboratories 47.64 6.84% 16.09 2.96 1.92 4.03% 65%
MCY Mercury General Corp. 40.62 7.18% 14.61 2.78 2.40 5.91% 86%
AWR American States Water Co. 33.68 7.81% 22.91 1.47 1.04 3.09% 71%
WMT Wal-Mart Stores, Inc. 51.75 8.33% 11.60 4.46 1.21 2.34% 27%
TGT Target Corp. 52.36 8.56% 13.71 3.82 1.00 1.91% 26%
FCBC First Community Bancshares 12.52 8.87% 10.18 1.23 0.40 3.19% 33%
CAG ConAgra Foods, Inc. 23.00 9.42% 15.44 1.49 0.92 4.00% 62%
NWN Northwest Natural Gas Co. 46.05 9.90% 16.39 2.81 1.74 3.78% 62%
KMB Kimberly-Clark Corp. 65.08 9.97% 14.62 4.45 2.80 4.30% 63%
WEYS Weyco Group, Inc.  24.58 10.27% 21.37 1.15 0.64 2.60% 56%
VLY Valley National BanCorp.  13.67 10.87% 16.88 0.81 0.72 5.27% 89%
22 Companies


Watch List Summary

On the top of our list this week is Republic Bancorp (RBCAA). It is a small regional bank with market cap of just $360 million. The company has an impressing record of dividend payments even through the financial crisis (see chart). Despite the turmoil in the market, it managed to keep the payout ratio below 40%. The highest that figure came was in 2007 at 37%. Republic Bancorp may worth looking into.

Next on our list is Sysco (SYY), a distributor to the food service industry. Our guess is that the stock has been hit by the high food costs and the inability to pass such costs on to customers. What the market may be overlooking is the short-term fundamentals versus the longer-term viability. As recent as last month Sysco raised their dividend payout by 4%.  This is an indication that company management believes that, despite the high food prices, prospects for Sysco aren't as dire as people may believe.

After topping our list two weeks ago, Abbott (ABT) rose 4.5%.

Top Five Performance Review

In our ongoing review of the NLO Dividend Watch List, we have taken the top five stocks on our list from February 26, 2010 and have check their performance one year later. The top five companies on that list can be seen in the table below.

Symbol Name 2010 Price 2011 Price % change
THFF First Financial Corp. 26.28 32.22 22.60%
XOM Exxon Mobil Corp.   65.00 85.34 31.29%
MON Monsanto Co. 70.65 72.21 2.21%
CWT California Water Service 35.88 35.13 -2.09%
SRCE 1st Source Corp.  14.93 19.4 29.94%


Average 16.79%


DJI Dow Jones Industrial 10,325.26 12,130.45 17.48%
SPX S&P 500 1,104.49 1,319.88 19.50%

The performance of our top five stocks were not as impressive as the overall market. California Water (CWT) and Monsanto (MON) held our list to a 16% average gain. Monsanto took a big hit mid-year when the company reduced earning guidance mid year. The shares tumbled and nearly marked the -40% zone as seen in the chart. Investors who went against the tide and bought Monsanto in June/July were handsomely rewarded.

Disclaimer

On our current list, we excluded companies that have no earnings. Stocks that appear on our watch lists are not recommendations to buy. Instead, they are the starting point for doing your research and determining the best company to buy. Ideally, a stock that is purchased from this list is done after a considerable decline in the price and extensive due diligence. We suggest that readers use the March 2009 low (or the companies' most distressed level in the last 2 years) as the downside projection for investing. Our view is to embrace the worse case scenario prior to investing. A minimum of 50% decline or the November 2008 to March 2009 low, whichever is lower, would fit that description. It is important to place these companies on your own watch list so that when the opportunity arises, you can purchase them with a greater margin of safety. It is our expectation that, at the most, only 1/3 of the companies that are part of our list will outperform the market over a one-year period.

Please revisit New Low Observer for edits and revisions to this post. Email us.

NLO Dividend Watch List

The market continued its upward momentum this week.  The Dow Industrial reached another yearly high while the Dow Transport reconfirmed the move on the upside.  Our Dow Theory article will be posted shortly.  Our watch list this week contains 16 companies that are within 10% of their 52-week low. 

February 11, 2011 Watch List

Symbol Name Price % Yr Low P/E EPS (ttm) Dividend Yield Payout Ratio
ABT Abbott Laboratories 45.56 2.18% 15.39 2.96 1.76 3.86% 59%
SYY Sysco Corp. 28.24 4.09% 14.48 1.95 1.04 3.68% 53%
PPL PP&L Corporation 24.75 4.21% 13.67 1.81 1.40 5.66% 77%
WABC Westamerica BanCorp.  51.00 4.72% 15.89 3.21 1.44 2.82% 45%
MCY Mercury General Corp. 40.07 5.73% 10.46 3.83 2.40 5.99% 63%
PEP PepsiCo Inc. 63.87 5.89% 16.09 3.97 1.92 3.01% 48%
HCBK Hudson City Bancorp 11.48 6.30% 10.53 1.09 0.60 5.23% 55%
AWR American States Water 33.22 6.34% 22.60 1.47 1.04 3.13% 71%
CWT California Water Service 36.04 6.60% 19.07 1.89 1.23 3.41% 65%
JNJ Johnson & Johnson   60.70 6.75% 12.70 4.78 2.16 3.56% 45%
CAG ConAgra Foods, Inc. 22.52 7.14% 15.11 1.49 0.92 4.09% 62%
MRK Merck & Co., Inc 33.07 7.72% 118.11 0.28 1.52 4.60% 543%
LLY Eli Lilly & Co. 34.52 7.81% 7.54 4.58 1.96 5.68% 43%
CL Colgate-Palmolive Co. 78.92 7.93% 18.31 4.31 2.12 2.69% 49%
WEYS Weyco Group, Inc.  24.36 9.98% 21.18 1.15 0.64 2.63% 56%
NWN Northwest Natural Gas 45.36 9.49% 16.14 2.81 1.74 3.84% 62%
16 Companies


Watch List Summary

Abbott (ABT) topped our list again this week. Again we speculate that the company could easily raise its dividend from $0.44 to $0.48 (9% increase) in the coming months. At current price, estimated dividend yield will be north of 4%. Sysco (SYY) took a hit after the earning came short of analyst estimate. Shares fell 3.25% since last watch list.

Top Five Performance Review

In our ongoing review of the NLO Dividend Watch List, we have taken the top five stocks on our list from February 19, 2010 and have check their performance one year later. The top five companies on that list can be seen in the table below.

Name Symbol 2010 Price 2011 Price % change
First Financial Corp. THFF 26.49 32.1 21.18%
EXXON MOBIL CP XOM 64.8 82.82 27.81%
CALIFORNIA WATER CWT 35.92 36.04 0.33%
AMER ST WATER AWR 32.05 33.22 3.65%
AQUA AMERICA INC WTR 16.59 23.43 41.23%


Average 18.84%


Dow Jones Industrial DJI 10,099.14 12,273.29 21.53%
S&P 500 SPX 1,075.51 1,329.15 23.58%


Disclaimer
On our current list, we excluded companies that have no earnings. Stocks that appear on our watch lists are not recommendations to buy. Instead, they are the starting point for doing your research and determining the best company to buy. Ideally, a stock that is purchased from this list is done after a considerable decline in the price and extensive due diligence. We suggest that readers use the March 2009 low (or the companies' most distressed level in the last 2 years) as the downside projection for investing. Our view is to embrace the worse case scenario prior to investing. A minimum of 50% decline or the November 2008 to March 2009 low, whichever is lower, would fit that description. It is important to place these companies on your own watch list so that when the opportunity arises, you can purchase them with a greater margin of safety. It is our expectation that, at the most, only 1/3 of the companies that are part of our list will outperform the market over a one-year period.

Please revisit New Low Observer for edits and revisions to this post. Email us.

NLO Dividend Watch List

The Dow hit 12,000 intra-week but closed decisively lower at 11,823. The S&P 500 was flat for the week. Our watch list has 16 companies that are within 10% of their 52-week low.

January 28, 2011 Watch List

Symbol Name Price % Yr Low P/E EPS (ttm) Dividend Yield Payout Ratio
ABT Abbott Laboratories 45.49 2.02% 15.01 3.03 1.76 3.87% 58%
WABC Westamerica BanCorp.  50.13 2.94% 15.62 3.21 1.44 2.87% 45%
WEYS Weyco Group, Inc.  22.78 3.03% 19.64 1.16 0.64 2.81% 55%
SHEN Shenandoah Telecom. 16.31 4.82% 17.92 0.91 0.33 2.02% 36%
CL Colgate-Palmolive Co. 76.99 5.29% 17.99 4.28 2.12 2.75% 50%
JNJ Johnson & Johnson   60.01 5.54% 12.32 4.87 2.16 3.60% 44%
CAG ConAgra Foods, Inc. 22.44 6.76% 15.06 1.49 0.92 4.10% 62%
NWN Northwest Natural Gas 44.02 7.24% 15.72 2.80 1.74 3.95% 62%
UVV Universal Corp. 37.99 7.44% 7.46 5.09 1.92 5.05% 38%
MRK Merck & Co., Inc 33.07 7.72% 12.77 2.59 1.52 4.60% 59%
CLX Clorox Co. 63.79 8.10% 13.72 4.65 2.20 3.45% 47%
SYY Sysco Corp. 29.19 8.15% 14.97 1.95 1.04 3.56% 53%
CWT California Water Service 36.58 8.19% 19.35 1.89 1.19 3.25% 63%
LLY Eli Lilly & Co. 34.77 8.59% 7.97 4.36 1.96 5.64% 45%
AWR American States Water 33.9 8.65% 23.06 1.47 1.04 3.07% 71%
PEP PepsiCo Inc. 64.4 9.62% 16.22 3.97 1.92 2.98% 48%
16 Companies


Watch List Summary

Abbott (ABT) topped our list this week after falling 5%. Wall Street wasn't happy with the company's short-term outlook even after the company guided for double digit growth in the coming year. With Abbott trading close to its historically high yield, we couldn't help but to accumulate some on its way down. Given an estimated double digit growth, we speculate that the company could easily raise its dividend from $0.44 to $0.48 (9% increase) in the coming months. At current price, estimated dividend yield will be north of 4%.

Some other noteworthy names on this list are Colgate-Palmolive (CL), Johnson & Johnson (JNJ), Clorox (CLX), Sysco (SYY), and Pepsi (PEP). All of them have dividend yield that are higher than 7-year T-Bill and are trading near their historical high yield. According to the book, Dividends Don't Lie by Geraldine Weiss, this mark great value proposition for long-term holder.

Top Five Performance Review

In our ongoing review of the NLO Dividend Watch List, we have taken the top five stocks on our list from January 29, 2010 and have check their performance one year later. The top five companies on that list can be seen in the table below.

Name Symbol 2010 Price 2011 Price % change
First Financial Corp. THFF 27.6 31.46 13.99%
Exxon Mobile XOM 64.43 78.99 22.60%
Shenandoah Telecom SHEN 17.2 16.31 -5.17%
Aqua America WTR 16.59 23.18 39.72%
California Water CWT 36.32 36.58 0.72%


Average 14.37%


Dow Jones Industrial DJI 10,067.33 11,823.70 17.45%
S&P 500 SPX 1,073.87 1,276.34 18.85%

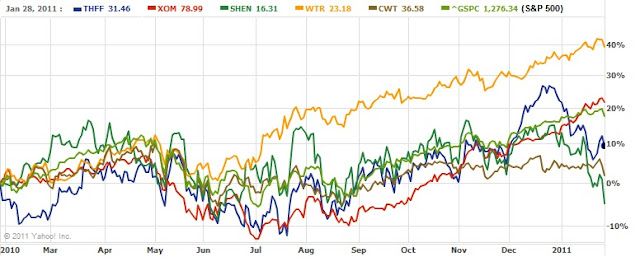
Our top five under performed both the Dow and S&P. Only Exxon (XOM) and Aqua America (WTR) beat those two indices. Although Shenandoah (SHEN) fell 5% over one-year, it rose above 15% in less than two months, giving investors an opportunity to take some profit off the table.

Disclaimer
On our current list, we excluded companies that have no earnings. Stocks that appear on our watch lists are not recommendations to buy. Instead, they are the starting point for doing your research and determining the best company to buy. Ideally, a stock that is purchased from this list is done after a considerable decline in the price and extensive due diligence. We suggest that readers use the March 2009 low (or the companies' most distressed level in the last 2 years) as the downside projection for investing. Our view is to embrace the worse case scenario prior to investing. A minimum of 50% decline or the November 2008 to March 2009 low, whichever is lower, would fit that description. It is important to place these companies on your own watch list so that when the opportunity arises, you can purchase them with a greater margin of safety. It is our expectation that, at the most, only 1/3 of the companies that are part of our list will outperform the market over a one-year period.

Please revisit New Low Observer for edits and revisions to this post. Email us.

NLO Dividend Watch List

We began the year with a very strong market that also included a Dow Theory confirmation of the bullish trend and our watch list now contains 19 companies that are within 15% of their 52-week low.

January 14, 2011 Watch List

Symbol Name Price % Yr Low P/E EPS (ttm) Dividend Yield Payout Ratio
ABT Abbott Laboratories 46.89 5.16% 15.48 3.03 1.76 3.75% 58%
CL Colgate-Palmolive Co. 78.31 7.10% 18.30 4.28 2.12 2.71% 50%
CLX Clorox Co. 63.98 8.51% 13.76 4.65 2.20 3.44% 47%
LLY Eli Lilly & Co. 34.91 9.03% 8.01 4.36 1.96 5.61% 45%
KMB Kimberly-Clark Corp. 63.64 9.25% 14.40 4.42 2.64 4.15% 60%
CAG ConAgra Foods, Inc. 23.11 9.94% 15.51 1.49 0.92 3.98% 62%
JNJ Johnson & Johnson   62.55 10.01% 12.84 4.87 2.16 3.45% 44%
UVV Universal Corp. 39 10.29% 7.66 5.09 1.92 4.92% 38%
NWN Northwest Natural Gas Co. 45.71 11.35% 16.33 2.80 1.74 3.81% 62%
CWT California Water Service 37.68 11.45% 19.94 1.89 1.19 3.16% 63%
MRK Merck & Co., Inc 34.23 11.50% 13.22 2.59 1.52 4.44% 59%
SYY Sysco Corp. 30.45 12.82% 15.70 1.94 1.04 3.42% 54%
AWR American States Water Co. 35.24 12.95% 23.97 1.47 1.04 2.95% 71%
PEP PepsiCo Inc. 66.78 13.67% 16.82 3.97 1.92 2.88% 48%
TGT Target Corp. 55.07 14.18% 14.42 3.82 1.00 1.82% 26%
ALL Allstate Corp.   30.71 14.33% 14.49 2.12 0.80 2.61% 38%
WMT Wal-Mart Stores, Inc. 54.81 14.74% 13.57 4.04 1.21 2.21% 30%
WABC Westamerica BanCorp.  55.9 14.78% 17.52 3.19 1.44 2.58% 45%
MCY Mercury General Corp. 42.97 14.95% 11.22 3.83 2.40 5.59% 63%
19 Companies


Watch List Summary

Some of these companies have been "stuck" on our list for quite some time. Clorox (CLX) has been stuck in the $62 and $64 range for about 10 weeks. For six months Colgate (CL) has spent most of its time trading between $80 and $75.  According to Charles Dow, this biding of time by trading in a "line" creates values  (article here) and may be the first sign of accumulation by institutional investors. Moreover, if the price remains constant while the underlying fundamentals improve (i.e. earnings, dividend, cash flow, book value etc.), the shares could be deemed screaming buys. Conservative and patience investors may want to start their research on these names.

Insurance names are of particular focus by our team currently.  According to Yahoo!Finance, Allstate (ALL) sports a price to book ratio (P/B) of 0.86 while Mercury General (MCY) has a P/B of 1.27.  We are actively buying up many insurance company stocks that have exceptionally low price to book ratios on a relative basis.

Northwest Natural Gas (NWN) is again creeping towards its annual cycle of bottoming in February and March.  Our October 3, 2009 article (located here) on this topic provides what we believe is extensive reseach on the pattern of cycle bottoms for NWN going as far back as 1970. As a follow-up, another article (located here) that we did on NWN provides technical insights on Edson Gould's Altimeter by comparing the stock price movement between 1995-1997 and 2000-2009.  These elements may assist in your fundamental analysis of a great stock with a decent dividend yield.

Top Five Performance Review

In our ongoing review of the NLO Dividend Watch List, we have taken the top five stocks on our list from January 15, 2010 and have check their performance one year later. The top five companies on that list can be seen in the table below.
Name Symbol 2010 Price 2011 Price % change
Shenandoah Telecom. SHEN 17.18 19.19 11.70%
First Financial Corp. THFF 28.97 33.12 14.33%
1st Source Corp. SRCE 15.14 19.88 31.31%
Exxon Mobil XOM 69.11 77.84 12.63%
California Water CWT 37.7 37.68 -0.05%


Average 13.98%


Dow Jones Industrial DJI 10,706.99 11,787.38 10.09%
S&P 500 SPX 1,147.72 1,293.24 12.68%

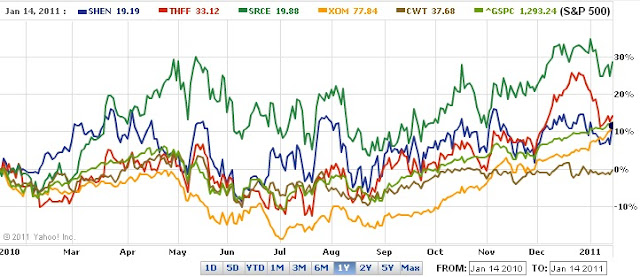
While our average return was greater than the market, only two companies, First Financial (SRCE) and Shenandoah (SHEN), accomplished the 10% benchmark in less than six months. It's also interesting to note that while ExxonMobil (XOM) underperformed the market for the majority of the year, it managed to track the market at the end of the one year mark. Taking the dividend into consideration, Exxon may have outperformed the market by about one percent.

Disclaimer

On our current list, we excluded companies that have no earnings. Stocks that appear on our watch lists are not recommendations to buy. Instead, they are the starting point for doing your research and determining the best company to buy. Ideally, a stock that is purchased from this list is done after a considerable decline in the price and extensive due diligence. We suggest that readers use the March 2009 low (or the companies' most distressed level in the last 2 years) as the downside projection for investing. Our view is to embrace the worse case scenario prior to investing. A minimum of 50% decline or the November 2008 to March 2009 low, whichever is lower, would fit that description. It is important to place these companies on your own watch list so that when the opportunity arises, you can purchase them with a greater margin of safety. It is our expectation that, at the most, only 1/3 of the companies that are part of our list will outperform the market over a one-year period.

Please revisit New Low Observer for edits and revisions to this post. Email us.

NLO Dividend Watch List

Watch List Summary

We end 2010 and begin 2011 with 10 companies on our Dividend Watch List. The table below provides investors with some great prospects for the new year.
December 31, 2010 Watch List

Symbol Name Price % Yr Low P/E EPS (ttm) Dividend Yield Payout Ratio
CLX Clorox Co. 63.28 7.33% 13.61 4.65 2.20 3.48% 47%
CAG ConAgra Foods, Inc. 22.58 7.42% 14.29 1.58 0.92 4.07% 58%
ABT Abbott Laboratories 47.91 7.45% 15.81 3.03 1.76 3.67% 58%
KMB Kimberly-Clark Corp. 63.04 8.22% 14.26 4.42 2.64 4.19% 60%
JNJ Johnson & Johnson   61.85 8.78% 12.70 4.87 2.16 3.49% 44%
SYY Sysco Corp. 29.40 8.93% 15.15 1.94 1.04 3.54% 54%
LLY Eli Lilly & Co. 35.04 9.43% 8.04 4.36 1.96 5.59% 45%
CL Colgate-Palmolive Co. 80.37 9.92% 18.78 4.28 2.12 2.64% 50%
CWT California Water Service 37.27 10.23% 19.72 1.89 1.19 3.19% 63%
AWR American States Water 34.47 10.48% 23.45 1.47 1.04 3.02% 71%
10 Companies


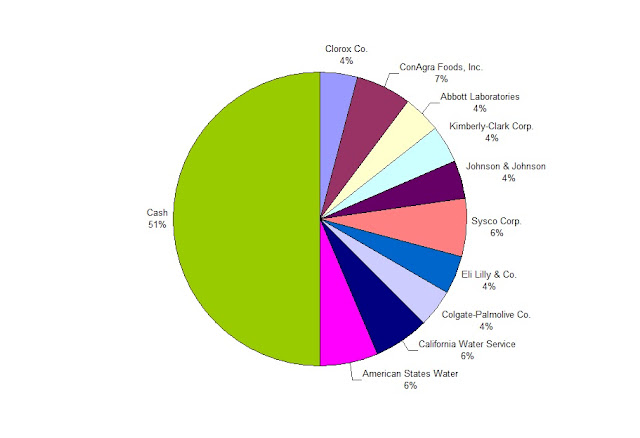
Looking at the current watch list, it appears to have good elements of a "diversified" portfolio.  Below is how we would manage the distribution of an investment portfolio of the above stocks in the coming year:
As each position achieves a 10% return within a year, we consider selling the stock and rolling the funds into cash or the next best alternative.  It could be said that the watchlist above is one of the most compelling portfolios for new investors. We've broken down the positions into industry groups so that each industry (water, big pharma, food producers/distributors, household products) gets approximately 25% of invested funds or 12.5% of the entire portfolio.  The cash is for any dividend stock (in the universe of those stocks that had a history increasing annual dividends every year for a minimum of 10 years in a row) that suddenly becomes underpriced and could be verified to be a viable going concern based on fundamental metrics.  We'd label this the portfolio for 2011. 

Top Five Performance Review

In our ongoing review of the NLO Dividend Watch List, we have taken the top five stocks on our list from January 1, 2010 and have check their performance one year later. The top five companies on that list can be seen in the table below.

Name Symbol 2009 Price 2010 Price % change
SUPERVALU Inc. SVU 12.71 9.63 -24.23%
California Water Service CWT 36.82 37.27 1.22%
Exxon Mobil Corp.   XOM 68.19 73.12 7.23%
CR Bard, Inc. BCR 77.9 91.77 17.80%
Aqua America Inc WTR 17.51 22.48 28.38%


Average 6.08%


Dow Jones Industrial DJI 10,520.10 11,577.51 10.05%
S&P 500 SPX 1,126.48 1,257.64 11.64%
It is interesting to note that we've had personal experience will all of the stocks mentioned above within the last 18 months.  Although SuperValu (SVU) shows a major decline of over -30% at one point in the last year, we were able to achieve an annualized return of nearly 400% with our recommendation and subsequent sell recommendation in the month of January 2010 (article here).  This is one instance where buy and hold wasn't the most exciting policy.
California Water (CWT) was recommended on January 3, 2010 (article here) and we suggested that, based on cycle analysis, the prospects of CWT making a substantial move above the prior high would be between 2011 and 2012.  CWT proved to be an income generater in 2010 for investors who managed to hold the stock understanding that the price probably wouldn't take off immediately.  Our downside target are still in place for anyone considering the stock.
ExxonMobil (XOM) was another recommendation that we made in January of 2010.  The stock fell 15% during the year and recovered to return 10% on a total return basis which prompted our sell recommendation in December 2010 (article here).
Bard Corp (BCR) provided annualized returns of 29% at the time of our August 2009 sell recommendation (article here). We had held the stock for approximately 4 months with satisfactory results.  As noted in all or our recommendations, we seek modest annualized returns of between 9% and 12%.  Therefore, accomplishing 29% allows us to take advantage of other opportunities that may exist at the time.
AquaAmerica (WTR) was a runaway success in the past year considering the performance of the market overall and that a water utility is only expected to provide income to investors.  As indicated in the chart above, WTR's total return exceeded over 30% (dividends plus appreciation).  In December 2010, we provided our sell recommendation of AquaAmerica (article here) after garnering an annualized total return of nearly 80%.

Disclaimer

On our current list, we excluded companies that have no earnings. Stocks that appear on our watch lists are not recommendations to buy. Instead, they are the starting point for doing your research and determining the best company to buy. Ideally, a stock that is purchased from this list is done after a considerable decline in the price and extensive due diligence. We suggest that readers use the March 2009 low (or the companies' most distressed level in the last 2 years) as the downside projection for investing. Our view is to embrace the worse case scenario prior to investing. A minimum of 50% decline or the November 2008 to March 2009 low, whichever is lower, would fit that description. It is important to place these companies on your own watch list so that when the opportunity arises, you can purchase them with a greater margin of safety. It is our expectation that, at the most, only 1/3 of the companies that are part of our list will outperform the market over a one-year period.

Please revisit New Low Observer for edits and revisions to this post. Email us.

NLO Dividend Watch List

Watch List Summary

This week's list contains 10 companies that are concentrated in the drug, household goods and food sector of the economy.  In addition, eight of the 10 companies have market caps of over $8 billion. Topping this list is a popular household name, Clorox (CLX). ConAgra (CAG) is one of our favorite names right now and we're reiterating that anyone interested in the stock to revisit our write up on it. Our latest Investment Observation was on Eli Lilly (LLY), a major pharmaceutical company. LLY is the 7th company on our list this week.

December 17, 2010 Watch List

Symbol Name Price % Yr Low P/E EPS Dividend Yield Payout Ratio
CLX Clorox Co. 62.54 6.07% 13.42 4.66 2.20 3.52% 47%
TCB TCF Financial Corp. 13.77 6.74% 13.77 1.00 0.20 1.45% 20%
CAG ConAgra Foods, Inc. 22.49 6.99% 14.32 1.57 0.92 4.09% 59%
KMB Kimberly-Clark Corp. 62.74 7.71% 14.19 4.42 2.64 4.21% 60%
ABT Abbott Laboratories 48.40 8.54% 15.97 3.03 1.76 3.64% 58%
SYY Sysco Corp. 29.30 8.60% 15.10 1.94 1.04 3.55% 54%
LLY Eli Lilly & Co. 35.01 9.34% 8.03 4.36 1.96 5.60% 45%
JNJ Johnson & Johnson   62.54 9.99% 12.84 4.87 2.16 3.45% 44%
CL Colgate-Palmolive Co. 81.00 10.78% 18.93 4.28 2.12 2.62% 50%
WFSL Washington Federal, Inc.  15.50 10.95% 14.76 1.05 0.20 1.29% 19%
10 Companies


Top Five Performance Review

In our ongoing review of the NLO Dividend Watch List, we have taken the top five stocks on our list from December 18, 2009 and have checked their performance one year later. The top five companies on that list can be seen in the table below.

Name Symbol 2009 Price 2010 Price % change
SUPERVALU INC SVU 12.48 8.76 -29.81%
CALIFORNIA WATER CWT 36.66 38.38 4.69%
EXXON MOBIL CP XOM 68.21 72.17 5.81%
AQUA AMERICA INC WTR 17.29 22.21 28.46%
UMB Financial Corp. UMBF 37.94 41.43 9.20%


Average 3.67%


Dow Jones Industrial DJI 10,328.89 11,491.91 11.26%
S&P 500 SPX 1,102.47 1,243.91 12.83%

This week, our top five didn't come close to the Dow Jones Industrial Average and the S&P 500. While we can't defend the long-term viability of Supervalu (SVU) at this time, we can point to the fact that SVU rose almost 40% in just 3 months after being on the December 18, 2009 list. We also issued an Investment Observation on this stock on January 6, 2010 when SuperValu (SVU) was trading just below $13. After holding the shares for 9 days, we issued a Sell Recommendation on January 15, 2010 which provided us with a 10% gain for an annualized return of nearly 400%.

It should be noted that three of the five stocks achieved 10% gains within 7 months after being on the list December 18, 2009 watch list.  SuperValu (SVU) accomplished 10% on January 12th (125% annualized), UMB Financial (UMBF) accomplished 10% on January 20th (nearly 96% annualized) and AquaAmerica (WTR) achieved 10% on July 21st (nearly 15% annualized). 

As mentioned with every sell recommendation, our goal is to maximize the annual yield of each trade so if we can obtain a 10% gain in less than a year (the approximate historical annual market return) then we are satisfied. Those who wish to hold for the "long-term" may also benefit from our method of buying quality dividend paying stocks near a new low.

Disclaimer
On our current list, we excluded companies that have no earnings. Stocks that appear on our watch lists are not recommendations to buy. Instead, they are the starting point for doing your research and determining the best company to buy. Ideally, a stock that is purchased from this list is done after a considerable decline in the price and extensive due diligence. We suggest that readers use the March 2009 low (or the companies' most distressed level in the last 2 years) as the downside projection for investing. Our view is to embrace the worse case scenario prior to investing. A minimum of 50% decline or the November 2008 to March 2009 low, whichever is lower, would fit that description. It is important to place these companies on your own watch list so that when the opportunity arises, you can purchase them with a greater margin of safety. It is our expectation that, at the most, only 1/3 of the companies that are part of our list will outperform the market over a one-year period.

Please revisit New Low Observer for edits and revisions to this post. Email us.

NLO Dividend Watch List

Watch List Summary

This week's list contains 18 companies that are among some of the biggest blue-chip institutions out there. Topping this list again is the giant food supplier, ConAgra (CAG). The New Low team has issued an Investment Observation on ConAgra that is worth reading.

December 3, 2010 Watch List

Symbol Name Price % Yr Low P/E EPS (ttm) Dividend Yield Payout Ratio
CAG ConAgra Foods, Inc. 22.08 5.04% 14.06 1.57 0.92 4.17% 59%
TFX Teleflex Inc. 50.53 5.45% 12.48 4.05 1.36 2.69% 34%
CLX Clorox Co. 62.49 5.99% 13.41 4.66 2.20 3.52% 47%
ABT Abbott Laboratories 47.37 6.23% 15.63 3.03 1.76 3.72% 58%
KMB Kimberly-Clark Corp. 62.01 6.45% 14.03 4.42 2.64 4.26% 60%
CL Colgate-Palmolive Co. 77.95 6.61% 18.21 4.28 2.12 2.72% 50%
LLY Eli Lilly & Co. 34.14 6.62% 7.83 4.36 1.96 5.74% 45%
GBCI Glacier BanCorp., Inc.  13.60 7.26% 21.59 0.63 0.52 3.82% 83%
UVV Universal Corp. 38.13 7.83% 7.49 5.09 1.92 5.04% 38%
BOH Bank of Hawaii Corp. 44.98 8.13% 11.84 3.80 1.80 4.00% 47%
SYY Sysco Corp. 29.30 8.60% 15.10 1.94 1.04 3.55% 54%
VLY Valley National BanCorp.  13.39 9.16% 17.62 0.76 0.72 5.38% 95%
WFSL Washington Federal, Inc.  15.26 9.23% 14.53 1.05 0.20 1.31% 19%
JNJ Johnson & Johnson   62.56 10.02% 12.85 4.87 2.16 3.45% 44%
WABC Westamerica BanCorp.  53.74 10.35% 16.85 3.19 1.44 2.68% 45%
OMI Owens & Minor, Inc. 28.18 10.42% 14.68 1.92 0.71 2.52% 37%
CWT California Water 37.39 10.59% 19.78 1.89 1.19 3.18% 63%
PEP PepsiCo Inc. 65.17 10.93% 16.42 3.97 1.92 2.95% 48%
18 Companies


Top Five Performance Review

In our ongoing review of the NLO Dividend Watch List, we have taken the top five stocks on our list from December 4, 2009 and have check their performance one year later. The top five companies on that list can be seen in the table below.

Name Symbol 2009 Price 2010 Price % change
Aqua America WTR 16.81 21.58 28.38%
WGL Holdings, Inc. WGL 31.86 35.98 12.93%
UGI Corp. UGI 23.59 31.98 35.57%
Northern Trust Corp. NTRS 48.69 52.82 8.48%
California Water CWT 37.67 37.39 -0.74%


Average 16.92%


Dow Jones Industrial DJI 10,388.90 11,382.09 9.56%
S&P 500 SPX 1,105.98 1,224.71 10.74%

Once again, our top five have beaten both the Dow Jones Industrial Average and the S&P 500.  Of particular interest to us is the performance of Northern Trust (NTRS).  If after a year of holding stock, the shares of NTRS have risen 8.5%.  In our recent investment observation (Sept 1, 2010) and sell recommendation (Dec 3, 2010) of Northern Trust, we managed a gain of 10.9% in a much shorter time frame.

As mentioned with every sell recommendation, our goal is to maximize the annual yield of each trade so if we can obtain a 10% gain in less than a year (the approximate historical annual market return) then we are satisfied. Those who wish to hold for the "long-term" may also benefit from our method of buying quality dividend paying stocks near a new low, Aqua America (WTR), WGL Holding (WGL), and UGI (UGI) are perfect examples.

  • See the 36% 1-year performance of our utility recommendation here.

Disclaimer 

On our current list, we excluded companies that have no earnings. Stocks that appear on our watch lists are not recommendations to buy. Instead, they are the starting point for doing your research and determining the best company to buy. Ideally, a stock that is purchased from this list is done after a considerable decline in the price and extensive due diligence. We suggest that readers use the March 2009 low (or the companies' most distressed level in the last 2 years) as the downside projection for investing. Our view is to embrace the worse case scenario prior to investing. A minimum of 50% decline or the November 2008 to March 2009 low, whichever is lower, would fit that description. It is important to place these companies on your own watch list so that when the opportunity arises, you can purchase them with a greater margin of safety. It is our expectation that, at the most, only 1/3 of the companies that are part of our list will outperform the market over a one-year period.

Please revisit New Low Observer for edits and revisions to this post. Email us.