
Members
-
Topics
Archives
-
-
Recent Posts
-
-
-
Investor Education
Market Return After Exceptional Years
Dollar Cost Averaging Tool
Dow Theory: The Formation of a Line
Dividend Capture Strategy Analysis
Golden Cross – How Golden Is It?
Debunked – Death Cross
Work Smart, Not Hard
Charles H. Dow, Father of Value Investing
It's All About the Dividends
Dow Theory: Buying in Scales
How to Avoid Losses
When Dividends are Canceled
Cyclical and Secular Markets
Inflation Proof Myth
What is Fair Value?
Issues with P-E Ratios
Beware of Gold Dividends
Gold Standard Myth
Lagging Gold Stocks?
No Sophisticated Investors
Dollar down, Gold up?
Problems with Market Share
Aim for Annualized Returns
Anatomy of Bear Market Trade
Don’t Use Stop Orders
How to Value Earnings
Low Yields, Big Gains
Set Limits, Gain More
Ex-Dividend Dates -
-
Historical Data
1290-1950: Price Index
1670-2012: Inflation Rate
1790-1947: Wholesale Price Cycle
1795-1973: Real Estate Cycle
1800-1965: U.S. Yields
1834-1928: U.S. Stock Index
1835-2019: Booms and Busts
1846-1895: Gold/Silver Value
1853-2019: Recession/Depression Index
1860-1907: Most Active Stock Average
1870-2033: Real Estate Cycles
1871-2020: Market Dividend Yield
1875-1940: St. Louis Rents
1876-1934: Credit-New Dwellings
1896-1925: Inflation-Stocks
1897-2019: Sentiment Index
1900-1903: Dow Theory
1900-1923: Cigars and Cigarettes
1900-2019: Silver/Dow Ratio
1901-2019: YoY DJIA
1903-1907: Dow Theory
1906-1932: Barron's Averages
1907-1910: Dow Theory
1910-1913: Dow Theory
1910-1936: U.S. Real Estate
1910-2016: Union Pacific Corp.
1914-2012: Fed/GDP Ratio
1919-1934: Barron's Industrial Production
1920-1940: Homestake Mining
1921-1939: US Realty
1922-1930: Discount Rate
1924-2001: Gold/Silver Stocks
1927-1937: Borden Co.
1927-1937: National Dairy Products
1927-1937: Union Carbide
1928-1943: Discount Rate
1929-1937: Monsanto Co.
1937-1969: Intelligent Investor
1939-1965: Utility Stocks v. Interest Rates
1941-1967: Texas Pacific Land
1947-1970: Inventory-Sales Ratio
1948-2019: Profits v. DJIA
1949-1970: Dow 600? SRL
1958-1976: Gold Expert
1963-1977: Farmland Values
1971-2018: Nasdaq v. Gold
1971-1974: REIT Crash
1972-1979: REIT Index Crash
1986-2018: Hang Seng Index Cycles
1986-2019: Crude Oil Cycles
1999-2017: Cell Phone Market Share
2008: Transaction History
2010-2021: Bitcoin Cycles -
Interesting Read
Inside a Moneymaking Machine Like No Other
The Fuzzy, Insane Math That's Creating So Many Billion-Dollar Tech Companies
Berkshire Hathaway Shareholder Letters
Forex Investors May Face $1 Billion Loss as Trade Site Vanishes
Why the oil price is falling
How a $600 Million Hedge Fund Disappeared
Hedge Fund Manager Who Remembers 1998 Rout Says Prepare for Pain
Swiss National Bank Starts Negative
Tice: Crash is Coming...Although
More on Edson Gould (PDF)
Schiller's CAPE ratio is wrong
Double-Digit Inflation in the 1970s (PDF)
401k Crisis
Quick Link Archive
Category Archives: AEM
Agnico Eagle Mines (AEM) Price Momentum
Below is Agnico Eagle Mines (AEM) from 1990 to 2024 applying the Price Momentum Indicator. Continue reading
Gold Stocks Near New Low
This is the list of gold related equities that we track within 10% of the one year low. We strongly recommend that you do your own research on these companies and assume that the downside risk is half of the current price, at minimum.
Precious Metals Follow-Up
Silver
On February 11, 2012, we wrote a piece on Silver and SLV titled “Correction of Errors on iShares Silver Trust (SLV) Interpretation” (found here). In that article, we said the following:
“The current indications suggest that SLV will fall as [low as] the $22.14 support level. Because silver easily fell to the third support level in the period from 2001 to 2008 (within the context of a precious metal bull market), we expect that the $21.02 is a realistic worst case scenario to watch for. We will consider buying silver and related derivatives at $22.25 and below.
“We view the most recent rise from the December 2011 low as running out of steam.Therefore, the rising resistance level established at $28.70 appears to be firmly in place…for now.”
As seen in the chart below, Silver has declined to the rising support level of $21.02 in many instances but broke through to the downside on February 18, 2013.
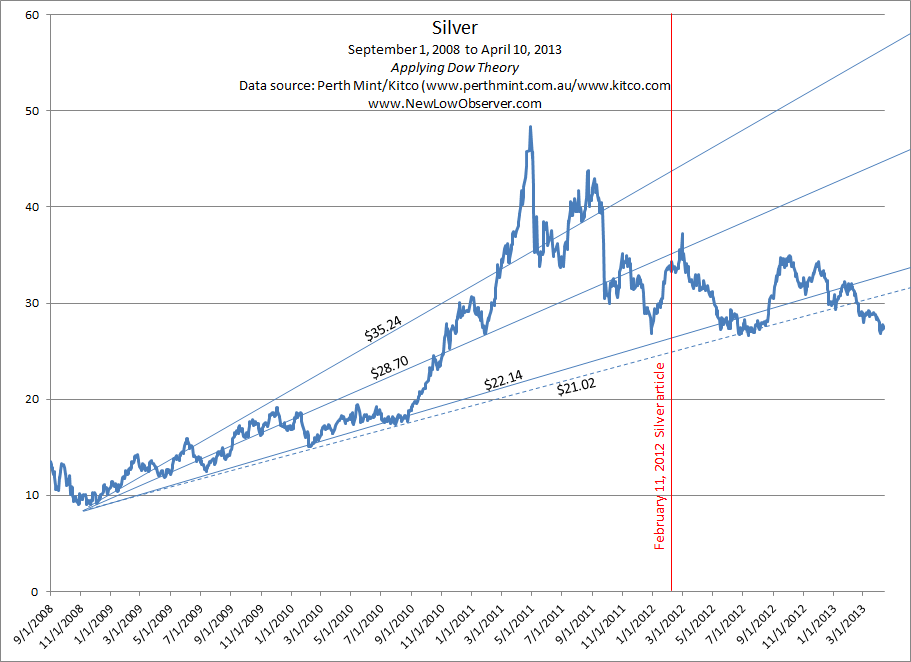
From a technical standpoint, the next downside target for silver may be to the $20 level if the current levels don’t hold. However, under typical circumstances, any point below the $21.02 level is considered undervalued. While it is possible that Silver could fall further we don’t play the short side since we’re in the position to accumulate good values. Values at this point trump the guesswork of when to enter and exit the short. We believe that anyone interested in the upside potential to silver should thoughtfully accept the potential loss of –50% or more and purchase in two stages, once at a predetermine price at or below the current level and a second time at or below the first purchase.
Agnico-Eagle Mines (AEM)
On April 6, 2012, we recommended the consideration of Agnico-Eagle Mines (AEM) (found here). On September 25, 2012, we recommended selling of AEM (found here). While we got a lot of heat from readers of the SELL recommendation, from the less than brilliant to the reasonably rational, our work has proven that precious metal bull markets are vicious and should not be taken lightly.
After our recommendation of AEM on April 6, 2012, the stock rose nearly +40%. When we gave the sell recommendation of AEM on September 25, 2012, the stock increased an additional +11%. However, as of April 12, 2013, AEM is down –27% from our sell recommendation and down –37% from the November 2012 high at $57.33.

Never under-estimate the power of a gold bull market. We hope that our work on this topic has been instructive.
Agnico-Eagle Is Now A Sell
On April 8, 2012 (article found here), we recommended Agnico-Eagle Mines (AEM). At the time, we were basing our first individual recommendation of gold stocks on our Gold Stock Indicator. Our Gold Stock Indicator had been in a declining trend since November 2010 suggesting that no purchase of gold stocks should take place. However, once our Gold Stock Indicator declined below the long-term buy indication in early April 2012, it was a clear signal to start acquiring gold stocks.

The reversal of the declining trend has been reflected in gains in the gold stock sector across the board. In our initial analysis of Agnico-Eagle Mines (AEM) we projected that, based on Edson Gould’s Altimeter, the stock price was likely to increase from +100% to +175% over a two year period. Since our recommendation on April 8th, Agnico-Eagle has gained just over +45%. Our experience indicates that there will be many opportunities to re-acquire Agnico-Eagle at better relative prices.

According to Value Line Investment Survey, Agnico-Eagle trades at a fair value of $39. The current price of Agnico-Eagle, at $49.76, is 27% above the fair value price. Stocks that are selling above fair value and that have had above market returns should be sold. Yahoo!Finance and Morningstar.com indicate that Agnico-Eagle is operating at a loss for the trailing 12-months. We will re-consider Agnico-Eagle when the stock approaches an undervalued range based Edson Gould’s Altimeter.
Those not interested in following through with our sell recommendation can feel comfortable knowing that Agnico-Eagle (AEM) is a reasonable holding until our Gold Stock Indicator crosses above the long-term sell level. So far, AEM has a 45% downside cushion since our investment observation. It should be noted that the stock faces significant upside resistance at $52 and $60.
Comments Off on Agnico-Eagle Is Now A Sell
Posted in AEM
Gold Stock Indicator: Short-term signal is down
Today we’ve received an indication that on a short-term basis, the direction for gold stocks is down.

As can be seen in the chart of our Gold Stock Indicator, the long-term buy indication has been triggered with the added bonus of a significant double-bottom on May 15th and July 23rd. This suggests that the long-term trend in the price for the Philadelphia Gold and Silver Stock Index (XAU) is up. However, as with any trend up or down, there are going to be counter-trend moves. Already, there have been five buy signals for gold stocks even though the overall trend has been down since November 2010.
Regarding the short-term Gold Stock Indicator being down:
-
For speculators, this means that DUST is a buy. The minimum downside risk DUST is $30 and could potentially decline to as low as $25. Remember, both DUST and NUGT are intended to be utilized for short periods of time.
-
Holders of Agnico-Eagle (AEM) should sell their position in this stock as it has increased over +40% since our April 8, 2012 recommendation (found here). It is suggested that only the principal is sold while the profit is allowed to grow risk-free.
Transaction Alert: Sold AEM & GFI, Bought NUGT
We have sold our positions in AEM and GFI and used the proceeds from those transactions to buy NUGT. We sold both AEM and GFI at a loss of slightly more than -5%. We decided not to over-concentrate in one sector by adding a third gold position.
We bought NUGT based on the dual (short and long-term) indication from our Gold Stock Indicator as indicated in our April 4, 2012 article (found here).
Our preference for using Direxion Gold Miners Bull (NUGT) and Direxion Gold Miners Bear (DUST) ETFs aren’t for the risk averse. DUST and NUGT are speculative vehicles and not investments meant to be held on a long term basis.
Gold Stock Indicator Points Up
Today at 12:10pm EST, our gold stock indicator signaled that gold stocks were reasonably undervalued. This indication occurred just after the price of gold started a sharp rise in price today and just before gold stocks started to jump, as indicated in the intraday chart below:

As indicated in our Transaction Alert today (April 10, 2012), we bought Newmont Mining (NEM) as a “long term” holding in gold stocks. Our view of the long term is predicated on the percentage gain that is achieved and the alternative stocks that appear undervalued at the time. If the gain has been exceptional in a reasonable period of time and there are better values elsewhere then we may jump ship.
Despite our confidence in the Gold Stock Indicator, we believe that it is necessary to have reasonable expectations for any of the stocks suggested. This means carefully examine the downside risk. As an example, it took Agnico-Eagle (AEM) a little over 1 year to achieve +174%. In that time, AEM traded in a narrow range for a majority of the time and fell almost -30% before reaching such astronomical heights.
Our purchase of the Direxion Daily Gold Miners Bull 3X Shares (NUGT) is strictly a speculation which we will sell soon after it has achieved a gain of +7.5%. Our examination of 3x gold ETFs (DUST and NUGT) is that a gain of +7.5% is achieved 85% of the time, based on 80 transactions initiated by our Gold Stock Indicator since 1983. Direxion’s DUST and NUGT ETFs are strictly for speculators (short-term) and should not be entered into for investment (long-term) purposes. You have been warned.
Our last Gold Stock Indicator signal can be found here: Gold Stock Indicator Points Down
Posted in AEM, DUST, Gold Stock Indicator, NUGT
Gold Stocks to Consider Based on Our Indicator
In light of our Gold Stock Indicator approaching the long term buy signal (found here), we have decided to go over the gold stocks that pay a dividend and are near their respective 52-week lows. In this review, we’re going to cover Agnico-Eagle Mines Ltd. (AEM) and Gold Fields Ltd. (GFI). When, and if, the Gold Stock Indicator actually reaches the long term buy indication it will be posted to our site. The stocks that we cover here are for you to do additional due diligence before taking any action.
Agnico-Eagle Mines Ltd. (AEM) closed at $32.37 on Thursday April 5, 2012. Agnico-Eagle is currently operating at an annual loss of -$3.36 according to Yahoo!Finance. Contributing factors to Agnico-Eagle’s decline in price over the last year has been problems with the operation of their mines.
As described in many of our previous articles, Edson Gould’s Altimeter is based on the stock’s price relative to the actual dividend paid. The Altimeter is a critical real-time assessment of value based on the company’s dividend. Below is the altimeter for Agnico-Eagle:

In our assessment of Agnico-Eagle, we have compared the current level of the Altimeter at 161.85 and compared it to other times when Agnico-Eagle has trade at the same relative level, or below, and traded up to 400 on the indicator. In the case of Agnico-Eagle there were two periods, before the bull market in gold stocks began, that the stock was selling at a low and was a great buy (based on the altimeter). In the period from November 2, 1990 to July 3, 1993, Agnico-Eagle rose +174% and in the period from August 25, 1998 to October 4, 1999 rose +157%.
Since the gold bull market began, the only other time that Agnico-Eagle was selling below 161.85 and subsequently traded up to the 400 level was the period from October 21, 2008 to October 6, 2010 for a gain of 103%, this far exceeded the gains of the SPDR Gold Shares (GLD) over the exact same period of time.
Next in our review is Gold Fields Ltd. (GFI). Gold Fields sports trailing earnings of $1.22 in the last twelve months and a dividend of $0.61 with a dividend yield of 4.70%. Yahoo!Finance indicates that Gold Fields operates “in South Africa, Peru, Ghana, and Australia.” Based on the majority of countries that Gold Fields operates, there is some political risk to this investment. However, Gold Fields has exhibited amazing consistency in the Altimeter below:

Presently, Gold Fields is trading at the Altimeter level of 42.38. The chart depicts the times when GFI was bought at the 42.38 level and sold whenever the Altimeter reached 100. The results are amazing and provide clear evidence on how gold stocks can outperform the price of gold when combining Edson Gould’s Altimeter with our Gold Stock Indicator.
Our approach to buying these stocks is to purchase in two stages, once at, or near, current levels and a second time only if the stocks fall -20% below the initial purchase price. As an example, if we have $10,000 that we’d like to invest then we buy $5,000 now and hold the remaining funds unless/until the stock declines by -20%. We’re basically hedging with cash if we’re wrong. If we’re right about our first investment (the stock price rises) then we can use the cash to buy another stock near a new low.
Before bothering with the first of many gold stocks that we’ll be covering based on our Gold Stock Indicator, please review the following questions and answers:
-
Is there downside risk to taking positions in gold stocks at this time? Yes, price declines can reach as much as -50% within the first two months of the purchase.
-
Are you comfortable with declines of -50% or more? If not, then don’t bother with these stocks at this time. If you’re wondering about the logic of recommending anything that might decline by as much as –50% then please read our view on the topic (found here).
-
Could these stocks have been held for the “long-term?” Ideally, yes, however, we believe that history is not on the side of gold stocks relative to the price of gold as we described in greater detail in our article titled “A Strategy is Needed For Lagging Gold Stocks”.
We believe that Edson Gould’s Altimeter, when revealing consistent relative values, yields highly favorable results. While we always seek to purchases at a relative low, we always set a target for selling at higher levels rather than “holding for the long term.” Our analysis could change if the stocks mentioned above dramatically increase or decrease their dividend.
Posted in AEM, Altimeter, Edson Gould, GFI, Gold Stock Indicator