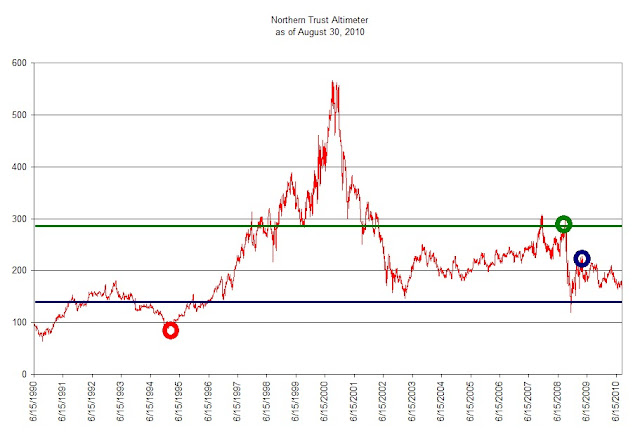
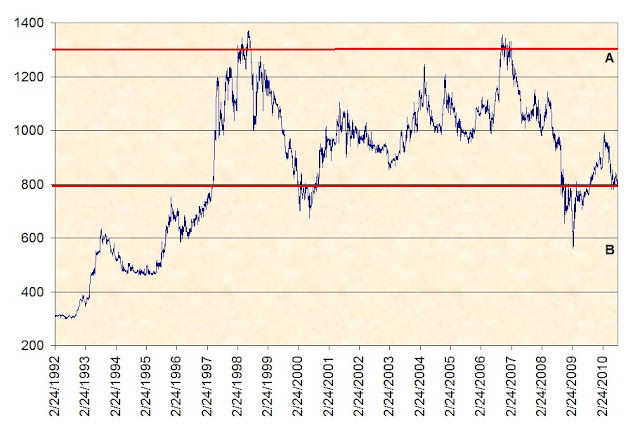
“Such a narrow fluctuation, to the experienced student of the averages, may be as significant as a sharp movement in either direction.”Rhea, Robert. The Dow Theory. Barron’s (1932). page 82.
-
Topics
Archives
-
-
Recent Posts
-
-
-
-
“Such a narrow fluctuation, to the experienced student of the averages, may be as significant as a sharp movement in either direction.”Rhea, Robert. The Dow Theory. Barron’s (1932). page 82.
“What we should have done is wait one full year after the cut, or lack of an increase, to determine the viability of the company. Keep in mind that a cut in the dividend isn’t a death sentence. In fact, cutting the dividend might be the best management move to make. However, current shareholders of the company might abandon the stock if they have a policy to hold stocks with a steady dividend (as we advise investors to do.)”
Posted in Northern Trust, NTRS, Transatlantic Holdings, TRH, Wesco Financial, wsc
Tagged members
| FP Symbol | Yahoo Symbol | Name | Price | % from Low |
| ESI | ESI.TO | ENSIGN ENERGY SERVICES INC. | $11.70 | 2.81% |
| IMO | IMO.TO | IMPERIAL OIL | $39.56 | 4.79% |
| RBA | RBA.TO | RITCHIE BROS AUCTIONEERS INC. | $19.80 | 9.39% |
| GWO | GWO.TO | GREAT-WEST LIFECO INC | $25.35 | 10.17% |
| IGM | IGM.TO | IGM FINANCIAL INC. | $40.54 | 10.43% |
| POW | POW.TO | POWER CORP CDA | $27.59 | 10.45% |
| TLM | TLM.TO | TALISMAN ENERGY INC. | $17.45 | 11.08% |
| PWF | PWF.TO | POWER FINANCIAL CORP. | $29.79 | 11.36% |
| CTC.A | CTC-A.TO | CANADIAN TIRE CORP LTD CL A NV | $56.83 | 11.74% |
| CNQ | CNQ.TO | CDN NATURAL RES | $35.42 | 13.34% |
Watch List Summary
“The Fund’s annual turnover ratio has generally averaged less than 25%, implying an average hold period of slightly greater than four years for an investment. This has led to a disproportionately high level of long-term versus short-term capital gains distributions, a tax benefit for you.”
“The [fund’s] asset sales reflected any one of the following: the current price level was ahead of the stock’s fundamentals, a better investment was available, or the particular holding was becoming too large a percentage of the portfolio. We eliminated two holdings, Quanex Corporation and Oregon Steel Mills, Inc."
“Countrywide Credit Corporation, Ross Stores, Inc. and Rouge Steel Company were added. Countrywide is the largest U.S. mortgage banker. Its share price had fallen sharply due to investor fears of the effect that rising interest rates and price competition would have on its profitability. Because these risks were widely known, we believe the stock price had already substantially discounted them.”
“Ross Stores is a leading discount clothing retailer with almost 50% of its stores located in California. Its heavy California exposure, good profitability and low valuation characteristics were attractive to us.”
Best Regards,
Touc and Art
Posted in Book giveaway
Second on the list is Intel (INTC). After cutting their sales and margin forecast down on Friday, stock rose 1%. Could the negative news be priced in? Only time will tell. Intel is trading at 11x trailing earnings. Compared that to its 5 years average of 21x, it could be a bargain. Analyst will have a weekend full of downward revision so we expect little more pressure next week. But given the stock is yielding 3.4% compared to the 5 years average yield of 2.3%, the risk/reward is more attractive now. Both JNJ and INTC have payout ratio below 50%.
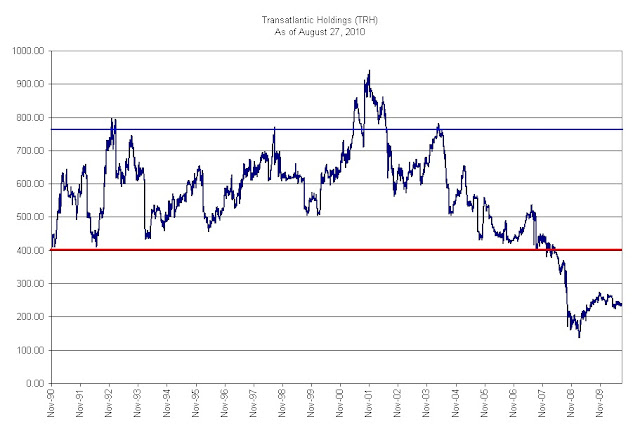
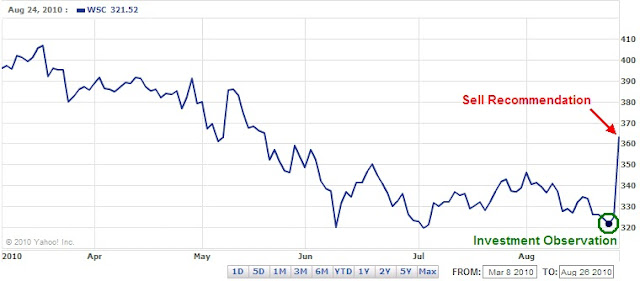
Our Investment Observation of Wesco Financial (WSC) on Tuesday August 24th was quickly verifed as being undervalued by Warren Buffett's offer to buy the remaining portion that he didn't already own on Thursday August 26th. We were able to provide a new Investment Observation of Transatlantic Holdings (TRH). With Transatlantic Holdings selling below book value, median price-to-earnings and dividend increases every year since going public, we believe TRH is a great alternative to Wesco Financial. In addition to TRH, we are working on a company which we believe will be able to retain its value far into the future.
| Symbol | Name | Price | % Yr Low | P/E | EPS (ttm) | Div/Shr | Yield | Payout Ratio |
| JNJ | Johnson & Johnson | 57.60 | 1.30% | 11.90 | 4.84 | 2.16 | 3.75% | 45% |
| INTC | Intel Corp. | 18.37 | 1.38% | 11.00 | 1.67 | 0.63 | 3.43% | 38% |
| GD | General Dynamics Corp. | 57.37 | 1.95% | 9.18 | 6.25 | 1.68 | 2.93% | 27% |
| PBI | Pitney Bowes Inc | 19.61 | 2.14% | 11.88 | 1.65 | 1.46 | 7.45% | 88% |
| SVU | SUPERVALU INC | 10.19 | 2.31% | 6.25 | 1.63 | 0.35 | 3.43% | 21% |
| HRB | H&R Block, Inc. | 13.59 | 2.64% | 9.50 | 1.43 | 0.60 | 4.42% | 42% |
| CSL | Carlisle Companies Inc. | 29.50 | 2.68% | 12.66 | 2.33 | 0.68 | 2.31% | 29% |
| UVV | Universal Corp. | 36.47 | 2.70% | 7.18 | 5.08 | 1.88 | 5.15% | 37% |
| XRAY | DENTSPLY International Inc. | 28.86 | 2.70% | 15.60 | 1.85 | 0.20 | 0.69% | 11% |
| WFSL | Washington Federal, Inc. | 14.43 | 2.78% | 13.74 | 1.05 | 0.20 | 1.39% | 19% |
| DNB | Dun & Bradstreet Corp. | 67.37 | 2.85% | 14.49 | 4.65 | 1.40 | 2.08% | 30% |
| UMBF | UMB Financial Corp. | 33.48 | 2.86% | 13.95 | 2.40 | 0.74 | 2.21% | 31% |
| PAYX | Paychex, Inc. | 25.37 | 2.92% | 19.22 | 1.32 | 1.24 | 4.89% | 94% |
| BEC | Beckman Coulter, Inc. | 45.84 | 3.24% | 21.83 | 2.10 | 0.72 | 1.57% | 34% |
| HSC | Harsco Corp. | 20.74 | 3.49% | 17.14 | 1.21 | 0.82 | 3.95% | 68% |
| ALL | Allstate Corp. | 27.99 | 3.51% | 15.13 | 1.85 | 0.80 | 2.86% | 43% |
| NTRS | Northern Trust Corp. | 47.05 | 3.52% | 15.43 | 3.05 | 1.12 | 2.38% | 37% |
| EV | Eaton Vance Corp. | 26.93 | 3.74% | 19.24 | 1.40 | 0.64 | 2.38% | 46% |
| ITW | Illinois Tool Works, Inc. | 41.85 | 3.77% | 13.86 | 3.02 | 1.36 | 3.25% | 45% |
| NFG | National Fuel Gas Co. | 44.46 | 3.81% | 17.03 | 2.61 | 1.38 | 3.10% | 53% |
| WAG | Walgreen Co. | 27.32 | 4.04% | 13.13 | 2.08 | 0.70 | 2.56% | 34% |
| WFC | Wells Fargo & Co. | 24.00 | 4.26% | 14.46 | 1.66 | 0.20 | 0.83% | 12% |
| BBT | BB&T Corp. | 22.72 | 4.51% | 21.43 | 1.06 | 0.60 | 2.64% | 57% |
| OMI | Owens & Minor, Inc. | 26.68 | 4.55% | 13.54 | 1.97 | 0.71 | 2.66% | 36% |
| FRS | Frisch's Restaurants, Inc | 18.92 | 4.59% | 9.80 | 1.93 | 0.52 | 2.75% | 27% |
| CWT | California Water Service Group | 35.42 | 4.76% | 19.15 | 1.85 | 1.19 | 3.36% | 64% |
| WST | West Pharmaceutical Services, Inc. | 34.33 | 4.82% | 14.99 | 2.29 | 0.64 | 1.86% | 28% |
| MLM | Martin Marietta Materials, Inc. | 75.16 | 5.12% | 41.76 | 1.80 | 1.60 | 2.13% | 89% |
| USB | U.S. BanCorp. | 21.66 | 5.15% | 15.58 | 1.39 | 0.20 | 0.92% | 14% |
| MSA | Mine Safety Appliances Co | 23.57 | 5.22% | 21.04 | 1.12 | 1.00 | 4.24% | 89% |
| BANF | BancFirst Corp. | 36.49 | 5.28% | 14.42 | 2.53 | 0.92 | 2.52% | 36% |
| FFIN | First Financial Bankshares, Inc. | 45.85 | 5.28% | 17.57 | 2.61 | 1.36 | 2.97% | 52% |
| BDX | Becton, Dickinson and Co. | 69.72 | 5.32% | 13.64 | 5.11 | 1.48 | 2.12% | 29% |
| BCR | CR Bard, Inc. | 77.98 | 5.39% | 15.88 | 4.91 | 0.72 | 0.92% | 15% |
| CL | Colgate-Palmolive Co. | 74.25 | 5.39% | 17.72 | 4.19 | 2.12 | 2.86% | 51% |
| MDT | Medtronic, Inc. | 32.52 | 5.58% | 11.66 | 2.79 | 0.90 | 2.77% | 32% |
| FII | Federated Investors Inc | 21.13 | 5.60% | 11.06 | 1.91 | 0.96 | 4.54% | 50% |
| FUL | HB Fuller Company | 19.61 | 6.17% | 10.77 | 1.82 | 0.28 | 1.43% | 15% |
| TROW | T. Rowe Price Group, Inc. | 45.24 | 6.37% | 20.20 | 2.24 | 1.08 | 2.39% | 48% |
| TR | Tootsie Roll Industries Inc | 23.97 | 3.45% | 26.34 | 0.91 | 0.32 | 1.34% | 35% |
| WMT | Wal-Mart Stores, Inc. | 51.00 | 6.76% | 13.11 | 3.89 | 1.21 | 2.37% | 31% |
| LLY | Eli Lilly & Co. | 34.20 | 6.81% | 8.47 | 4.04 | 1.96 | 5.73% | 49% |
| XOM | Exxon Mobil Corp. | 59.80 | 6.90% | 11.54 | 5.18 | 1.76 | 2.94% | 34% |
| HGIC | Harleysville Group Inc. | 32.13 | 6.92% | 12.12 | 2.65 | 1.44 | 4.48% | 54% |
| UFPI | Universal Forest Products, Inc. | 28.18 | 7.15% | 22.91 | 1.23 | 0.40 | 1.42% | 33% |
| SBSI | Southside Bancshares, Inc. | 18.65 | 7.24% | 7.06 | 2.64 | 0.68 | 3.65% | 26% |
| HCC | HCC Insurance Holdings, Inc. | 25.59 | 7.30% | 8.79 | 2.91 | 0.54 | 2.11% | 19% |
| SEIC | SEI Investments Company | 18.02 | 7.52% | 16.38 | 1.10 | 0.20 | 1.11% | 18% |
| LM | Legg Mason, Inc. | 25.84 | 7.67% | 20.35 | 1.27 | 0.16 | 0.62% | 13% |
| HIG | Hartford Financial Services Group | 20.32 | 7.74% | 70.07 | 0.29 | 0.20 | 0.98% | 69% |
| RLI | RLI Corp. | 53.21 | 7.87% | 9.47 | 5.62 | 1.16 | 2.18% | 21% |
| SYK | Stryker Corp. | 44.00 | 7.90% | 14.97 | 2.94 | 0.60 | 1.36% | 20% |
| GS | Goldman Sachs Group, Inc. | 139.75 | 7.92% | 7.05 | 19.82 | 1.40 | 1.00% | 7% |
| AROW | Arrow Financial Corp. | 23.70 | 8.07% | 12.22 | 1.94 | 1.00 | 4.22% | 52% |
| CBSH | Commerce Bancshares, Inc. | 36.56 | 8.20% | 14.86 | 2.46 | 0.94 | 2.57% | 38% |
| IBM | International Business Machines | 124.73 | 8.32% | 11.79 | 10.58 | 2.60 | 2.08% | 25% |
| SFNC | Simmons First National Corp. | 26.29 | 8.73% | 15.37 | 1.71 | 0.76 | 2.89% | 44% |
| BRC | Brady Corp. | 26.34 | 8.75% | 17.44 | 1.51 | 0.70 | 2.66% | 46% |
| AWR | American States Water Co. | 33.94 | 8.78% | 20.82 | 1.63 | 1.04 | 3.06% | 64% |
| LEG | Leggett & Platt, Inc. | 19.48 | 8.89% | 16.23 | 1.20 | 1.08 | 5.54% | 90% |
| VFC | VF Corp. | 73.88 | 9.02% | 14.75 | 5.01 | 2.40 | 3.25% | 48% |
| TRMK | Trustmark Corp. | 19.74 | 9.24% | 14.10 | 1.40 | 0.92 | 4.66% | 66% |
| EGN | Energen Corp. | 43.97 | 9.24% | 11.39 | 3.86 | 0.52 | 1.18% | 13% |
| LANC | Lancaster Colony Corp. | 47.35 | 9.40% | 11.61 | 4.08 | 1.20 | 2.53% | 29% |
| TMP | Tompkins Financial Corp. | 37.94 | 9.51% | 12.01 | 3.16 | 1.36 | 3.58% | 43% |
| RNST | Renasant Corp. | 14.07 | 9.84% | 19.01 | 0.74 | 0.68 | 4.83% | 92% |
| TRH | Transatlantic Holdings, Inc. | 48.52 | 10.07% | 7.73 | 6.28 | 0.84 | 1.73% | 13% |
| CAG | ConAgra Foods, Inc. | 21.74 | 10.13% | 13.42 | 1.62 | 0.80 | 3.68% | 49% |
| MDU | MDU Resources Group Inc. | 18.85 | 10.17% | 13.86 | 1.36 | 0.63 | 3.34% | 46% |
| LOW | Lowe's Companies Inc | 21.10 | 10.18% | 16.48 | 1.28 | 0.44 | 2.09% | 34% |
| FFIC | Flushing Financial Corp. | 11.21 | 10.23% | 11.56 | 0.97 | 0.52 | 4.64% | 54% |
| RPM | RPM International Inc. | 17.25 | 10.15% | 12.41 | 1.39 | 0.82 | 4.75% | 59% |
| 72 Companies |
||||||||
We excluded companies that has no earning and payout ratio in excess of 100%. Stocks that appear on our watch lists are not recommendations to buy. Instead, they are the starting point for doing your research and determining the best company to buy. Ideally, a stock that is purchased from this list is done after a considerable decline in the price and extensive due diligence.
Companies that show up on our Watch Lists could be considered the equivalent of the bargain bin of high quality blue chip stocks. Because these companies have increased their dividends every year for at least 10 years in a row or are part of the Nasdaq 100 and within 20% of their respective 52-week low, you know that you’re not overpaying for a company that has demonstrated profitability and the ability to rebound from challenging times.
| Symbol | Company | Price | % above low | Yield | Ex-date | |
| MYE | Myers Industries, Inc. | $6.40 | 1.59% | 3.90% | 9/1/2010 | |
| ANAT | American National Insurance | $77.00 | 1.77% | 4.00% | 9/1/2010 | |
| BAC | Bank of America Corp | $12.64 | 1.85% | 0.30% | 9/1/2010 | |
| IMO | Imperial Oil Limited | $37.25 | 6.28% | 1.10% | 9/1/2010 | |
| TRH | Transatlantic Holdings | $48.52 | 10.07% | 1.70% | 9/1/2010 | |
| SU | Suncor Energy | $31.10 | 12.48% | 1.20% | 9/1/2010 | |
| PEP | Pepsico, Inc. | $64.12 | 15.14% | 3.00% | 9/1/2010 | |
| CCBG | Capital City Bank Group | $11.43 | 6.23% | 3.60% | 9/1/2010 | |
| WRI | Weingarten Realty Investors | $20.31 | 15.07% | 5.20% | 9/3/2010 | |
| BDX | Becton, Dickinson | $69.72 | 5.32% | 2.10% | 9/7/2010 | |
| CBSH | Commerce Bancshares | $36.56 | 8.20% | 2.60% | 9/7/2010 | |
| MDU | MDU Resources Group | $18.85 | 10.17% | 3.40% | 9/7/2010 | |
| FFIC | Flushing Financial | $11.21 | 10.23% | 4.60% | 9/7/2010 | |
| UVSP | Univest Corporation of Penn | $16.78 | 10.83% | 4.90% | 9/7/2010 | |
| UMBF | UMB Financial Corp | $33.48 | 2.86% | 2.20% | 9/8/2010 | |
| HRB | H&R Block, Inc. | $13.59 | 3.03% | 4.50% | 9/8/2010 | |
| NTRS | Northern Trust Corp | $47.05 | 3.52% | 2.40% | 9/8/2010 | |
| VFC | V.F. Corp | $73.88 | 9.02% | 3.20% | 9/8/2010 | |
| LANC | Lancaster Colony Corp | $47.35 | 9.40% | 2.60% | 9/8/2010 | |
| KMB | Kimberly-Clark Corp | $64.46 | 12.89% | 4.10% | 9/8/2010 | |
| JCI | Johnson Controls, Inc | $27.24 | 15.47% | 1.90% | 9/8/2010 | |
| STFC | State Auto Financial Corp | $14.05 | 4.85% | 4.30% | 9/8/2010 | |
| TROW | T. Rowe Price Group, Inc. | $45.24 | 6.37% | 2.40% | 9/8/2010 | |
| SUBK | Suffolk Bancorp | $24.34 | 3.00% | 3.60% | 9/9/2010 | |
| IRET | Investors Real Estate Trust | $8.24 | 3.39% | 8.30% | 9/9/2010 | |
| FFIN | First Financial Bankshares, Inc | $45.85 | 5.28% | 3.00% | 9/9/2010 | |
| SFNC | Simmons First National Corp | $26.29 | 8.73% | 3.00% | 9/9/2010 | |
| THFF | First Financial Corp | $28.21 | 12.30% | 3.30% | 9/9/2010 | |
| FSS | Federal Signal Corp | $5.13 | 4.48% | 4.70% | 9/10/2010 | |
| UHT | Universal Health Realty Income | $32.25 | 9.25% | 7.60% | 9/12/2010 | |
| HI | Hillenbrand Inc | $19.99 | 12.30% | 3.70% | 9/12/2010 | |
| TDS | Telephone and Data Systems | $30.77 | 19.68% | 1.50% | 9/12/2010 | |
| BXS | BancorpSouth, Inc. | $12.86 | 3.63% | 6.90% | 9/13/2010 | |
| OMI | Owens & Minor, Inc. | $26.68 | 4.55% | 2.70% | 9/13/2010 | |
| HGIC | Harleysville Group Inc. | $32.13 | 6.92% | 4.60% | 9/13/2010 | |
| GMT | GATX Corp | $27.39 | 7.83% | 4.20% | 9/13/2010 | |
| LEG | Leggett & Platt, Inc | $19.48 | 8.89% | 5.60% | 9/13/2010 | |
| NJR | NewJersey Resources Corp | $38.00 | 13.47% | 3.70% | 9/13/2010 | |
| RNR | RenaissanceRe Holdings Ltd. | $57.52 | 13.99% | 1.70% | 9/13/2010 | |
| KO | Coca-Cola Co | $56.16 | 16.08% | 3.20% | 9/13/2010 | |
| MRK | Merck & Company, Inc. | $35.00 | 16.90% | 4.40% | 9/13/2010 | |
| UGI | UGI Corp | $27.53 | 18.77% | 3.60% | 9/13/2010 | |
| CTBI | Community Trust Bancorp | $26.46 | 19.46% | 4.70% | 9/13/2010 | |
| TSS | Total System Services | $14.55 | 8.50% | 2.00% | 9/13/2010 | |
| RNST | Renasant Corp | $14.07 | 9.84% | 5.00% | 9/13/2010 | |
| NGG | National Grid Transco | $42.89 | 16.80% | 8.50% | 9/13/2010 | |
| FDX | FedEx Corp | $80.46 | 18.22% | 0.60% | 9/13/2010 | |
| MCY | Mercury General Corp | $39.27 | 10.84% | 6.10% | 9/14/2010 | |
| FNF | Fidelity National Financial | $14.70 | 16.67% | 4.90% | 9/14/2010 | |
| EGP | EastGroup Properties, Inc. | $35.07 | 5.92% | 5.90% | 9/14/2010 | |
| FRS | Frisch's Restaurants, Inc. | $18.92 | 4.59% | 2.70% | 9/15/2010 | |
| GE | General Electric | $14.71 | 12.89% | 3.30% | 9/16/2010 | |
| ECL | Ecolab Inc. | $47.62 | 17.12% | 1.30% | 9/17/2010 | |
| SEIC | SEI Investments | $18.02 | 7.52% | 1.10% | 9/19/2010 | |
| TMX | Telefonos de Mexico | $14.06 | 8.15% | 5.50% | 9/20/2010 | |
| CINF | Cincinnati Financial | $27.22 | 11.06% | 5.90% | 9/20/2010 | |
| TR | Tootsie Roll Industries | $23.97 | 3.45% | 1.30% | 9/20/2010 | |
| SPLS | Staples, Inc. | $18.04 | 2.21% | 2.00% | 9/21/2010 | |
| OSBC | Old Second Bancorp, Inc. | $0.89 | 8.59% | 4.30% | 9/21/2010 | |
| CB | Chubb Corporation | $54.48 | 15.67% | 2.70% | 9/21/2010 | |
| CCH | COCA COLA HELLENIC | $23.02 | 16.56% | 1.50% | 9/21/2010 | |
| NFG | National Fuel Gas Co | $44.46 | 3.81% | 3.20% | 9/26/2010 | |
| CVBF | CVB Financial Corp | $6.88 | 4.08% | 4.70% | 9/26/2010 | |
| NUE | Nucor Corp | $37.25 | 4.31% | 3.90% | 9/26/2010 | |
| USB | U.S. Bancorp | $21.66 | 5.15% | 0.90% | 9/26/2010 | |
| BANF | BancFirst Corp | $36.49 | 5.28% | 2.60% | 9/26/2010 | |
| STLD | Steel Dynamics, Inc. | $13.83 | 7.31% | 2.20% | 9/26/2010 | |
| SYK | Stryker Corp | $44.00 | 7.90% | 1.40% | 9/26/2010 | |
| FBNC | First Bancorp | $12.94 | 8.38% | 2.50% | 9/26/2010 | |
| AXS | Axis Capital Holdings Limited | $31.28 | 14.92% | 2.70% | 9/26/2010 | |
| OFC | Corporate Office Properties | $36.54 | 15.01% | 4.30% | 9/26/2010 | |
| WPC | W.P. Carey Co. LLC | $28.42 | 15.11% | 7.10% | 9/26/2010 | |
| BEN | Franklin Resources, Inc. | $98.32 | 17.05% | 0.90% | 9/26/2010 | |
| XRAY | DENTSPLY Intl Inc. | $28.86 | 2.70% | 0.70% | 9/27/2010 | |
| SRE | Sempra Energy | $51.97 | 18.36% | 3.00% | 9/27/2010 | |
| CWCO | Consolidated Water Co. Ltd. | $9.71 | 4.75% | 3.10% | 9/27/2010 | |
| HCC | HCC Insurance Holdings, Inc. Co | $25.59 | 7.30% | 2.10% | 9/27/2010 | |
| STT | State Street Corp | $35.85 | 10.41% | 0.10% | 9/27/2010 | |
| LRY | Liberty Property Trust | $30.29 | 11.44% | 6.40% | 9/27/2010 | |
| ABM | ABM Industries Inc | $20.24 | 12.82% | 2.80% | 9/27/2010 | |
| APD | Air Products and Chemicals, Inc | $74.42 | 16.05% | 2.70% | 9/27/2010 | |
| ITW | Illinois Tool Works Inc. | $41.85 | 3.77% | 3.30% | 9/28/2010 | |
| RLI | RLI Corp | $53.21 | 7.87% | 2.20% | 9/28/2010 | |
| AJG | Arthur J. Gallagher & Co | $25.33 | 15.77% | 5.20% | 9/28/2010 | |
| WSH | Willis Group Holdings | $29.39 | 17.70% | 3.60% | 9/28/2010 | |
| CCJ | Cameco Corp | $24.69 | 19.28% | 1.10% | 9/28/2010 | |
| SYY | Sysco Corp | $28.05 | 15.72% | 3.50% | 9/28/2010 | |
| WWW | Wolverine World Wide | $26.22 | 11.53% | 1.70% | 9/29/2010 | |
| ACE | Ace Limited | $54.34 | 15.40% | 2.50% | 9/29/2010 | |
| SUP | Superior Industries Intl | $14.95 | 19.12% | 4.30% | 9/29/2010 |
Next Weekend:
“As a result of its reduced ownership percentage, the AIG Group is no longer considered a related party after March 15, 2010”
Transatlantic Holdings, 10-Q August 6, 2010 (PDF link), page 25, Accessed August 27, 2010.
According to GuruFocus.com, "Seth Klarman is a value investor and Portfolio Manager of the investment partnership The Baupost Group. Founded in 1983, The Baupost Group now manages $7 billion, and has averaged returns of nearly 20% annually since their inception. Seth Klarman is the author of the book "Margin of Safety" which sells for over $1000."
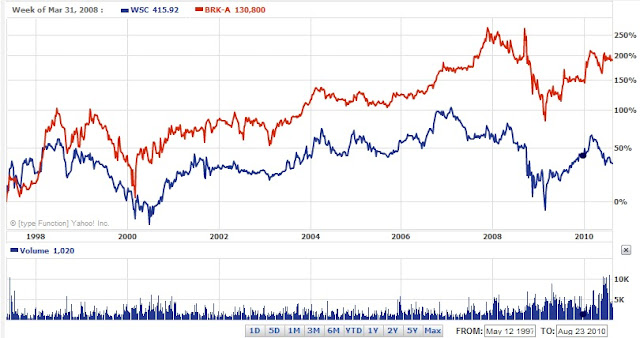
“Business and human quality in place at Wesco continues to be not nearly as good, all factors considered, as that in place at Berkshire Hathaway. Wesco is not an equally-good but smaller version of Berkshire Hathaway, better because its small size makes growth easier. Instead, each dollar of book value at Wesco continues plainly to provide much less intrinsic value than a similar dollar of book value at Berkshire Hathaway. Moreover, the 7 quality disparity in book value’s intrinsic merits has, in recent years, continued to widen in favor of Berkshire Hathaway. All that said, we make no attempt to appraise relative attractiveness for investment of Wesco versus Berkshire Hathaway stock at present stock-market quotations.”Munger, Charles T. Wesco Financial Corporation, Letter to Shareholders. February 25, 2009. Page 7. http://www.wescofinancial.com/cm2008.pdf (PDF). Accessed August 23, 2010.
Posted in BRK-A, investment observation, Wesco Financial, wsc
| FP Symbol | Yahoo Symbol | Name | Price | Pct from Yr Low |
| ESI | ESI.TO | ENSIGN ENERGY SERVICES INC. | $11.90 | 1.45% |
| IMO | IMO.TO | IMPERIAL OIL | $38.88 | 2.99% |
| POW | POW.TO | POWER CORP CDA | $26.03 | 3.50% |
| RBA | RBA.TO | RITCHIE BROS AUCTIONEERS INC. | $18.94 | 4.64% |
| PWF | PWF.TO | POWER FINANCIAL CORP. | $28.07 | 4.93% |
| GWO | GWO.TO | GREAT-WEST LIFECO INC | $24.50 | 6.48% |
| IGM | IGM.TO | IGM FINANCIAL INC. | $39.15 | 6.65% |
| CTC.A | CTC-A.TO | CANADIAN TIRE CORP | $54.81 | 7.77% |
| SU | SU.TO | SUNCOR ENERGY INC. | $32.68 | 9.26% |
| TLM | TLM.TO | TALISMAN ENERGY INC. | $17.25 | 9.80% |
| CNQ | CNQ.TO | CDN NATURAL RES | $33.75 | 11.29% |
| IAG | IAG.TO | INDUSTRIAL ALLIANCE | $30.40 | 11.85% |
| SNC | SNC.TO | SNC-LAVALIN SV | $46.65 | 12.17% |
| TRI | TRI.TO | THOMSON REUTERS | $36.80 | 12.47% |
| TD | TD.TO | TORONTO-DOMINION BANK | $70.52 | 15.29% |
| BNS | BNS.TO | BANK OF NOVA SCOTIA | $50.85 | 18.37% |
“The Fed has shifted to a tighter monetary policy. Interest rates are rising while inflation fears are growing. Will these factors lead to a possible recession in 1995? All are situations that most investors have faced before; therefore, they have created a longer period of investor uncertainty.”
“In this type of an environment, an individual stock’s characteristics tend to play a greater role than any one single event. Stock picking has a potentially higher probability of being a successful strategy and this is where we feel our strength lies.”
“Thank goodness we focus on individual stocks rather than trying to forecast the stock market. The former is far more rewarding and predictable.”
Comments Off on Robert Rodriguez Review: September 1994
Posted in recessions, Robert Rodriguez, Value Investing
Tagged members
"...it is noted that the majority of the companies that pay a dividend are related to the chip sector. Clustering of companies in a specific industry may indicate that the entire sector is undervalued."
"Our opinion is that the chip sector is ripe for mergers and acquisitions."
"...the fact that the purchase was done with cash is a testament to the fact that the chip manufacturers have abundant cash or are under priced and undervalued."
"Once it can be verified that companies in a specific industry are undervalued, you can rest assured that the mergers and acquisitions will begin. The fact that cash is being used to buy up companies is the final nail in the coffin on the theory of an undervalued sector."