A reader has asked, “if the bear market is confirmed, do you see a possible longer term test of the lows from ’08 [2009]?”
This question is predicated on the fact that the Dow Jones Industrial Average confirms the March low as the Transports plumbed both the June and March lows. Dow Theory relies heavily on confirmations of the two key indexes and without such there is no theory.
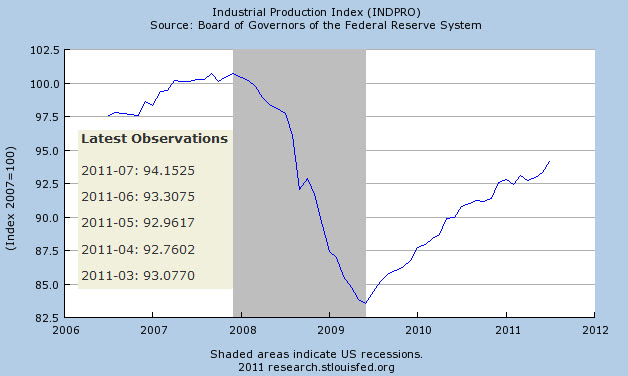
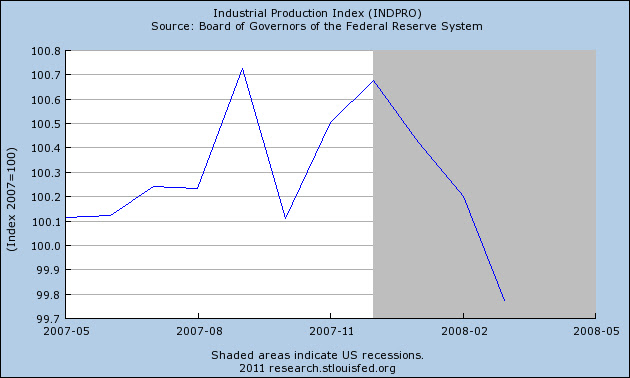
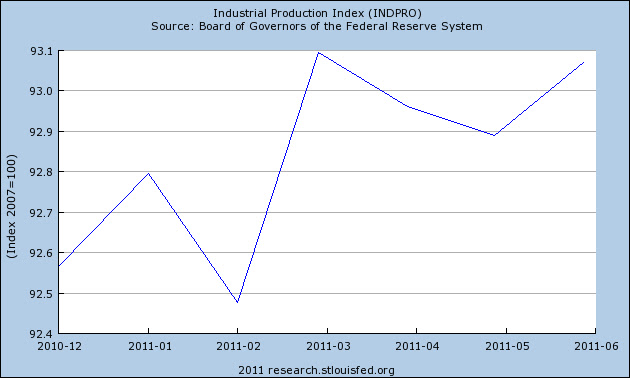
In addition, we’ve included Robert Rhea’s use of the Industrial Production Index as an indicator to watch for. If the Industrial Production Index exceeds the prior high while the Dow Industrials fail to decline below the March low then we’ll be in a no-man’s land, which would require that the Dow Industrials and Transports exceed the May high to get a change from the current bearish condition.
From a Dow Theory perspective, the downside target relies heavily on the concept of the 50% principle. Although mistakenly attributed to E. George Schaefer by Richard Russell, the 50% principle is derived from Charles H. Dow’s “great law of action and reaction.” Dow describes the “law” in the following manner:
“The market is always responsive to the great law of action and reaction. The longer the swing one way the longer it will be the other. One of the best general rules in speculation is the theory that reaction in an advance or a decline will be at least one-half of the primary movement [50% principle].
“The fact that the law is working through short ranges and long ones at the same time makes it impossible to tell with certainty what any particular swing may do; but for practical purposes, it is not infrequently wise to believe that when a stock has risen 10 points, and as a result of one or two short swings [double tops] does not go above the high point, but rather recedes from it, that it will gradually work off 4 or 5 points.[1]”
In another excerpt from Dow’s work, on the topic of the 50% principle, Dow says:
“It often happens that the secondary movement in a market amounts to 3/8 to ½ of the primary movement.[2]”
Again, Dow emphasis the concept of the 50% principle:
“Whoever will study our averages, as given in the Journal for years past, will see how uniformly periods of advance have been followed by periods of decline, amounting in a large proportion of cases to from one-third to one-half of the rise. [3]”
Finally, George Bishop, one of the greatest authors on the topic of Charles H. Dow, concludes:
“The law of action and reaction applies to both the general market and to individual stocks. This law states that the reaction to an advance or decline will approximate half the original movement.[4]”
As far as we know, the concept of applying what is commonly known as fibonacci numbers to indexes and individual stock prices was never published before Dow’s time and yet Dow is often quoted offering up such indications in the Wall Street Journal. So pervasively is the “law of action and reaction” applied to stocks that free online stock charting software allows an investor to automatically indicate the fibonacci numbers with little reference to Dow’s use of such parameters for declines or increases from a primary trend.
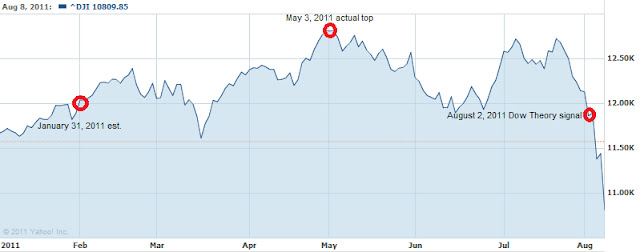
Based on the chart above, the 50% principle, or law of action and reaction, indicates that the next downside target at 38% is 10,417 and at 50% is 9,679. We first must reach these downside targets in order to then project the next stage of the decline.
While we believe that a fibonacci 5th wave is possible, meaning that the index could fall below the prior low of March 2009, we have seen that this type of action can be deceptive and costly to those who gamble big in the belief that the low of the 5th wave will be substantially lower than 6440. We covered this topic in an October 16, 2009 article titled “
Stock Market Projections”:
“The second type of market low is based on the premise that the Dow fulfills the Wave principle and falls below the upward trending line (red) to the old support level 8100 and then 6440. A true Wave move down to the old low would bring the market below 6440. However, the last time this was fulfilled, in the period from 1970 to 1974, the market only fell 8.5% below the previous low of 631.16 on the Dow Industrials in 1970. Additionally, the Industrials ran up from 631.16 in 1970 to 1051.70 in 1973, an increase of 118% of the previous peak. As more time passes I expect the index to fall to 5474 if we do manage to complete a Wave formation on the downside.”
The prior piece suggests that anything is possible between the point where we are and the point we expect to be going towards. Our personal investing experience as demonstrated by our claim of 40% gains (going long only) from January 2008 to August 2008 and closing out
2008 with +14% gains suggests that getting out of the market entirely is not exactly the solution to a bear market signal. Charles Dow has commented on this matter:
"Even in a bear market, this method of trading will usually be found safe, although the profits taken should be less because of the liability of weak spots breaking out and checking the general rise.[5]"
Finally, we do need to emphasis that our analysis of the market is subject to change as conditions change. After the very first Dow Theory bull market indication in July of 2009, we have had to continually update the status of the indexes based on all significant and indications. Since that time, we’ve issued more than ten confirmations that the trend was bullish.
Likewise, we will have to revisit our August 2nd call with relevant updates that support or change our view. For now, the market bias is definitely bearish and would require both the Dow Industrials and Dow Transports to exceed the previous May 2011 highs to change our current view.
Citations:
[1] Dow, Charles H. Wall Street Journal. October 19, 1900.
[1] Bishop, George. Charles H. Dow and the Dow Theory. Appleton-Century-Crofts. New York. 1960. page 119.
[1] Sether, Laura. Dow Theory Unplugged. W&A Publishing. 2009. page 112.
[2] Dow, Charles H. Wall Street Journal. January 22, 1901.
[2] Bishop, George. Charles H. Dow and the Dow Theory. Appleton-Century-Crofts. New York. 1960. page 120.
[2] Sether, Laura. Dow Theory Unplugged. W&A Publishing. 2009. page 117.
[3] Dow, Charles H. Wall Street Journal. January 30, 1901
[3] Bishop, George. Charles H. Dow and the Dow Theory. Appleton-Century-Crofts. New York. 1960. page 120.
[3] Sether, Laura. Dow Theory Unplugged. W&A Publishing. 2009. page 199.
[4] Bishop, George. Charles H. Dow and the Dow Theory. Appleton-Century-Crofts. New York. 1960. page 231.
[5] Schultz, Harry D. A Treasury of Wall Street Wisdom. Investors' Press. (New Jersey, 1966). p. 12. Additional commentary here.
Please consider donating to the New Low Observer. Thank you.