In the News: October 23, 2011

Please consider donating to the New Low Observer. Thank you.

Nasdaq 100 Watch List: October 21, 2011

Below are the Nasdaq 100 companies that are within 20% of their respective 52-week lows. Stocks that appear on our watch lists are not recommendations to buy. Instead, they are the starting point for doing your research and determining the best company to buy. Ideally, a stock that is purchased from this list is done after a considerable decline in the price and rigorous due diligence.
Symbol
Name
Trade
P/E
EPS
Yield
P/B
% from Low
BMC Software, Inc.
38.55
15.23
2.53
N/A
4.05
3.66%
First Solar, Inc.
53.77
9.17
5.87
N/A
1.23
5.70%
Ctrip.com
32.35
28.01
1.16
N/A
4.46
6.80%
Qiagen N.V.
13.39
24.35
0.55
N/A
1.17
7.38%
Netflix, Inc.
117.04
29.7
3.94
N/A
17.53
8.74%
Express Scripts, Inc.
39.14
16.03
2.44
N/A
10.26
9.67%
Mylan Inc.
18.04
19.76
0.91
N/A
1.91
11.56%
Teva Pharmaceutical
39.16
11.2
3.5
2.00%
1.45
11.89%
Life Technologies
39.66
20.41
1.94
N/A
1.49
12.35%
Research In Motion
22.77
4.16
5.48
N/A
1.17
13.06%
NetApp, Inc.
38.1
23.13
1.65
N/A
3.64
14.35%
VeriSign, Inc.
30.88
6.88
4.49
N/A
N/A
14.37%
Urban Outfitters, Inc.
25.07
16.97
1.48
N/A
2.86
14.53%
Paychex, Inc.
28.78
19.58
1.47
4.60%
6.66
14.57%
Microsoft Corporation
27.16
10.1
2.69
2.90%
3.97
14.84%
Vodafone Group Plc
28.01
11.77
2.38
7.00%
1.03
15.22%
Microchip Tech.
33.8
15.61
2.17
4.20%
3.35
15.36%
Lam Research
40.61
7.01
5.79
N/A
2.01
16.29%
Expeditors Int’l of Wash
45.64
26.08
1.75
1.10%
5.03
16.34%
Marvell Tech.
13.14
10.55
1.25
N/A
1.61
17.01%
Gilead Sciences
41.47
12.44
3.33
N/A
5.27
17.61%
CA Inc.
21.97
13.22
1.66
0.90%
1.86
18.03%
DENTSPLY Int’l
34.11
17.86
1.91
0.60%
2.32
18.07%
Henry Schein, Inc.
65.8
17.5
3.76
N/A
2.32
18.45%
DIRECTV
46.42
15.3
3.03
N/A
N/A
18.66%
Applied Materials,
11.69
8.06
1.45
2.80%
1.75
18.68%
Dell Inc.
15.24
8.14
1.87
N/A
3.31
19.34%
eBay Inc.
32.12
24.13
1.33
N/A
2.56
19.58%
Symantec
18.42
22.77
0.81
N/A
2.95
19.92%
Fiserv
58.47
19.18
3.05
N/A
2.65
19.94%
Watch List Summary
A stock that was on and off our radar in a flash was Akamai Technologies. Akamai Technologies (AKAM) was last on our Nasdaq 100 watch list August 12, 2011 (found here). Two months later, on October 3rd, Akamai closed at a 1-year low of $18.65. There are many reasons for AKAM’s price falling to a new low. Among other things, AKAM is under considerable competitive pressures, which some investors believe that the company has been slow to react to. However, every time AKAM reaches a new low, rumors abound about whether or not it will get acquired, as was the case 2 years ago. We believe that such rumors in 2009 is what helped those previously negative on the company to reconsider the merits of Akamai’s business model. Most recently it was rumored that Google was considering AKAM, although such rumors were dispelled very quickly.
Although Akamai has a lot of cash, potential growth in foreign markets, generally lower rate of customer turnover, which could contribute to the company’s growth going forward, we believe it is worth considering Akamai from a Dow Theory perspective for any upside potential that might remain for the company. According to Dow Theory, so far the average price paid by investors, as opposed to speculators, is $36.45. This indicates the point at which an investor, over the last year, considers to be the "fair value". This implies that the stock, at maximum could gain nearly 52% in due time. However, taking into account Charles H. Dow’s claim that in a bear markets, investors should only expect half of what would be considered “fair value” in a bull market, we think that in the next year Akamai could rise to the $30.15 level before faltering. We have acquired share of Akamai with the expectation that the stock will decline by at least 50%, at which point we will reconsider buying additional shares.
Watch List Performance Review
In our ongoing review of the Nasdaq 100 Watch List, we have taken the stocks from our list of October 23, 2009 (found here) and have checked their performance two years later. The companies on that list are provided below with the closing prices from October 23, 2009 to October 21, 2011.
-
-
2009
2011
change
SRCL
Stericycle
53.17
84.04
58.06%
GILD
Gilead
43.83
41.47
-5.38%
GENZ
Genzyme
54.5
76.25
39.91%
CEPH
Cephalon
54.02
81.49
50.85%
BIIB
Biogen
43.81
108.84
148.44%
-
-
-
Average change:
58.37%
-
-
-
-
-
^NDX
Nasdaq 100
1735.63
2306.29
32.88%

This is a particularly fascinating performance review because of the high performance of the stocks as compared to the Nasdaq 100 Index. On average, the stocks from October 23, 2009 list exceeded the Nasdaq 100 Index by 25.49%. Two of the companies have already been acquired (CEPH and GENZ) while SRCL and BIIB continue to outperform the Nasdaq 100 Index by a wide margin. The only stock that is severely lagging behind the index is Gilead Sciences (GILD) with a loss of -5.38% and a numbing -38.26% under-performance. Overall, we’re satisfied with the results of this watch list and encourage closer scrutiny of companies on our current list, there may be bargains to be had.

Please consider donating to the New Low Observer. Thank you.

In the News: October 16, 2011

Please consider donating to the New Low Observer. Thank you.

Dow Theory: Bullish Implications

This week the Dow Jones Industrial Average and Dow Jones Transportation Average provided indications that, according to Dow Theory, have bullish implications.  On October 14, 2011, the closing of the Industrials above 11,613.53 and the Transports above 4,684.44 suggests that the indexes will at least rise to the July highs and maybe even the April 2011 highs.
This bullish implication stands juxtapose to the bear market confirmation that was received when the Industrials and Transports simultaneously declined to new lows on October 3, 2011.  Our view is that we’re still in a cyclical bear market that cannot become a cyclical bull market until both indexes exceed the April and July highs.  To become a secular bull market, the Industrials and Transports need to go above their 2007 high.


Some would suggest that for anyone to wait until the indexes rise to the 2011 highs there would be a lot of missed investment opportunities.  However, as we’ve indicated many times in the past, we use Dow Theory signals as an allocation indicator.  During bull markets, we put more money to work and the opposite is true when there is a bear market indication.  There are few instances when we’re completely out of the market for an extended period of time based on a bear market indication, as demonstrated in our 2008 investment transactions.  Therefore, we have little concern for “missed” opportunities.


Additionally, although we got a bear market signal on August 2, 2011, which was 96 days after the April 29, 2011 peak in the Industrials, our portfolios were up for the year.  After reallocating our investment positions upon getting the bear signal, we were able to reinvest in quality companies, sometimes the same stocks, at significantly lower prices.


The coming market volatility will provide great opportunities for traders and allow investors a chance to cash out of otherwise undesirable positions and take profits.  Our expectation is that the Dow will go to the July 2011 highs before struggling at the May 2011 highs. Again, we’re still in a cyclical bear market until the Transports and Industrials exceed their respective 2011 highs.


Related article: A Lesson in Dow Theory published November 7, 2010
Please consider donating to the New Low Observer. Thank you.

NLO Dividend Watch List: October 14, 2011

The market rebounded nicely this week and pushed many companies out of their 52-week low range. Despite that, there are some great bargains to be had. There are 26 companies on this week's list.

Symbol Name Price % Yr Low P/E EPS Dividend Yield Payout Ratio
WAG Walgreen Co. 32.9 2.81% 11.19 2.94 0.90 2.74% 31%
PEP PepsiCo Inc. 62.09 4.79% 15.80 3.93 2.06 3.32% 52%
BDX Becton, Dickinson 73.85 4.83% 12.41 5.95 1.64 2.22% 28%
AROW Arrow Financial Corp.  22.73 5.28% 12.09 1.88 0.97 4.27% 52%
FRS Frisch's Restaurants 19.52 5.34% 10.44 1.87 0.64 3.28% 34%
SYY Sysco Corp. 26.52 5.70% 13.53 1.96 1.04 3.92% 53%
CFR Cullen/Frost Bankers 46.94 6.58% 13.30 3.53 1.84 3.92% 52%
T AT&T Inc 29.15 7.16% 8.47 3.44 1.72 5.90% 50%
BCR CR Bard, Inc. 86.81 7.41% 22.91 3.79 0.76 0.88% 20%
BOH Bank of Hawaii Corp. 37.79 7.88% 11.21 3.37 1.80 4.76% 53%
VNO Vornado Realty Trust 76.1 7.93% 16.99 4.48 2.76 3.63% 62%
TR Tootsie Roll Industries  24.79 7.97% 28.83 0.86 0.32 1.29% 37%
WST West Pharmaceutical 38.23 8.12% 20.78 1.84 0.72 1.88% 39%
ANAT American Nat'l Insur. 71.27 8.46% 11.80 6.04 3.08 4.32% 51%
TRV Travelers 50.65 8.64% 9.57 5.29 1.64 3.24% 31%
BRO Brown & Brown, Inc. 18.38 9.02% 16.71 1.10 0.32 1.74% 29%
CWT California Water Service 18.17 9.10% 18.73 0.97 0.62 3.41% 64%
MSEX Middlesex Water  18.06 9.18% 19.63 0.92 0.73 4.04% 79%
MDT Medtronic, Inc. 33 9.34% 11.50 2.87 0.97 2.94% 34%
CBSH Commerce Bancshares  36.39 9.51% 12.90 2.82 0.92 2.53% 33%
NTRS Northern Trust Corp.  36.75 9.67% 14.58 2.52 1.12 3.05% 44%
WFSL Washington Federal  13.37 10.04% 15.55 0.86 0.24 1.80% 28%
PRK Park National Corp. 53.93 10.06% 12.15 4.44 3.76 6.97% 85%
ALL Allstate Corp.   24.58 10.37% 23.41 1.05 0.84 3.42% 80%
UTX United Technologies Corp. 74.2 10.55% 14.38 5.16 1.92 2.59% 37%
NU Northeast Utilities 33.08 11.42% 13.96 2.37 1.10 3.33% 46%

Watch List Summary

Topping our list this week is Walgreen Co. (WAG). Walgreen Co. is currently yielding 2.74% with a conservative P/E ratio of 11. Earnings is expected to grow 11% through 2012. With the stock being so close to the one year low, it appears that the risk-reward may have turned in favor of the investor. We have bought a 10% position of WAG as of Friday October 14th with the expectation to purchase the exact same dollar amount when the price falls by 20% or more. Like moths to a flame, we're drawn to the compounding consistency of Walgreen as demonstrated in the performance of the stock against Apple (AAPL) since Apple's IPO in 1980. In the chart below, only recently has AAPL been able to exceed the total return of Walgreen but by a relatively narrow margin.

Right behind Walgreen Co. is the well known consumer name, Pepsi Co. (PEP). Pepsi Co. has been on our list for some time now so we'll have to see how much longer it would stay. Analysts expect Pepsi to grow its bottom line by 7% next year. Although times may be different, but we can't help but remind investors of Jeremy Siegel's seminal piece "The Nifty Fifty Revisited" (found here). In that piece, Siegel reviews the performance of the "Nifty Fifty" at their peak price in 1972 before their crash. Pepsi Co. (PEP), from the peak in 1972, produced an annualized return of 16.03% in the period from 1972 to 1995.

Becton, Dickinson (BDX) is now on our watch list after our first recommendation of the stock on May 4, 2009.  According to Edson Gould’s altimeter (chart below), BDX is now selling below the price paid by Warren Buffett relative to the dividend and subsequent dividend increases.  BDX has a dividend payout ratio of 28% which indicates that earnings could fall by 50% without imperiling the company’s ability to make good on their dividend.

Watch List Performance Review

In our ongoing review of the NLO Dividend Watch List, we have taken the top five stocks on our list from October 8, 2010 and have checked their performance one year later. The top five companies on that list can be seen in the table below.

Symbol Name 2010 Price 2011 Price % change
CL Colgate-Palmolive Co. 74.90 91.99 22.82%
CAG ConAgra Foods, Inc. 21.87 25.47 16.46%
NTRS Northern Trust Corp.  48.35 36.63 -24.24%
WST West Pharmaceutical 35.11 38.3 9.09%
BBT BB&T Corp. 23.58 22.36 -5.17%
Average 3.79%
DJI Dow Jones Industrial 11,062.78 11,573.34 4.62%
SPX S&P 500 1,176.19 1,215.65 3.35%

The performance of the top five from last year, at 3.79%, was between the Dow's 4.62% and the S&P 500's 3.35%.

Three of the top five stocks from last year performed above the level of the S&P 500 and Dow Jones Industrial Average.  Colgate-Palmolive (CL) cranked out a return of over 22% despite sporting a subpar dividend yield of 2.83%.  ConAgra managed to generate a return of 16% with a dividend yield of 4.21% at the time the list was generated.  Northern Trust (NTRS) got hammered with a decline of -24.24%.

Disclaimer:

On our current list, we excluded companies that have no earnings. Stocks that appear on our watch lists are not recommendations to buy. Instead, they are the starting point for doing your research and determining the best company to buy. Ideally, a stock that is purchased from this list is done after a considerable decline in the price and extensive due diligence. We suggest that readers use the March 2009 low (or the companies' most distressed level in the last 2 years) as the downside projection for investing. Our view is to embrace the worse case scenario prior to investing. A minimum of 50% decline or the November 2008 to March 2009 low, whichever is lower, would fit that description. It is important to place these companies on your own watch list so that when the opportunity arises, you can purchase them with a greater margin of safety. It is our expectation that, at the most, only 1/3 of the companies that are part of our list will outperform the market over a one-year period.

Please consider donating to the New Low Observer. Thank you.

Dexia: So What’s in a Name

In the last financial crisis, we came across a company named Cerberus Capital.  Those who started Cerberus Capital had to know the kind of connotation that would be invoked with a name based on a three-headed dog that guards the gates of the underworld from those who wished to escape.  For some, Cerberus Capital’s involvement in Chrysler and GMAC seemed inescapable for the U.S. government during their bailouts of the auto and banking industry. 

Currently, a Belgium bank named Dexia Group is attempting to find a way out of its financial problems.  Apparently, Dexia is holding an enormous amount of Greek debt that could possibly go bust.   Without a plan from France, Belgium and Luxembourg, Dexia threatens to bankrupt many towns and cities in France as well as depositors in Belgium and Luxembourg. 
Like Cerberus Capital, we wonder what is in the name.  So it should comes as no surprise when we looked up what the meaning of Dexia is.  Here are the Wikipedia definitions of what Dexia is:
Dexia is a genus of tachinid flies in the family Tachinidae. Most larvae are parasitoids of beetles (Scarabaeidae).”
Since the above definitions of Dexia was relatively obscure, we looked up what a parasitoid is.  Again, Wikipedia’s definition is as follows:
A parasitoid is an organism that spends a significant portion of its life history attached to or within a single host organism in a relationship that is in essence parasitic; unlike a true parasite, however, it ultimately sterilises or kills, and sometimes consumes, the host. Thus parasitoids are similar to typical parasites except in the more dire prognosis for the host.”
Cornell University’s Guide to Natural Enemies of North America defines parasitoids, in part, as:
Insect parasitoids have an immature life stage that develops on or within a single insect host, ultimately killing the host…”
We can only wonder if Dexia, the Belgium bank, will ultimately lead to killing the hosts, in this case France, Belgium, Luxembourg  or even the European Union as we know it.
More about Dexia from Bloomberg.com
Please consider donating to the New Low Observer. Thank you.

In the News: October 9, 2011

Europe on the Brink at The Atlantic
In Praise of Dumbphones at The Atlantic
Please consider donating to the New Low Observer. Thank you.

Nasdaq 100 Watch List: October 7, 2011

Below are the Nasdaq 100 companies that are within 10% of their respective 52-week lows. Stocks that appear on our watch lists are not recommendations to buy. Instead, they are the starting point for doing your research and determining the best company to buy. Ideally, a stock that is purchased from this list is done after a considerable decline in the price and rigorous due diligence.

Symbol Name Price P/E EPS Yield P/B % from Low
ILMN Illumina, Inc. 27.18 31.39 0.87 0 4.25 0.00%
QGEN Qiagen N.V. 12.65 23 0.55 0 1.21 0.16%
BMC BMC Software, Inc. 36.98 14.61 2.53 0 4.39 1.01%
LIFE Life Technologies Corp. 36.82 18.95 1.94 0 1.56 4.31%
TEVA Teva Pharmaceutical 36.75 10.51 3.5 2.10% 1.41 5.00%
FSLR First Solar, Inc. 59.74 10.18 5.87 0 1.52 7.29%
PAYX Paychex, Inc. 27.11 18.44 1.47 4.70% 6.3 7.92%
VOD Vodafone Group Plc 26.25 11.22 2.34 7.30% 1.01 7.98%
URBN Urban Outfitters, Inc. 23.29 15.77 1.48 0 2.91 8.48%
GOOG Google Inc. 515.12 18.58 27.72 0 3.19 8.90%
NFLX Netflix, Inc. 117.21 29.74 3.94 0 19.38 8.90%
CTXS Citrix Systems, Inc. 54.94 31.09 1.77 0 3.93 9.42%
FISV Fiserv, Inc. 53.38 17.51 3.05 0 2.46 9.50%
VRSN VeriSign, Inc. 29.69 6.62 4.49 0 N/A 9.96%
HSIC Henry Schein, Inc. 61.09 16.25 3.76 0 2.21 9.97%
Watch List Summary
It appears that Illumina (ILMN) has come full circle since last appearing on our Nasdaq 100 Watch List on December 19, 2009 (found here).  At the time, Illumina (ILMN) traded at $27.88.  The stock rose as high as $79.40.  In our September 23, 2011 article (found here), as Illumina crept back onto our watch list at $41.67, we said, “while ILMN is still nearly 50% above the December 19, 2009 price, the possibility exists that all the gains that were made could disappear in short order.  Between our last posting and now, ILMN has managed to lose all of the gains that were accrued from December 2009.  We’re now actively accumulating shares of ILMN with the expectation that the share price will decline by approximately 50% from the current level.
Pharmaceutical Product Development (PPDI) has announced that they have accepted an all cash offer of $33.25 per share by the Carlyle Group and Hellman & Friedman (article here).  Pharmaceutical Product Development (PPDI) was on our September 11, 2009 watch list (found here).  Of the four companies on that list, only one has not been bought out.  Cephalon (CEPH), Genzyme (GENZ) and now Pharmaceutical Product Development Inc. (PPDI) have been acquired.  Although we’re not unaccustomed to stocks on either of our Dividend or Nasdaq 100 watch lists being bought, this is the first time that 75% of the companies on a single list were acquired by another institution.  We’d like to offer up the holdout, Stericycle (SRCL), to anyone willing to help us accomplish a grand slam.
Watch List Performance Review
The following is a performance review of the Nasdaq 100 Watch List from October 18, 2010:

  •  Apollo Group, Inc. (APOL): +16.79%
  • Urban Outfitters, Inc. (URBN): -24.87%
  • FLIR Systems, Inc. (FLIR): +0.50%
  • Intel Corporation (INTC): +15.37%
  • Adobe Systems (ADBE): -9.97%
  • Nasdaq 100 (NDX): +5.01%
The performance of the five companies on the Nasdaq 100 list from last year underperformed the Nasdaq 100 by -5.45%.  Only two stocks, Apollo Group (APOL) and Intel (INTC) managed to eke out gains in the last year.  Apollo Group was a considerable surprise to us since we believed that the stock should have been dropped from the Nasdaq 100 at the time of the annual re-ranking of the index in December 2010.
Please consider donating to the New Low Observer. Thank you.

Slittare: Italy’s credit rating

On February 18, 2009, we wrote an article titled “When Paper Has No Value.” In that article, we highlighted West Germany’s $2 billion bailout of Italy in 1974 that was backed by the value of Italy’s gold holdings. Regarding the use of gold as collateral we said the following:
No nation wants to actually resort to this feature first, because as one nation dips its toes in the water all subsequent nations will follow in its path at ever higher gold prices. It is only the last nation in the pool, with sizable gold reserves, that benefits the most from using gold as collateral. The first nation in the pool becomes the sacrificial lamb. Unfortunately, desperate times call for desperate measures.”
We couldn’t help but notice that Moody’s credit rating for Italy was downgraded three notches on October 4, 2011 (found here). There are three primary reasons given for the downgrade of Italy’s debt:
(1) The material increase in long-term funding risks for euro area sovereigns with high levels of public debt, such as Italy, as a result of the sustained and non-cyclical erosion of confidence in the wholesale finance environment for euro sovereigns, due to the current sovereign debt crisis.
(2) The increased downside risks to economic growth due to macroeconomic structural weaknesses and a weakening global outlook.
(3) The implementation risks and time needed to achieve the government's fiscal consolidation targets to reverse the adverse trend observed in the public debt, due to economic and political uncertainties.
In Italian, the word slittare means to slide or to be postponed. This was the term that was used to describe Italy’s economic woes that led to the loan using gold as collateral in 1974. Depending on its usage, slittare encapsulates the problems faced by Italy today. The increase in long-term debt is the postponement of the inevitable and the increased downside risk to economic growth points to a further slide. The third issue mentioned by Moody’s, implementation risk, only adds to why the first and second reasons will only grow.
Like it was in 1974, Germany is currently in the position of having to buttress European nations as the “lender of last resort.” We’re wondering which nation will be the first to pledge their gold reserves as collateral in exchange for a loan to avoid collapse. It will be desperate times when a nation pledges their gold reserves for the purpose of a loan. However, when this does occur, it will set the ball in motion that will inexorably create a floor in the price of gold.

The Coming Precious Metals Dividend War

On September 9, 2009 we wrote an article titled “Silver Should be the Focus.” In that article, we cautioned readers to “be mindful of the coming competitive dividend war between precious metal companies. I remember one, now defunct, gold company that paid out their dividend in actual gold. These are all gimmicks to lure investors in at a time when the rule of the day should be ‘head to the exits.’
The first salvos of the coming war to attract investors to precious metal stocks have be initiated.In April 2011, Newmont Mining (NEM) started what they deemed … the industry's first and only dividend policy linked directly to the realized gold price…"Naturally, this isn’t the first time that gold linked dividends has taken place, but it sells really well to those unfamiliar with gold stocks and their dividend policies.On September 19, 2011, Newmont Mining (NEM) announced a further enhancement of their “first ever” gold linked dividend policy with the following changes:


The enhanced policy will continue to link the quarterly dividend rate to changes in the gold price but will also provide an additional step up of 7.5 cents per share when the Company's realized gold price for a quarter exceeds $1,700 per ounce and a further step up of 2.5 cents per share (10 cents in total compared to the existing policy) when the Company's realized gold price for a quarter exceeds $2,000. At average realized gold prices below $1,700 per ounce, the current dividend policy remains unchanged. Newmont's quarterly gold price-linked dividend payments are based on the Company's average realized gold price for the preceding quarter.”
Not to be outdone, Hecla Mining (HL) announced on September 20, 2011 that they would have a dividend that is linked to the price of silver.Hecla’s silver-linked dividend policy is as follows:


The initial quarterly dividend under the policy is expected to be $0.03 per share of common stock ($0.12 per year), if Hecla's average realized silver price for the third quarter is $40.00 per ounce. All dividends, including those in the third quarter, would increase or decrease by $0.01 per share ($0.04 annually) for each $5.00 per ounce incremental increase or decrease in the average realized silver price in the preceding quarter.”
Newmont Mining (NEM) and Hecla Mining (HL) are soon to be joined by a crowded field of precious metal companies that are going to progressively up the ante.It will soon be indistinguishable as to who has the most sensible dividend policy and who has a compounding “money” losing machine.The race to offer attractive dividend payments has help from an unexpected source.
Unlike past precious metal bull markets, gold and silver stocks have stiff competition for investment capital in the form of gold and silver ETFs.In fact, more money is being plowed into the combined gold and silver ETFs than the stocks that have actual claims on getting the metal out of the ground.This presents a challenge for precious metal stocks that would normally issue shares in acquisition of other gold companies or expand their operations.In order to get the share price up, a competitive environment of dividend increases will lead many companies to ruin in an effort to attract new investors.
As described in our 2009 recommendation silver, one gold or silver company is going to “jump the shark” and make their dividend payments in the actual metal.When that time comes, it will be fair warning to protect your positions, though this may be indistinguishable to ebullient gold bugs at the time.
The single best dividend policy that we’ve seen among gold stocks, was held by Homestake Mining [HM] as describe in our October 31, 2010 profile of Homestake (found here).By 1933, Homestake had a 53-year history of continuous dividend payments.Not surprisingly, Homestake was among the 2% of gold stocks that rose in value from 1924 to 1932 due, in part, to their amazing dividend policy.
Because we’re in the early stages of a gold bull market, there is little attention being paid to the quality of the dividend policy.Gold and silver linked dividend policies appear advantageous when the price of the commodity is going up.However, such a policy can imperil a poorly managed company as the average price declines.
The most effective antidote to becoming collateral damage in the coming dividend war will be to buy the gold and silver stocks that are members of the Philadelphia Gold and Silver Stock Index or the Amex Gold Bug Index.Ironically, institutional support, by being the member of an index, will allow gold and silver stocks to survive hard times where others will unnecessarily falter.
Please consider subscribing to the New Low Observer. Thank you.

In the News: October 2, 2011

NLO Dividend Watch List: September 30, 2011

The problems in Europe continue to plague the markets globally.  The S&P 500 rallied mid-week when it seemed that the bailout of Greece is coming.  Seemingly good news couldn't hold the market up and thus the selling continued from Wednesday through Friday.  The S&P closed down 0.44% for the week while the blue-chip, the Dow Industrial index, was actually up 1.3%.  Upon initial review, it could have been a flight to "quality" within the realm of stocks.  However, as a result of the sell off, our list swelled and we included only those companies within 5% of the 52-week low below. 
Symbol
Name
Price
% Yr Low
P/E
EPS
Dividend
Yield
Payout
FNFG
First Niagara Financial Group Inc. 
9.15
0.00%
13.66
0.67
0.64
6.99%
96%
EMR
Emerson Electric Co.
41.31
0.00%
12.75
3.24
1.38
3.34%
43%
GTY
Getty Realty Corp.
14.42
0.00%
8.69
1.66
1.00
6.93%
60%
NFG
National Fuel Gas Co.
48.68
0.02%
15.65
3.11
1.42
2.92%
46%
MMM
3M Co
71.79
0.11%
12.19
5.89
2.20
3.06%
37%
AOS
AO Smith Corp.
32.03
0.28%
9.56
3.35
0.64
2.00%
19%
UMBF
UMB Financial Corp. 
32.08
0.38%
13.04
2.46
0.78
2.43%
32%
WFSL
Washington Federal, Inc. 
12.74
0.39%
14.81
0.86
0.24
1.88%
28%
AVP
Avon Products, Inc.
19.6
0.51%
11.46
1.71
0.92
4.69%
54%
ATR
AptarGroup Inc.
44.67
0.61%
16.98
2.63
0.88
1.97%
33%
XRAY
DENTSPLY International Inc. 
30.69
0.92%
16.07
1.91
0.20
0.65%
10%
BMI
Badger Meter, Inc.
28.93
0.94%
16.44
1.76
0.64
2.21%
36%
AVY
Avery Dennison Corp.
25.08
0.97%
9.02
2.78
1.00
3.99%
36%
DNB
Dun & Bradstreet Corp.
61.26
1.36%
11.92
5.14
1.44
2.35%
28%
ADM
Archer Daniels Midland Co.
24.81
1.60%
7.93
3.13
0.64
2.58%
20%
ALB
Albemarle Corp.
40.4
1.60%
9.35
4.32
0.66
1.63%
15%
SYY
Sysco Corp.
25.9
1.65%
13.21
1.96
1.04
4.02%
53%
CYN
City National Corp.
37.76
1.70%
12.50
3.02
0.80
2.12%
26%
CAT
Caterpillar Inc.
73.84
1.71%
12.20
6.05
1.84
2.49%
30%
JCI
Johnson Controls Inc  
26.37
1.78%
11.77
2.24
0.64
2.43%
29%
UGI
UGI Corp.
26.27
1.78%
11.52
2.28
1.04
3.96%
46%
ITW
Illinois Tool Works, Inc.
41.6
1.91%
10.98
3.79
1.44
3.46%
38%
BXS
BanCorp.South Inc.
8.78
1.97%
18.68
0.47
0.04
0.46%
9%
EOG
EOG Resources, Inc.
71.01
2.10%
44.66
1.59
0.64
0.90%
40%
BEN
Franklin Resources, Inc.
95.64
2.20%
11.41
8.38
1.00
1.05%
12%
SON
Sonoco Products Co.
28.23
2.21%
14.19
1.99
1.16
4.11%
58%
BDX
Becton, Dickinson and Co.
73.32
2.25%
12.32
5.95
1.64
2.24%
28%
CATO
Cato Corp.
22.56
2.36%
10.30
2.19
0.92
4.08%
42%
HP
Helmerich & Payne, Inc.
40.6
2.39%
11.12
3.65
0.28
0.69%
8%
UVV
Universal Corp.
35.86
2.40%
6.87
5.22
1.92
5.35%
37%
APD
Air Products & Chemicals, Inc.
76.37
2.40%
14.22
5.37
2.32
3.04%
43%
VNO
Vornado Realty Trust
74.62
2.43%
16.66
4.48
2.76
3.70%
62%
DOV
Dover Corp.
46.6
2.60%
10.20
4.57
1.26
2.70%
28%
MUR
Murphy Oil Corporation
44.16
2.62%
8.96
4.93
1.10
2.49%
22%
WAG
Walgreen Co.
32.89
2.78%
11.19
2.94
0.90
2.74%
31%
FULT
Fulton Financial Corp. 
7.65
2.82%
11.42
0.67
0.20
2.61%
30%
CTBI
Community Trust BanCorp., Inc. 
23.29
2.87%
9.95
2.34
1.24
5.32%
53%
NUE
Nucor Corp.
31.64
2.99%
21.38
1.48
1.45
4.58%
98%
SBSI
Southside Bancshares, Inc. 
18.01
3.00%
8.00
2.25
0.72
4.00%
32%
AROW
Arrow Financial Corp. 
22.25
3.00%
11.84
1.88
0.97
4.36%
52%
TRMK
Trustmark Corp. 
18.15
3.01%
10.93
1.66
0.92
5.07%
55%
BOH
Bank of Hawaii Corp.
36.4
3.12%
10.80
3.37
1.80
4.95%
53%
BMS
Bemis Co Inc
29.31
3.17%
14.58
2.01
0.96
3.28%
48%
MSEX
Middlesex Water Company 
17.07
3.20%
18.55
0.92
0.73
4.28%
79%
EXPD
Expeditors International of Washington
40.55
3.23%
23.17
1.75
0.50
1.23%
29%
GE
General Electric Co
15.22
3.40%
11.98
1.27
0.60
3.94%
47%
GS
Goldman Sachs Group, Inc.  
94.55
3.45%
9.27
10.20
1.40
1.48%
14%
ARE
Alexandria Real Estate Equities, Inc.
61.39
3.47%
21.47
2.86
1.88
3.06%
66%
PPG
PPG Industries, Inc.
70.66
3.50%
11.15
6.34
2.28
3.23%
36%
WBS
Webster Financial Corp.
15.3
3.52%
12.24
1.25
0.20
1.31%
16%
BRO
Brown & Brown, Inc.
17.8
3.55%
16.18
1.10
0.32
1.80%
29%
GBCI
Glacier BanCorp., Inc. 
9.37
3.65%
16.44
0.57
0.52
5.55%
91%
SWK
Stanley Black & Decker, Inc.
49.1
3.87%
13.68
3.59
1.64
3.34%
46%
MLM
Martin Marietta Materials, Inc.
63.22
3.98%
34.36
1.84
1.60
2.53%
87%
SUSQ
Susquehanna Bancshares, Inc. 
5.46
4.00%
21.00
0.26
0.08
1.47%
31%
BMO
Bank of Montreal
55.85
4.09%
11.24
4.97
2.71
4.85%
55%
CFR
Cullen/Frost Bankers, Inc.
45.86
4.13%
12.99
3.53
1.84
4.01%
52%
LNC
Lincoln National Corp.
15.63
4.20%
4.56
3.43
0.20
1.28%
6%
HIG
Hartford Financial Services Group Inc.  
16.14
4.26%
4.62
3.49
0.40
2.48%
11%
SJW
SJW Corp.
21.77
4.31%
16.37
1.33
0.69
3.17%
52%
NTRS
Northern Trust Corp. 
34.98
4.39%
13.88
2.52
1.12
3.20%
44%
TROW
T. Rowe Price Group, Inc. 
47.77
4.42%
16.76
2.85
1.24
2.60%
44%
WSFS
WSFS Financial Corp. 
31.57
4.43%
15.55
2.03
0.48
1.52%
24%
PBI
Pitney Bowes Inc  
18.8
4.44%
11.33
1.66
1.48
7.87%
89%
PEP
PepsiCo Inc.
61.9
4.47%
15.75
3.93
2.06
3.33%
52%
TRV
The Travelers Companies, Inc.
48.73
4.53%
9.21
5.29
1.64
3.37%
31%
CBSH
Commerce Bancshares, Inc. 
34.75
4.57%
12.32
2.82
0.92
2.65%
33%
PH
Parker Hannifin Corp.
63.13
4.59%
9.91
6.37
1.48
2.34%
23%
TDS
Telephone and Data Systems, Inc
21.25
4.68%
11.87
1.79
0.47
2.21%
26%
FRS
Frisch's Restaurants, Inc
19.4
4.70%
10.37
1.87
0.64
3.30%
34%
CBU
Community Bank System, Inc.
22.69
4.71%
11.64
1.95
1.04
4.58%
53%
UTX
United Technologies Corp.
70.36
4.83%
13.64
5.16
1.92
2.73%
37%
T
AT&T Inc
28.52
4.85%
8.29
3.44
1.72
6.03%
50%
PAYX
Paychex, Inc. 
26.37
4.98%
17.94
1.47
1.24
4.70%
84%
Watch List Summary
Topping our list this week is First Niagara Financial Group (FNFG).  According to Value Line, this New York regional bank typically trades at 15 times earnings.  The recent merger with NewAlliance Bancshares should fuel First Niagara's expansion and growth.  It appears that growth is being priced into the company as seen in the forward P/E ratio of 7.5.  If the company can grow 18% as predicted by the analysts, the dividend payout ratio should contract slightly.

Moving down the list, we have a well known bluechip company, 3M (MMM). IQTrends estimates that anytime 3M trades around a 3% dividend yield, it is undervalue. Currently, the yield sits slightly above its undervalued range at 3.06%.  Another gauge we can look to is Value Line Investment Survey, which shows a fair value at 12x cash flow. Using the 2012 estimate of $9 cash flow and 3M is fairly valued at $108.  At the  current price of $71, with a 3% yield, there appears to be a reasonable  margin of safety for long-term investors.

Another company to highlight this week is Avon Products (AVP). This cosmetics producer is extremely undervalued according to historical cash flow and dividend yield. At almost 5% dividend yield and a healthy payout ratio, we believe Avon is a stock one to pay attention to. The stock is undervalued at or around 3.7% dividend yield so the current 4.69% yield suggests that AVP has at least 25% upside. If based on AVP's cash flow we get a more bullish picture. Valueline shows Avon trades around 14x cash flow and with 2012 consensus at $2.80 per share, Avon's fair value appears to be at $39, a figure that is twice the current price.

After last appearing on our Dividend Watch List of September 16, 2011, Harleysville Group (HGIC) has increase by 119%.  On Friday September 23rd, it was reported by Bloomberg (article here) that Harleysville Group was rumored to be acquired by Nationwide Insurance.  On Thursday September 29th, it was officially announced that Nationwide Insurance would pay $60 a share for Harleysville Group.  Nationwide Insurance is paying 2 times book value in the transaction.  Harleysville Group was ranked 3rd on our list of top dividend stocks to consider on September 16th.
From the same list, three insurance related companies are worth considering.  First on the list is American National Insurance Company (ANAT) which “…operates in five segments: Life, Annuity, Health, Property and Casualty, and Corporate…” ANAT is selling at a book value of $139 a share while trading at $69.25 and sporting a P/E ratio of 11.5.  From 1992 to 2002, ANAT increased it’s dividend for each year.  However, since late 2002, ANAT has intermittently increased the annual dividend from $2.96 to the current level of $3.08.  The dividend yield is a healthy 4.40% with a reasonable payout ratio of 51%.
The next company was ranked 5th on our September 16th list and currently ranked 51st is Brown & Brown (BRO).  Brown & Brown is “…a diversified insurance agency, markets and sells insurance products and services primarily in the United States.”  BRO has a price/book ratio of 1.65 and an enterprise value of $2.51 billion.  Trading within 4% of the 52-week low, Brown & Brown has fallen by 34% from the high and is within 13% of the 2009 low.  BRO has increased the dividend every year since 1996.

Finally, Allstate (ALL) was ranked 9th on the list and has managed to fall off of our current list.  Prior to 2008, Allstate had increased the dividend for 14 years in a row.  However, the financial crisis took its toll on the company requiring a dividend cut of 51%.  Allstate recently increased the dividend in March of this year.  

Watch List Performance Review

In our ongoing review of the NLO Dividend Watch List, we have taken the top five stocks on our list from September 10, 2010 and have checked their performance one year later. The top five companies on that list can be seen in the table below.

Symbol Name 9/10/2010 9/9/2011
% change
INTC Intel Corp. 17.97 19.7 9.63%
WST West Pharmaceutical Services 33.65 37.78 12.27%
TR Tootsie Roll Industries Inc 23.87 23.67 -0.84%
OMI Owens & Minor, Inc. 26.44 27.72 4.84%
BEC Beckman Coulter, Inc. 45.71 83.47 82.61%
Avg.
21.70%
Dow Industrials 10,462.77 10,992.13 5.06%
Excluding Beckman Coulter (BEC), the remaining four stocks, on average, managed to exceed the Dow Jones Industrials throughout the year with a gain +6.48%. The average performance of all five stocks was 21.70% compared to the Industrials 5.06% in the same one year period of time.

Dow Theory: Bear Market Downside Target

On August 2, 2011, we received what is widely understood to be a Dow Theory bear market indication. According to Dow Theory, a bear market indication shall remain in place until counteracted by a bullish indication. The middle ground, where there is not a new bear market confirmation nor a new bull market signal, is generally considered a range or a “line.”

On August 9, 2011, we presented what we believed to be bear market rally targets according to Dow Theory. In the comment section of that same article, we revised the bear market rally targets based on the low of the Dow Industrials set on August 10, 2011.

The first bear market rally target, which seems next to impossible for the Dow Industrials to stay above, is 11,416.80. This level was only the first of five upside targets that would need to be breached for any prospect that a renewed cyclical bull market is in the works.

A confirmation of the bear market would be signaled if the Dow Industrials and Dow Transports were to fall below 10,719.94 and 4,149.94, respectively.

According to Dow Theory, we are still in a bear market and the early unconfirmed indications are that we may be headed to the 9,686.48 level.

Buffett Prepares His Exit

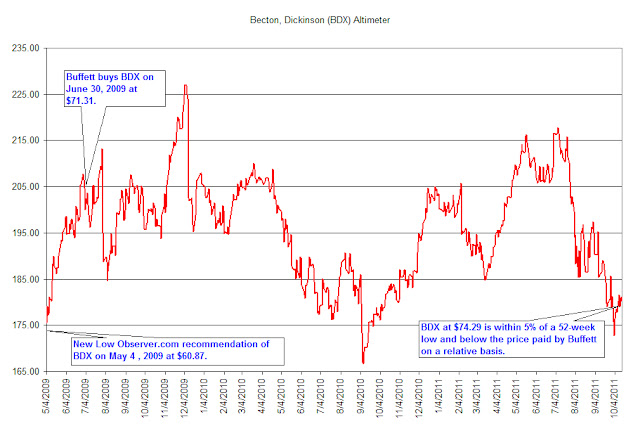
In a Market Watch article title “Buffett’s Berkshire Buyback Part of Exit Plan”, it was announced that Berkshire Hathaway (BRK-A) will buy back shares of its Class-A and Class-B shares. In the article, it was also mentioned that “the plan also essentially provides for ‘an unlimited and perpetual program.’” This suggests that the shares of Berkshire Hathaway will continuously be bought under specific conditions.
We’re in perfect agreement that the current plan to repurchase Berkshire Hathaway (BRK-B) stock along with the introduction of a select team of managers is part of the strategy to phase out Warren Buffett’s involvement in the company. However, we think that the most overlooked part of Buffett’s departure plan was the purchase of Burlington Northern Santa Fe (BNI).
For a long time, Warren Buffett has been outspoken against the ownership of airline shares due to “…significant capital to engender the growth, and then earns little or no money.” Therefore, it would seem out of character to purchase a company in an industry synonymous for many of the same attributes as airlines. However, the purchase of a railroad company has two significant advantages that are not afforded to most corporations in the United States.
First, a quirk in the rules for railroads allow them to not have to liquidate in bankruptcy, if that were to occur. After Buffett is gone, whoever is in charge can bumble with some derivative instruments that, for unforeseen reasons, blow up. If the blow up were large enough, it could trigger the need to file bankruptcy to get Berkshire Hathaway’s house in order. The clause in the Interstate Commerce Commission (ICC) and Bankruptcy Act allows for railroads not to liquidate if faced with bankruptcy proceedings. This protects Berkshire Hathaway from having to sell off valuable assets while the company re-emerges out of bankruptcy.
The second significant succession strategy of a railroad has to do with what is called “compulsory mergers.” This requirement allows the ICC and a railroad that has gone bankrupt to merge with another company on terms drawn up by the ICC, the bankrupt company and the acquiring company.
Since the railroad industry, like the airline industry, is synonymous for bankruptcy, BRK gets to take advantage of the "compulsory" mergers rule under section 77 of the Bankruptcy Act. This rule gives the ICC "...control over formulating a plan for the reorganization of an insolvent railroad."
Knowing that bankruptcy is only just around the corner in the next economic purge, Berkshire Hathaway can absorb other rails with absolute impunity. Even better, "...Section 5 of the Commerce Act, which governs mergers of solvent railroads, give the merging carriers primary control over the formulation of a merger plan." Could you imagine structuring your own deal of a merging rail that is going bankrupt?
There is a lot of precedent for these laws in the structuring of many railroads.  In fact,  Chicago, Burlington and Quincy Railroad and Northern Pacific Railway (independent companies before their merger) have had their days with aspects of these rules before merging. Because railroads go bankrupt often, there are many examples of how this works. In one "merger," an acquiring railroad "bought" $1.9 million of claims against the state of Florida at a cost of $5,000 from another railroad facing bankruptcy. In our examination of the topic, we have seen assets worth even more being given away for $0.00 as part of a compulsory merger. 
Because Buffett has been outspoken against the ownership of airline shares due to the general lack of profitability and high propensity to go bankrupt, it seems out of character to purchase a company in an industry synonymous for the same attributes. We believe that Buffett’s purchase of Burlington Northern Santa Fe (BNI) was a critical piece of the succession strategy laid down for the benefit of current and future shareholders of Berkshire Hathaway.

Citations:

  • Berkshire Hathaway 2007 Annual Report. Page 8. 2007 Report here 
  • Altman, Edward I. Predicting Railroad Bankruptcies in America. The Bell Journal of Economics and Management Science. Vol. 4, No. 1 (Spring, 1973), pp. 184-211.
  • The Yale Law Journal. "'Compulsory' Mergers under Section 77 of the Bankruptcy Act". Vol. 64, No. 2 (December 1954). page 282-292
  • Bedingfield, Robert, “Top Officer Quits at Penn Central in Cash Squeeze”, New York Times, June 9, 1970. page 1.
  • Schroeder, Alice. The Snowball. Bantam Books, New York. 2008.

Please consider donating to the New Low Observer. Thank you.

In the News: September 25, 2011

Please consider donating to the New Low Observer. Thank you.