Q: “Can I see an updated version of the undervalued and overvalued ranges since 2008 please?”
-
Topics
Archives
-
-
Recent Posts
-
-
-
-

Q: “Can I see an updated version of the undervalued and overvalued ranges since 2008 please?”
Q: “Wondering if the key is to watch for divergence w commodities and equities?”
Posted in inflation, Interest Rate Monitor, interest rates, Pandemic, Pandemic Roundtrip, Q and A, Wholesale Prices
Tagged members
Below is a collection of recent questions on our work: Continue reading
Some recent questions we’re considering: Continue reading
After our April 30, 2022 S&P 500 Downside Targets assessment there was a very important question raised which requires additional commentary. Continue reading
Reader BlueIce comments (found here):
“So for the past four years, the NYSE is up but volume down…What is the root cause, if any? Bank Bernankski ?”
Our Response:
While there is considerable belief that the Federal Reserve has been the main driver in the financial markets since the March 2009 low, we believe that the Fed’s activity has NOT YET been felt in the stock market. First we’ll explain the two primary reasons we believe this. Afterwards, we’ll explain what we believe are the possible outcomes to the Fed’s current policies.
First, in our January 19, 2011 article titled “Federal Reserve Isn’t to Blame for the Current Market Run” (found here), we concluded with the following thought:
“A cursory review of market data during the periods from 1860 to 1914 makes it clear that declines of nearly -50% or more are likely to retrace +66% to +100% of prior declines. This pattern has been easily demonstrated in the periods after 1914. However, we’re only trying to illustrate that the acceptance of the Federal Reserve’s role as the leading cause of the current +69% retracement of the prior decline (2007-2009) is false.”
We’ve maintained the view that the Federal Reserve’s impact on the stock market has been muted so far.
Second, regarding the issue of manipulation of the markets, which is implicit in the discussion of the Federal Reserve’s involvement in the rise of the stock market, we take the Dow Theory view on the topic. Charles H. Dow was very specific about market manipulators and manipulation. Dow has said that manipulation is a factor of the market in the day-to-day movement. However, the long-term trend of the market cannot be manipulated as demonstrated in detail from the writings of William Peter Hamilton, former editor of the Wall Street Journal.
Hamilton says of manipulation:
“The market is always under more or less manipulation.”
“Even with manipulation, embracing not one but several leading stocks, the market is saying the same thing, and is bigger than the manipulation”
“Major Movements Are Unmanipulated-One of the greatest of misconceptions, that which has militated most against the usefulness of the stock market barometer, is the belief that manipulation can falsify stock market movements otherwise authoritative and instructive”
“These discussions [of manipulation] have been made in vain if they have failed to show that all the primary bull markets and every primary bear market have been vindicated, in the course of their development and before their close, by the facts of general business, however much over speculation or over-liquidation may have tended to excess, as they always do, in the last stage of the primary swing”
“It has been shown that, for all practical purposes, manipulation has, and can have, no real effect in the main or primary movement of the stock market, as reflected in the averages. In a primary bull or bear market the actuating forces are above and beyond manipulation. But in the other movements of Dow’s theory, a secondary reaction in a bull market or the corresponding secondary rally in a bear market, or in the third movement (the daily fluctuation) which goes on all the time, there is room for manipulation, but only in individual stocks, or in small groups, with a well-recognized leading issue”
(Source: Hamilton, William Peter, The Stock Market Barometer, Wiley & Sons, New York, 1922.)
The Fed and world central bank manipulation has an impact on the day-to-day and maybe the medium-term, however, the long term will exert itself regardless of the manipulation.
Finally, while we are skeptical about the Dow Theory secular bull market indication, we have to accept that it is real. As with most economic policy, the impact is felt long after the implementation. Dow Theory might be saying that we’re about to enter a phase hyper-activity in the stock market. If this is the case, then we just might see the impact of the Federal Reserve’s stimulus of the last several years finally kick in, catapulting the stock market to unbelievable heights.
The lack of trading volume in the stock market since 2009 reflects little or no participation on the part of the public. If this is true, then any meaningful rise in trading volume (on the buying side) due to added participation from the public could result in tremendous gains. This thought sits in the back of our mind as we strategize the best way to take advantage while not being over exposed.
When we say that the public hasn’t participated in the stock market’s rise, who cares? The answer is the very financial institutions that required bailouts in 2008. They have been trading amongst each other in a game of hot potato. If the public doesn’t jump in soon there could be major fireworks to the downside.
Again, if the Dow Theory bull market indication isn’t real then we’ll see another round of “too big to fail” institutions coming with hat in hand to the U.S. government. The most vulnerable institutions could be those that were forced to merge with companies like Bank of America/Merrill, Wells Fargo/Wachovia and JPMorgan/Bear Stearns. From our research on this topic, we’ve seen what happens when a sizable failed institution is forcibly merged with an ailing but salvageable company (i.e. our article on CreditAnstalt).
Comments Off on Dow Theory Q&A
Posted in Dow Theory, manipulation, Q and A, William Peter Hamilton
Reader Kerry Comments:
“I’d like to pick up on the problem that untrusting investor has identified ‘The problem is that we have never seen one yet that has much accuracy or predictive ability to any substantive degree or within any reasonable time frame. As such, it becomes a ‘big gamble’ to take action on the predictions of any such cycle models or theories.’
“I like cycles myself, but I struggled with cycles that appeared great but then tended to be slightly off when forecasting the future, and therefore are difficult to use in trading. This led me to conduct my own research that has culminated in my own cycle work and the discovery of a 2.2/4.4 year cycle. I am of the opinion that the secular bear is about to strike back in the second half of 2013 as the 17.6 year stock market cycle continues until 2018, when the next great bull market will properly begin.”
Our Response:
Implicit in the discussion of cycles (observations of the past) is the eventual application of the analysis for the future. Unfortunately, some who do the best research on the study of cycles have the worst record of application. Our view is that we’ll be wrong about the actual cycle range and the application of the timing. Therefore, we are never disappointed about the outcome.
However, as students of the market we are constantly working to find quality research on the topic. Already we know that Charles Dow’s work on stock market cycles is useful when applied with skepticism and moderation.
As an example, based on the Wenzlick model for when real estate would bottom (18.3 years) it suggested that the low would be in 2009. In our January 2010 article titled “Real Estate: The Bottom is Calling” we said the following (found here):
“…tendency has been to include the years 2008 and 2010 just to play it safe.”
We understand that the markers for a bottom or top are like sand dunes in a desert, they are constantly on the move. This does not negate the cyclical nature of market moves, it just means that flexibility is required when thinking on the topic of cycles.
We followed up the January 2010 article with what we believed was the definitive call in the real estate bottom based on the work of Wenzlick. In a December 2010 article titled “Real Estate: The Verdict is In” (found here) we felt the title said it all.
Naturally, we could have been completely wrong and in select markets, a bottom may not be in at all. However, we’re trying to think in terms of the broader context. Based on the metrics that we tracked, real estate did hit bottom on or fairly close to the December 2010 low as highlighted in our follow-up article titled “Real Estate: A Sustainable Rise” (found here).
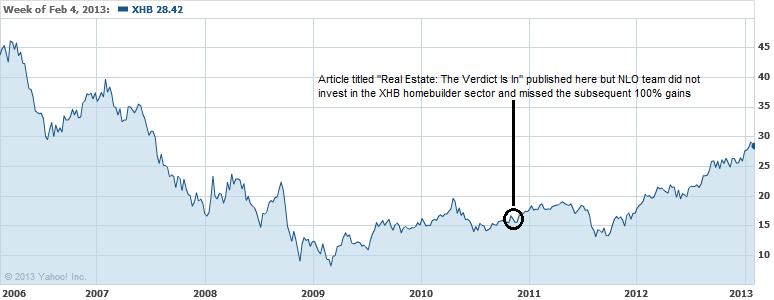
Within the general context of “being accurate” on our call of real estate based on the cycle work of Wenzlick, there are a couple of MAJOR ASPECTS THAT WE DID NOT GET RIGHT and that is the recommendation and investment in homebuilder stocks and the purchase of the home in our specific county.
First, we did not recommend homebuilder stocks because we simply didn’t think of it. That was a huge missed opportunity as shown in the chart below of the SPDR S&P Homebuilders ETF (XHB).
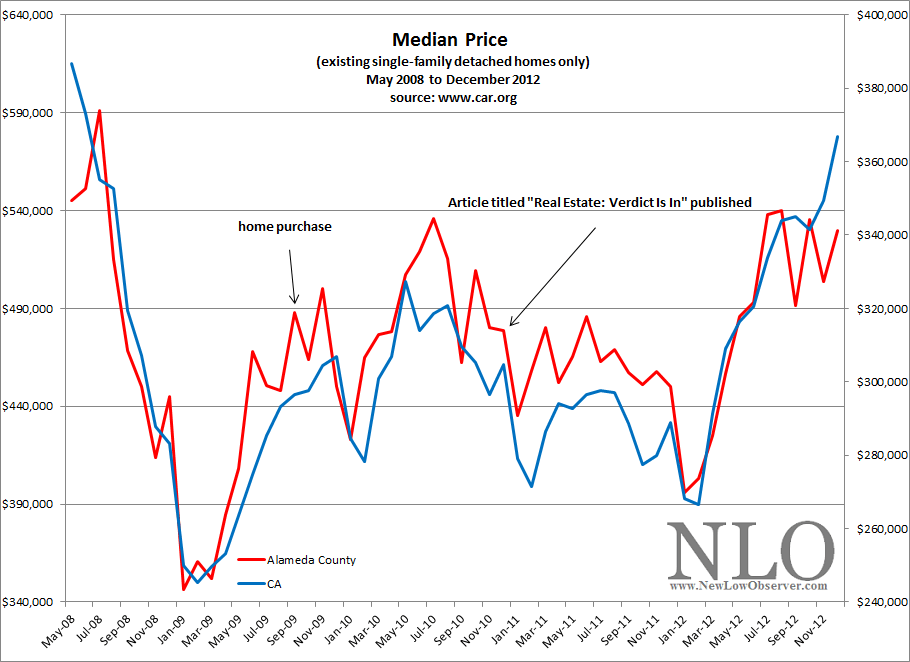
Second, our purchase of a home in September 2009 was not at the low point, for our region of the country, as real estate prices had bottomed in January 2009. By the time of the 2009 purchase, median prices for our county had increased by +40% as seen in the chart below (www.car.org).
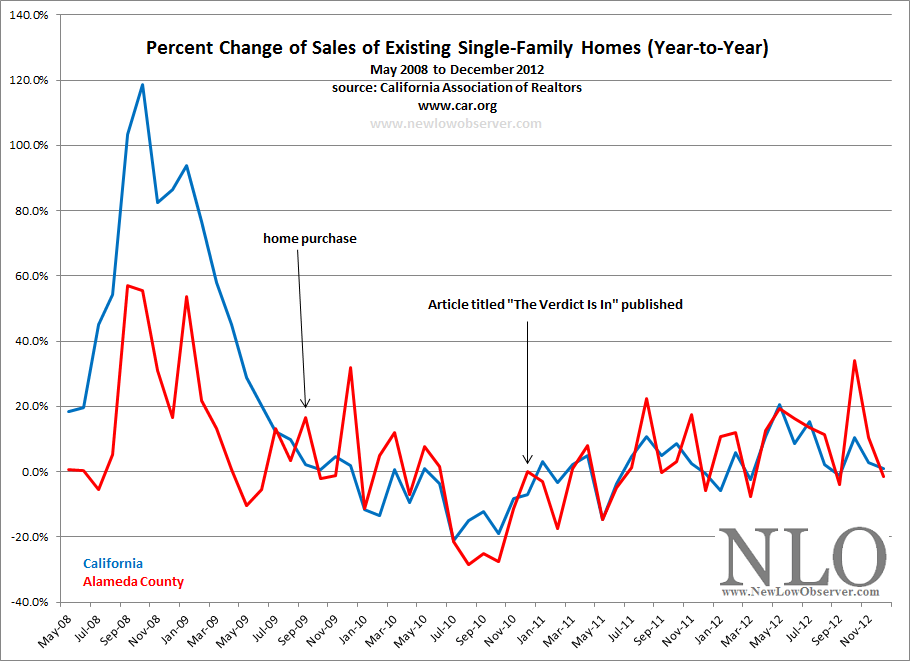
Also, as seen below, existing home sales for our county bottomed a year after the home purchase.
However, the overall point is that we're closer to the low in the respective cycles rather than near the peaks in the cycle with out investments and purchases. Additionally, we’re taking the lessons for the current cycle and hoping to apply it to the next cycle move.
We also have cycle targets for gold and interest rates which have been fairly accurate. Do we go “all in” on the cycle turns? No. However, we do factor in the chance that the change in the cycle could exert its force on our best intentions.
Again, the emphasis should always be on skepticism and moderation when attempting to apply cycles for predictions of the future. With this in mind, a good analyst will hedge their commentary on cycles and allow for a wide margin of error. After all, we’re all students of the market (real estate, jobs, stocks, cars, groceries etc.) and therefore open to changing conditions.
As mentioned earlier, we’re always factoring the downside risks and acting accordingly (most of the time, except when our subscriber SD pointed out the awesome buying opportunity on DELL from our own watch list at the low…Great call SD!).
Comments Off on Q&A: Cycles and Their Use
Posted in cycle analysis, Q and A, real estate
Subscriber M.C. asks:
“I have a couple questions - I know you often let your profit "run" after selling your principal investment in a stock. We're almost certainly investing in different sums, so this is likely a difficult question to answer, but is it worth me hanging to shares if my profit portion is small (maybe only a few K) and only allows me to hang to a handful of shares? Do you always retain your profit portion regardless of %?”
Our Response:
We’re incredibly risk-averse even though we put so much into a single stock and incur transaction fees to buy and sell after a stock has attained a 10% gain (ideally within a year).
The good news is, the amount of the money being invested has little to do with our strategy. Our approach is calibrated to work with large and small pools of funds since it is based on the percentage of the portfolio and not the dollar amount. As long as the amount that you’re initially investing is a sizable portion of your overall portfolio (5% and above) for each stock that you buy, then you’re in a good position to see the value of our approach.
Regarding holding on to the profit portion of a couple thousand dollars, more specifically, equaling ½% to 1% of the portfolio, we always recommend taking advantage of the low prices that a stock is acquired. As time has passed we have realized that the best way to do this is to keep the profit portion which allows for compounding by reinvesting the dividend and any capital appreciation that usually occurs after the principal portion is sold. The added benefit of this strategy is the ability to methodically build a diversified portfolio over time.
There are a couple of nice attributes to this approach that is worth re-iterating. First, we always participate in any addition increase in the price. Second, we get to compound our way to long-term wealth. Finally, the stock that we’ve sold the principal portion on would have to fall to zero in order for us to experience a loss. This allows us to comfortably wait out the long-term rather than wring our hands about short-term gyrations and possible risk of loss to principal.
The question of whether “…we always retain the profit portion regardless of %…” is not always the case. The short answer is no, we don’t always retain the profit portion. With stocks from our dividend list we tend to retain the profit portion while stocks from our Nasdaq 100 list and speculations in gold and silver are usually sold entirely.
Here is a breakdown of the most recent non-speculative transactions that we’ve entered into and actions that we’ve taken once sold (links to articles within stock symbols, if available):
| symbol | price bought | price sold | gain/loss | % retained | current price | % change since sold |
| CRR | 64.94 | 74.18 | 14.23% | 8.16% | 77.99 | 5.14% |
| WAG | 32.94 | 36.14 | 9.71% | 9.00% | 33.95 | -6.06% |
| XEC | 54.97 | 64.15 | 16.70% | 16.00% | 63.8 | -0.55% |
| RGA | 59.39 | 62.87 | 5.86% | 6.66% | 53.67 | -14.63% |
| RGA | 48.42 | 59.63 | 23.15% | 20.00% | 53.67 | -9.99% |
| SYY | 27.96 | 32.14 | 14.95% | 10.00% | 30.87 | -3.95% |
| SYY | 26.61 | 29.33 | 10.22% | 9.43% | 30.87 | 5.25% |
| BOH | 38.24 | 47.15 | 23.30% | 18.91% | 44.76 | -5.07% |
| AMAT | 11.11 | 13.8 | 24.21% | 19.21% | 11.44 | -17.10% |
| TR | 24.05 | 22.97 | -4.49% | 3.00% | 27.04 | 17.72% |
| UNM | 18.68 | 20.63 | 10.44% | 9.33% | 21.03 | 1.94% |
Of the stocks listed in our NLO Portfolio, 29.24% is due to acquisitions of INTC, EXPD and MKL that have not yet gained 10% or more. The Alleghany (Y) position, at 9.52% of the portfolio, is the result of our initial position in Transatlantic Holdings (TRH) being acquired as outlined in our posting dated March 9, 2012. The remaining shares that we have in the companies listed, comprising 11% of the portfolio, are all strictly the profit portion of our prior investments. As we’ve said earlier, these stock continue to compound at no additional cost, enjoy the benefit of any additional capital appreciation and would literally have to go to zero before any loss is incurred.
Whenever possible, we hope to eliminate the element of risk when investing in the stock market. So far, 11% of our portfolio is on that path. We hope this basic outline demonstrates what we’re trying to accomplish from both a short and long-term perspective. Thanks for the great question.
“One of the most difficult concepts to get across to subscribers is the concept of primary trend of the market. This may be old hat to my veteran subscribers of 10 or 20 years, but the whole idea of the primary trend bears repeating now.“There are three trends in the market, all working with each other simultaneously. There is the great primary trend, lasting usually a few years up to 15 years or even longer. There is the secondary trend lasting usually a few months up to a year. And there is the minor or daily trend lasting a few days to a few weeks or so.“The minor trend of the market is open to manipulation. This shortest of trends may reflect a news event, a sudden scare, a sunny word from the president or any of a thousand other possibilities.“The secondary trend often reflects a short-lived expansion or recession that the economy or some very major news event. The secondary trend is also open to manipulation, usually on the part of the Fed in that the Fed can make money tight or loose (the Fed can even bring on a recession by restricting credit or the Fed can see a boom by opening the money spigots wide).“The primary trend is the great tidal trend of the market. When the tide is coming in we term it a bull market. When it is going out we call it a bear market. One of the basic tenets of Dow theory is that the primary trend of the market cannot be manipulated. That’s a point that every investor must understand. The primary trend is more powerful than the power of the Federal Reserve, Congress, and the president combined. When the primary trend of the market turns down (as it did early 1973) stocks will decline until the market discounts the worst that can be seen ahead. When the primary trend turns up (as they did in late 1974) the market will rise until the best that can be seen ahead is fully discounted in the price structure.“But the point I want to get across to subscribers is that once the direction of the primary trend is set, the market will fully express itself in the primary direction. The primary trend may be held back for a while, secondary reactions may interrupt the primary trend, but ultimately the trend will run to conclusion, it will express itself fully.”Russell, Richard, Dow Theory Letters, January 24, 1990, Letter 1035, 2
“The Dow theory is not an infallible system for beating the market. Its successful use as an aid in speculation requires serious study, and the summing up of evidence must be impartial. The wish must never be allowed to father the thought.”Rhea, Robert, The Dow Theory, 1932, Barron’s Publishing, 26
“The Averages Discount Everything -- The fluctuations of the daily closing prices of the Dow-Jones rail and industrial averages afford a composite of all the hopes, disappointments, and knowledge of everyone who knows anything of financial matters, and for that reason the effects of coming events (excluding acts of God) are always properly anticipated in their movements.”Rhea, Robert, The Dow Theory, 1932, Barron’s Publishing, 19
Comments Off on Dow Theory Q & A
Posted in Dow Theory, Q and A, Richard Russell
Question:
I hope this give a little more insight about our approach. Thanks again for a great question.
-Touc
Comments Off on Q & A
Posted in Q and A, Richard Russell
Our experience has been that, provided the company has a history of dividend payments (something that cannot be manipulated through accounting methods) and all other financials attributes being in order, the company is put on a list to be acquired at the earliest opportunity. A great book that summarizes our general approach is "Dividends Don't Lie" by Geraldine Weiss and the upcoming book "Dividends Still Don't Lie" by Kelly Wright. In these books the main idea is that quality stock tend to trade in a price range based on the dividend yield.
Question:
Question:
I hope the above explanations have peaked your interest in the basics of investing. Much of what we have pointed out about considering the purchase of stocks is rooted in being reluctant participants of a consumer society. However, we have transferred the same skills as consumers of liabilities to the acquisition of assets. I hope you have time to read the book "Dividends Don't Lie" through your local library (save some money) until the new book comes out next year. Touc.
On Friday August 21, 2009, the Dow Jones Industrial Average (^DJI) exceeded the prior high of 9398.19 set on Wednesday August 12th. Unfortunately, the Dow Jones Transportation Index (^DJT) are lagging in the ability to exceed the high of 3774.12 set on Thursday August 13th. The only thing that favors the Transports in this instance is the fact that on a percentage basis the Transports rose 2.58% versus the Industrials 1.67% increase. This indicates that there is relatively strong interest in the Transports. Hopefully this enthusiasm will spill over into today's trading.
If the Transports do not break above the August 13th high then we might be on track for a non-confirmation. A non-confirmation means that the recent upward trend in the market will be coming to an end soon. Conversely, if the Transports break the indicated high while the Industrials move moderately higher then we could be in good shape for the short term.
Dow Theory Q & A
Q.When looking at a chart with weekly Dow prices, how is the weekly price calculated? Is it the Friday close or is it an average of the whole weeks close?
A. In all my readings of Dow Theory, I cannot remember anyone suggesting the use of weekly data for analysis. This doesn't mean that weekly data isn't useful, you might see a consistent pattern that I would otherwise overlook. Dow Theory is supposed to be calculated by using the closing price for both indices on a daily basis. I have bastardized Dow Theory by taking the high and low price of a given period as a way to get a sense of herd mentality or market psychology. This is in contrast to taking only the closing price.
Depending on the source, weekly data is calculated using the opening price from the open on Monday, the high and low price is from whichever days in the week that had either number and the closing price from the Friday close. An average of the week isn't how the weekly closing price is calculated. Touc.
Please revisit Dividend Inc. for editing and revisions to this post.
Comments Off on Dow Theory
Posted in Dow Theory, Dow Theory Non confirmation, Q and A
A: First, the crisis is past us and now we're faced with sorting through the wreckage which is more painful than the actual crisis itself. The general public now has the taste of bitterness necessary to feel that maybe there is a difference between saving and investing or the distinction between investing and speculating. The public now knows, by force of nature, that a home is a place where you live and not an investment. These realities, which faded after the Dow first hit 10,000, are in the recesses of the collective subconscious. While the lessons will be quickly forgotten, reminders will reappear in stark contrast to the hopes of the ever optimistic public.
In many of my postings and in the right hand column of my site you'll see that I expect this to be a bear market for at least the next 7 to 9 years. My 2016 date (based on cycle analysis) is the approximate year that I expect that either the market will hit its ultimate low or the point when valuations are expected to be at the most extreme low levels. Even after the year 2016 I do not expect the market to immediately go to new highs. Instead I expect that the market will meander for another 6-8 years before exceeding the previous high for good.
Within the context of a secular bear market there will be cyclical bull markets or bear market rallies. Great examples of the kind of market action that I expect are years from 1906-1924 or 1966-1982. Remember, a secular bull market has the ability to exceed the previous market high by at least 16.5%.
We will see a period when valuation are at historical low levels. Unfortunately, it will be very difficult to convince the retail investor that buying stocks en mass is the right thing to do. As an example, 1982 was a great year to buy stocks but with treasuries yielding 12% there was no way to convince the public that the Dow with a yield of 5.5% was worth it. Guaranteed money at 10-12% versus stocks at 5% seemed like a no-brainer.
A: I believe that we'll see earnings remain flat as corporations continue to cut costs but the shocker will be that we'll see earnings. The problem will be that corporations will cut costs too much which will lead to a general rise in prices and an increase in the value of corporate assets. Chapter 2 of the book Dow 3000 by Thomas Blamer and Richard Shulman clearly explains what most investors forget at the end of a bear market. Essentially, companies will become more valuable even though the stock price and earnings don't go anywhere.
"Men, it has been well said, think in herds; it will be seen that they go mad in herds, while they only recover their senses slowly, and one by one."
Posted in Q and A