
-
Topics
Archives
-
-
Recent Posts
-
-
-
-
Category Archives: Low Yield
U.S. Dividend Watch List Review
Posted in Dogs of the Dow, High P/B, High P/E, Low Yield, P/E ratio, Spectrum Analysis
Tagged members
2020 Dogs of the Dow
Below is a chart of the performance of the Dogs of the Dow from December 31, 2019 to December 31, 2020.
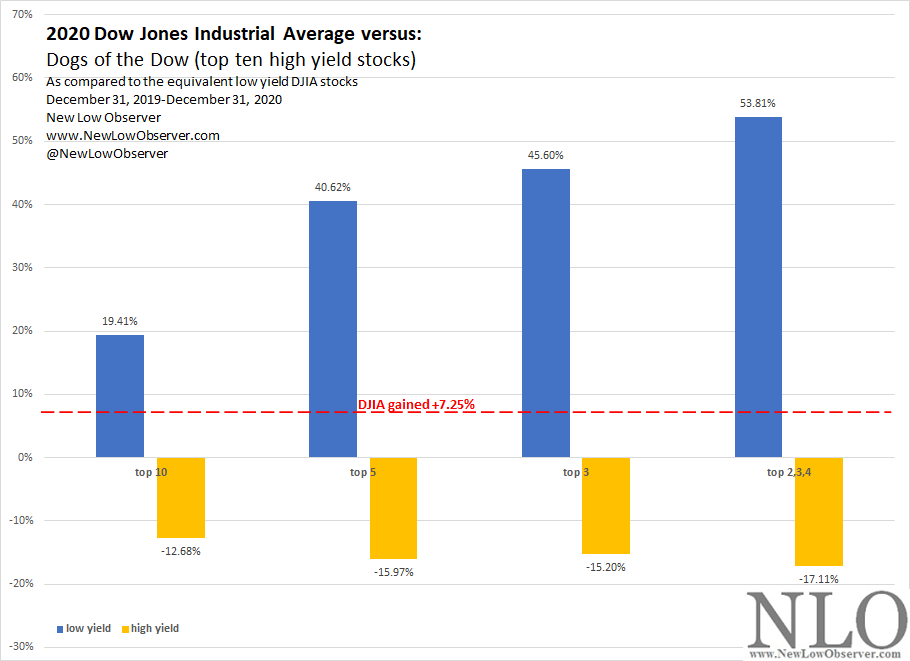
As with 2019, the Dogs of the Dow (ten high yield stocks) failed to exceed the performance of the Dow Jones Industrial Average in 2020. In addition, the Dogs of the Dow (ten high yield stocks) severely underperformed the low yield stocks with a spread of 32 points.
Our commentary from the January 2020 Dogs of the Dow watch list had the following to say:
“…high price to book, high price to earnings, and low dividend yield are the categories that we like the most for outperformance...”
Overall, the performance of the respective categories achieved the stated objective. High price to earnings faltered with only the (2nd, 3rd, & 4th) grouping managing to match the DJIA.

High yield stocks not only underperformed they also led the charge lower. If the DJIA index managers are done with changes to the index, we should see the high yield stocks match or exceed the index as years of exceptional gain must come to an end and the stocks that have already been punished should outperform solely by virtue of not declining as much.
see also:
Posted in Dogs of the Dow, Low Yield
Dogs of the Dow: 1994
In our continued pursuit to gather data that contradicts our view that low yield stocks outperform the high yield stocks (aka Dogs of the Dow) as presented in Michael O’Higgins’ book Beating the Dow, we have obtained the performance of the top ten, top five, top three and the 2nd, 3rd, and 4th stocks in the high and low yield groups then contrasted their performance against the Dow Jones Industrial Average for the same year.
In this case, the year under consideration is 1994 and we have added the list of ten stocks and their price with the dividend yield.
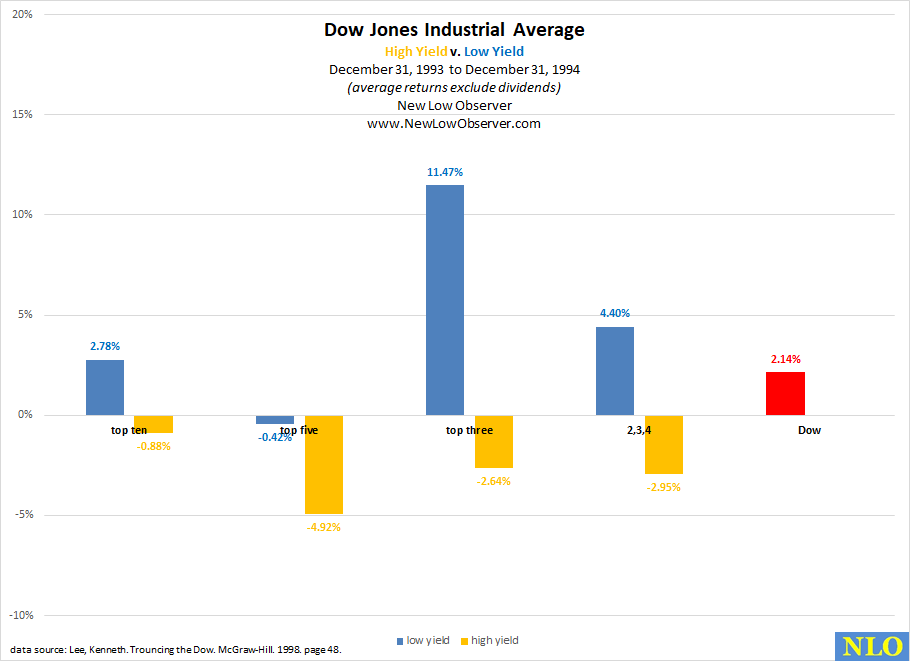
1994 Data Breakdown
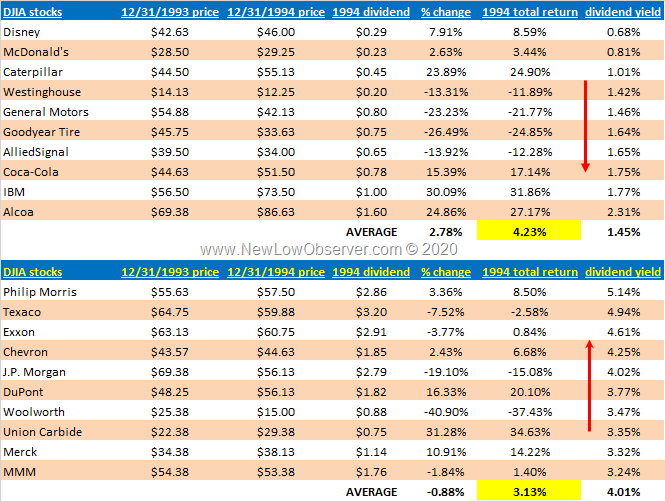
After reviewing the data and adjusting for splits, the Dogs of the Dow (High Yield stocks) again underperformed the Low Yield stocks.
Average Return 1991-1994
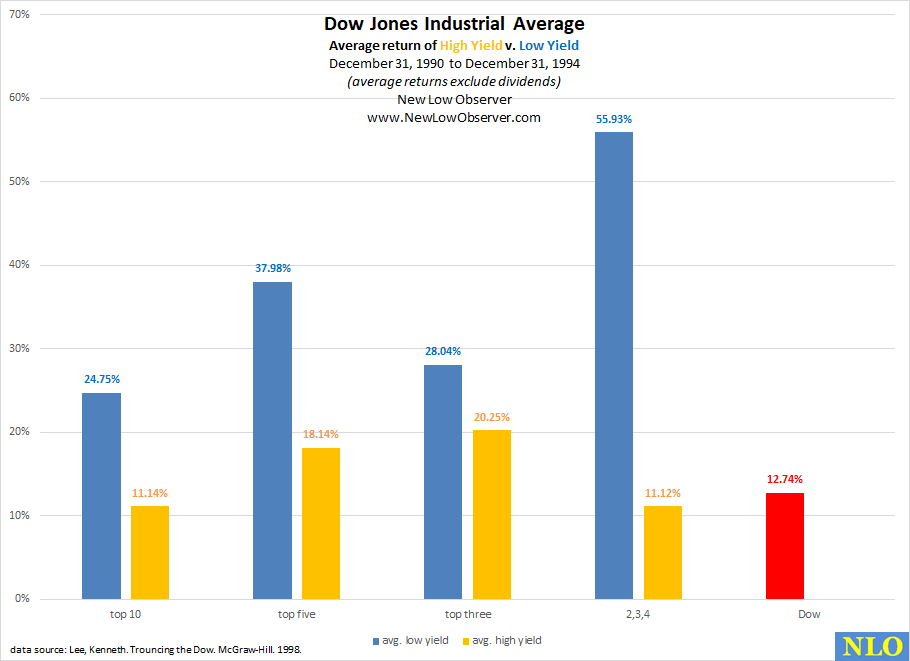
On average, from 1991 to 1994, the Low Yield stocks continue to outpace the Index and the High Yield (Dogs of the Dow) stocks at more than double the rate.
see also:
Posted in 1994, Dogs of the Dow, high yield, Low Yield
Dogs of the Dow: 1993
In our continued pursuit to gather data that contradicts our view that low yield stocks outperform the high yield stocks (aka Dogs of the Dow) as presented in Michael O’Higgins’ book Beating the Dow, we have obtained the performance of the top ten, top five, top three and the 2nd, 3rd, and 4th stocks in the high and low yield groups then contrasted their performance against the Dow Jones Industrial Average for the same year.
In this case, the year under consideration is 1993 and we have added the list of ten stocks and their price with the dividend yield.
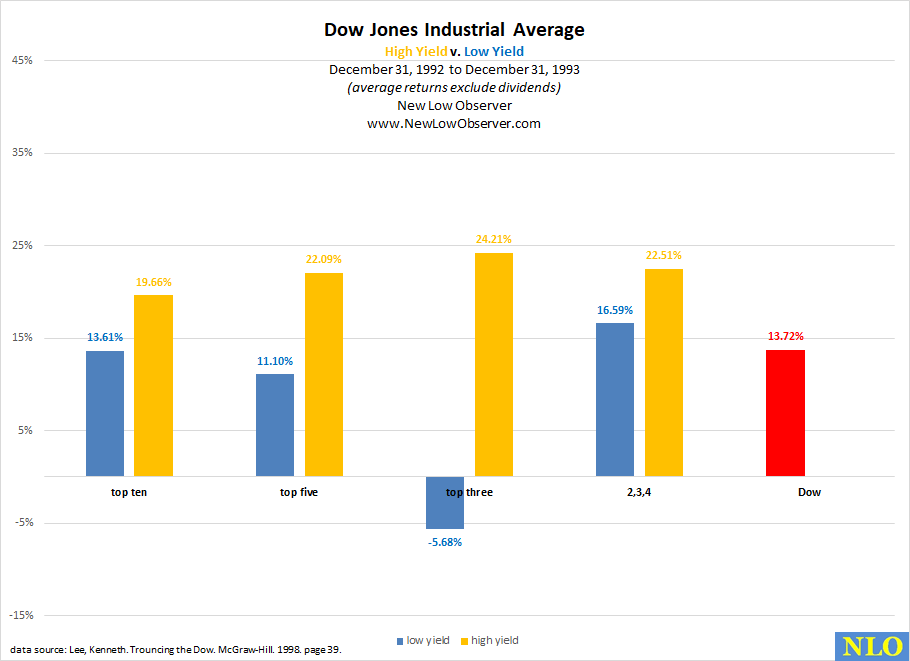
1993 Data Breakdown
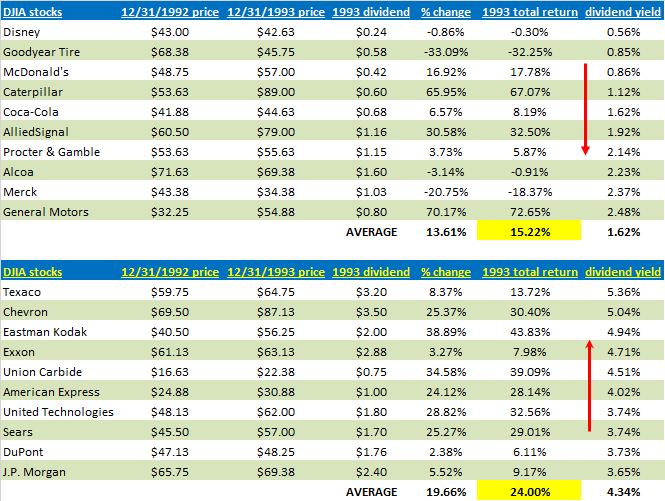
This is the first year where High Yield stocks (Dogs of the Dow) exceeded the returns of the Low Yield stocks.
Average Return 1991-1993
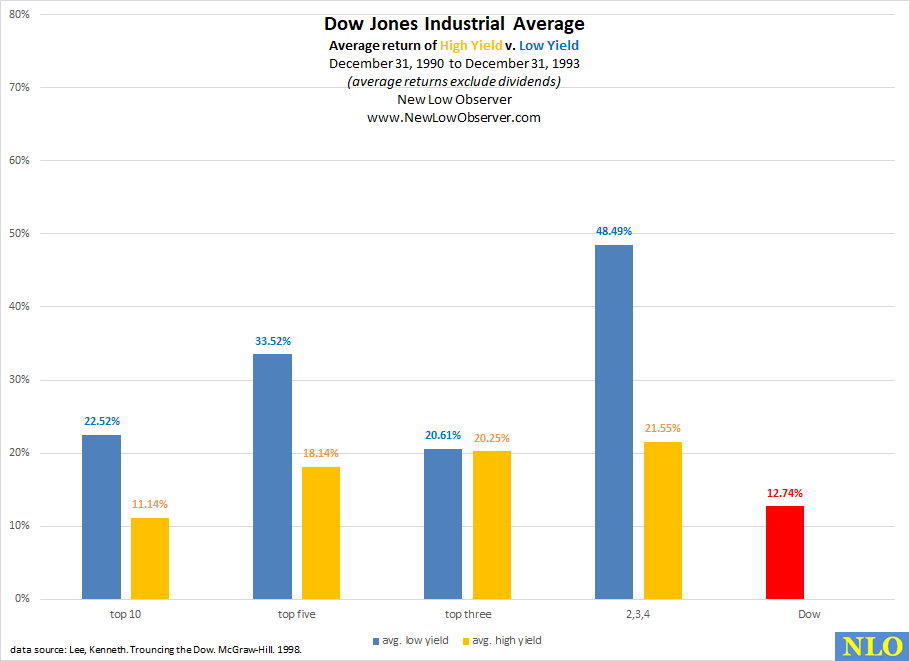
The average return for the period from December 31, 1990 to December 31, 1993 continues to show the Low Yield stocks exceeding the index in each grouping. However, the High Yield stocks are gaining ground with the top ten stocks failing to prove their ability to beat the Index.
see also:
Posted in Dogs of the Dow, high yield, Low Yield
Dogs of the Dow: 1992
In our continued pursuit to gather data that contradicts our view that low yield stocks outperform the high yield stocks (aka Dogs of the Dow) as presented in Michael O’Higgins’ book Beating the Dow, we have obtained the performance of the top ten, top five, top three and the 2nd, 3rd, and 4th stocks in the high and low yield groups then contrasted their performance against the Dow Jones Industrial Average for the same year.
In this case, the year under consideration is 1992 and we have added the list of ten stocks and their price with the dividend yield.
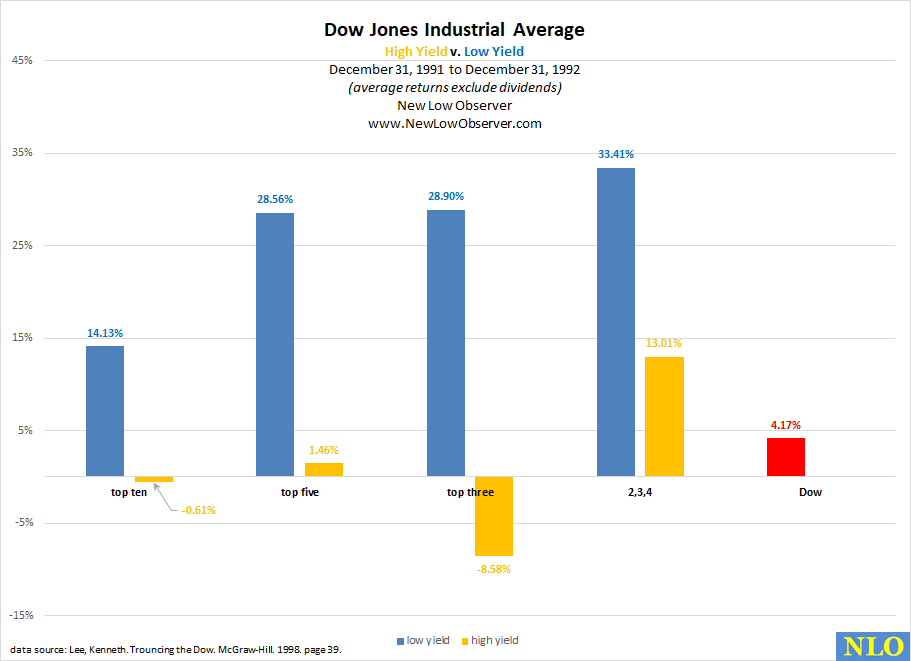
1992 Data Breakdown
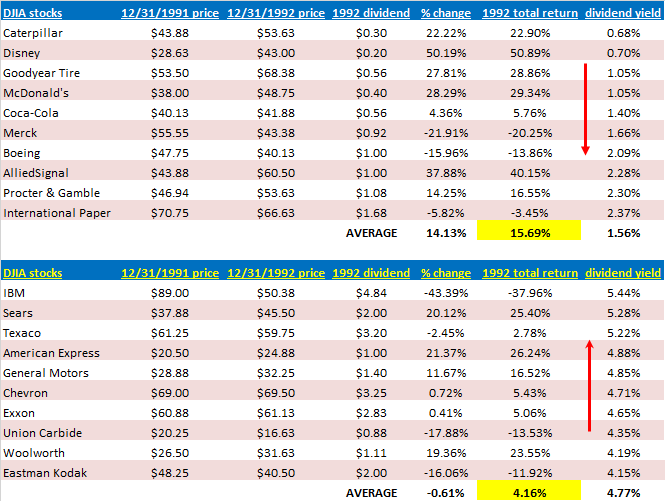
For the second year in a row, the top ten stocks in the high yield category underperformed the Dow Jones Industrial Average AND the low yield category.
Average Return 1991-1992
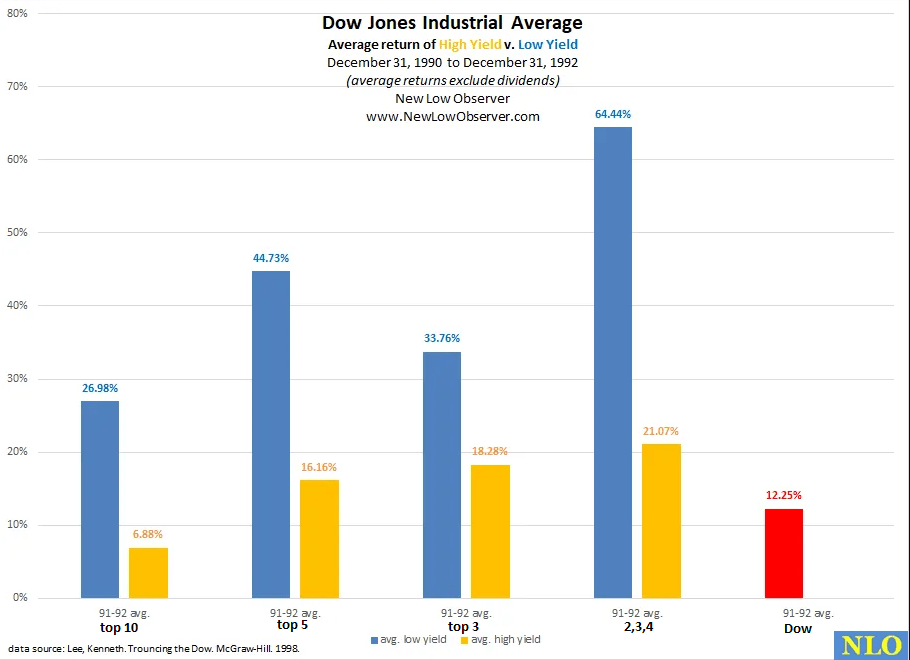
The average return for the period from December 31, 1990 to December 31, 1992 highlights the strength of the low yield stocks. However, for the top ten high yield stocks, they could not outperform the Dow Jones Industrial Average.
see also:
Posted in 1992, Dogs of the Dow, high yield, Low Yield
Dogs of the Dow: 1991
In our continued pursuit to gather data that contradicts our view that low yield stocks outperform the high yield stocks (aka Dogs of the Dow) as presented in Michael O’Higgins’ book Beating the Dow, we have obtained the performance of the top ten, top five, top three and the 2nd, 3rd, and 4th stocks in the high and low yield groups then contrasted their performance against the Dow Jones Industrial Average for the same year.
In this case, the year under consideration is 1991 and we have added the list of ten stocks and their price with the dividend yield.
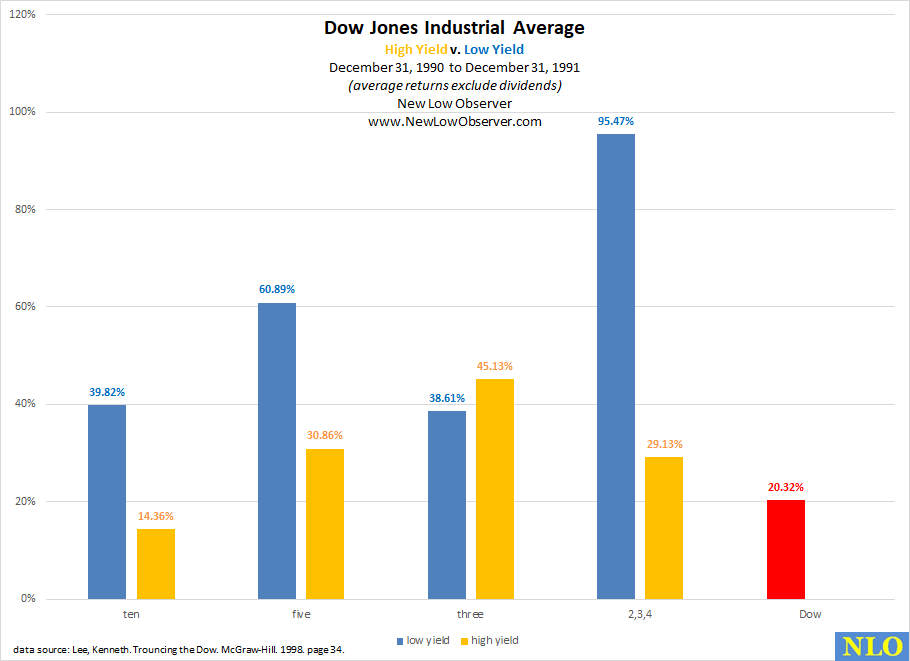
1991 Data Breakdown
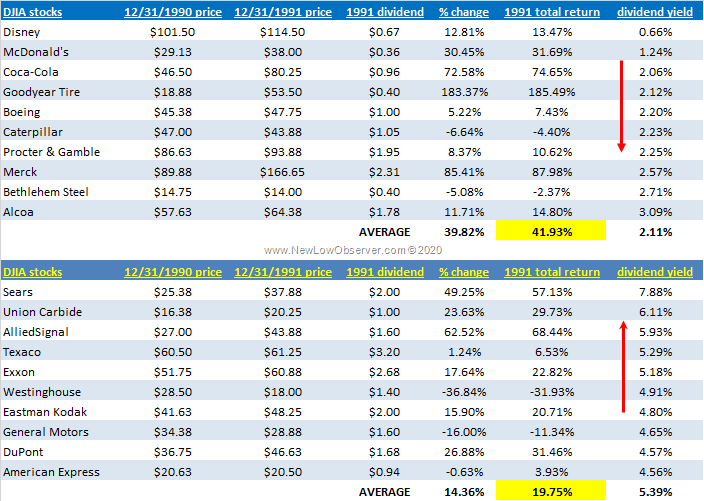
The data should be considered amazing because the exceptional yield that is offered by the high yield stocks (Dogs of the Dow) an investor generally foregoes nearly double the return. Also notice that the high yield stocks had 4 of the ten companies on their list that failed (bankruptcy, forced liquidation) while only one company in ten on the low yield list has failed (so far).
see also:
Posted in 1991, Dogs of the Dow, high yield, Low Yield
Stock Market Dividend Yield: 1871-2020
This from Barron’s on the U.S. stock market dividend yield from 1871-1996:

The Dow Jones Industrial Average dividend yield profile from 1920-2020: Continue reading
Posted in dividends, high yield, Low Yield, relative yield, Yield Profile
2019 Dogs of the Dow
Below is a chart of the performance of the Dogs of the Dow from December 31, 2018 to December 31, 2019.
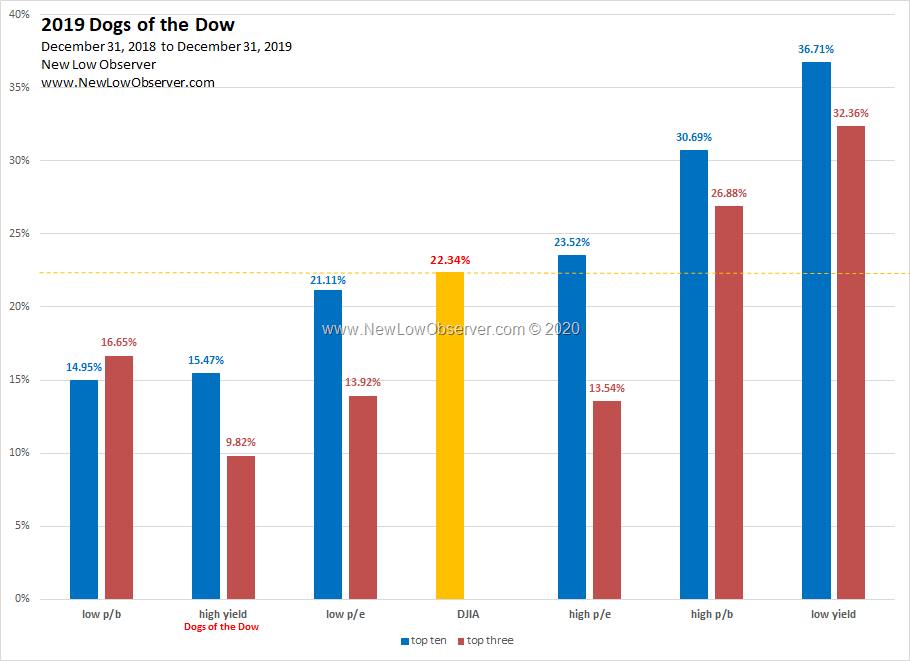
In 2019, the Dogs of the Dow (high yield) failed to exceed the performance of the Dow Jones Industrial Average. In addition, the Dogs of the Dow (high yield) severely underperformed the low yield stocks by a margin of +15%.
Our commentary from the January 2019 Dogs of the Dow watch list had the following to say:
“Our preference is for stocks in the highest p/e or lowest yield stocks.”
While the top 3 stocks in the high p/e category underperformed the Dow Jones Industrial Average with a gain of +13.54%, the low yield group crushed the index with gains of +36.71% and +32.36%.
1996-2019 Long-Term Performance
Below is our long-term performance of the Dogs of the Dow from 1996 to 2019 for both the top ten and top 3 stocks for the respective categories.
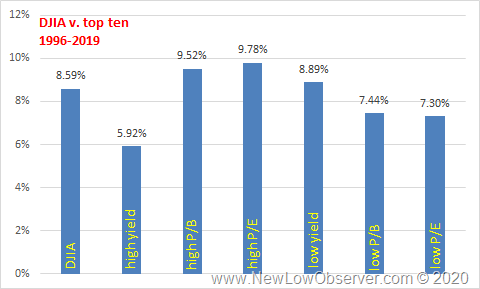
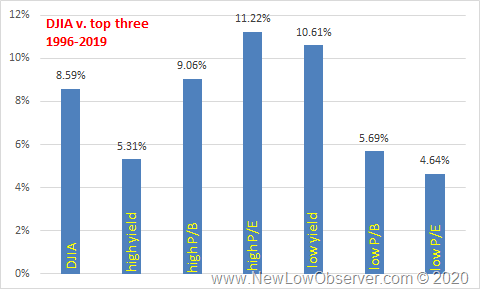
As is the case, the Dogs of the Dow (high yield) underperform the DJIA and the low yield category. High P/E stocks seem to win the day with above average gains on a long term basis. This is counter to the belief that investors should buy low p/e stocks.
see also:
Posted in Dogs of the Dow, Low Yield
Chart of the Day: Inverted Yields from 1800 to 1965
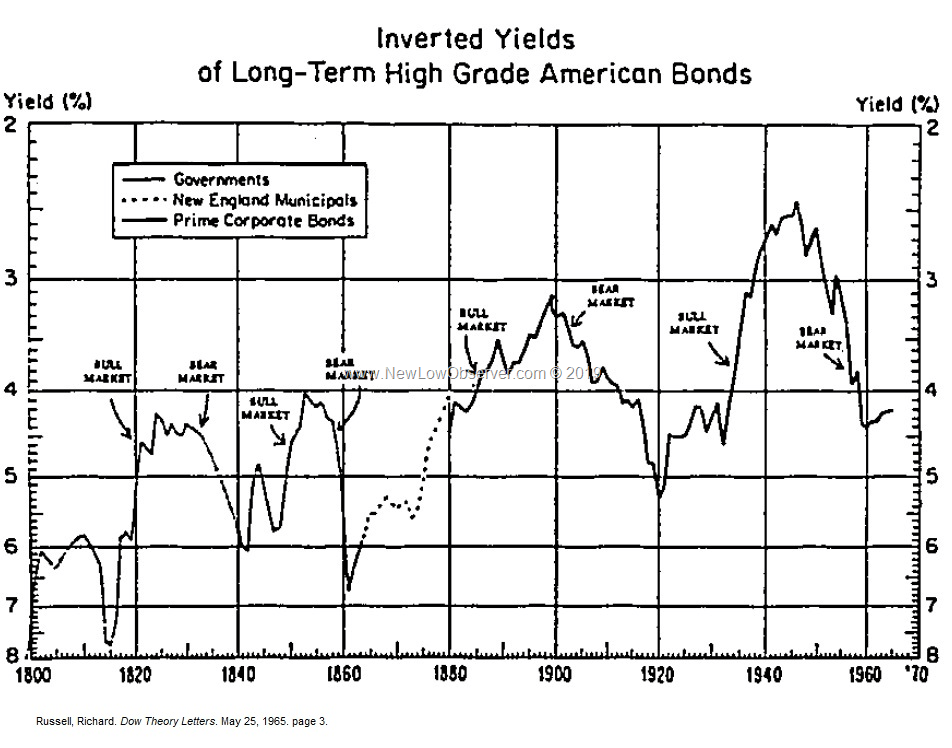
Below is a chart of inverted yields of American bonds as published in Richard Russell’s Dow Theory Letters on May 25, 1965. What is most conspicuous about this chart? The overall trend of lower highs (yields) and lower lows (yields).
Dogs of the Dow: Part 1
Based on the work of TradingTips.com, the following are the Dogs of the Dow (ten highest dividend yielding stocks) from November 4, 2016 and their performance as of November 15, 2017 (intraday):
| symbol | name | total return |
| PFE | Pfizer Inc. | 23.93% |
| CSCO | Cisco Systems, Inc. | 17.63% |
| KO | The Coca-Cola Company | 16.25% |
| VZ | Verizon Communications Inc. | -1.36% |
| MRK | Merck & Co., Inc. | -3.73% |
| XOM | Exxon Mobil Corporation | 2.01% |
| CAT | Caterpillar Inc. | 68.31% |
| CVX | Chevron Corporation | 15.81% |
| BA | The Boeing Company | 95.67% |
| IBM | IBM | 1.38% |
| Average % change | 23.59% |
TradingTips.com also published a subset of the above list called the Small Dogs. (five lowest priced of the above 10 stocks). Those stocks from November 4, 2016 to November 15, 2017 (intraday) have had the following performance:
| symbol | name | total return |
| PFE | Pfizer Inc. | 23.93% |
| CSCO | Cisco Systems, Inc. | 17.63% |
| KO | The Coca-Cola Company | 16.25% |
| VZ | Verizon Communications Inc. | -1.36% |
| MRK | Merck & Co., Inc. | -3.73% |
| Average % change | 10.54% |
Below, we have generated the average performance of the top 3 Dow Jones Industrial Average (DJIA) stocks in the listed categories From November 4, 2016 to November 15, 2017 (intraday). The results show a considerable contradiction to the conventional wisdom on this topic.
Comparing Two Dividend Strategies: Redux
Two years ago, we created a dividend watch list and compared that list to the one created by Scott’s Investments at around the same period of time. Both stock lists were generated after the close of market on Friday October 8, 2010 and before the stock market opened on Monday October 11, 2010. A month and a half after the lists were created, we submitted an article titled “Comparing Two Dividend Strategies” in which we compared the relative performance of both lists. The stock list created by Scott’s Investments was focused on companies that had dividend yields of 4% or greater. The stock list that we created had a focus on companies that have had a dividend increasing policy of ten years or more and were within 20% of their respective 52-week low.
Understandably, some argued that it was disingenuous to compare two stocks lists after such a short period of time. For this reason, we are presenting the performance of the same two lists to see if there are any nuances or changes that we need to make in our initial assessment about the performance of the stock lists created on the weekend of October 8, 2010.
As was done in our November 17, 2010 article comparing both stock lists, we will compare the top eleven companies on the New Low Observer list (found here) to the eleven companies that were provided by Scott’s Investments in the article titled “11 High Yield stocks Worth Considering Now.” The comparison of the two lists will cover the period from October 8, 2010 to October 5, 2012 based on capital appreciation for the purpose of comparing to the S&P 500, Nasdaq 100 and Dow Jones Industrial Average. Additionally, we will provide to the total return of both lists to determine which approach yielded the most favorable returns.
The first list that we’ll review is Scott’s Investments with the following 11 companies:
| Symbol | Name | 10/8/2010 | 10/5/2012 | Cap. Appr. | total return |
| (Q) | Qwest Inc. (acquired) | 6.34 | 6.02 | -5.05% | -5.05% |
| (MO) | Altria Group Inc. | 22.77 | 34 | 49.32% | 55.18% |
| (FTR) | Frontier Communications | 7.4 | 4.77 | -35.54% | -30.67% |
| (PGN) | Progress Energy Inc. (acquired) | 42.28 | 47.48 | 12.30% | 12.30% |
| (POM) | Pepco Holdings, Inc. | 17.8 | 19.37 | 8.82% | 13.47% |
| (WIN) | Windstream Corporation | 11.01 | 10.17 | -7.63% | -0.97% |
| (CTL) | CenturyLink, Inc. | 36.32 | 39.82 | 9.64% | 15.72% |
| (SO) | Southern Company | 35.54 | 45.97 | 29.35% | 33.48% |
| (TEG) | Integrys Energy Group, Inc. | 49.55 | 55.2 | 11.40% | 15.65% |
| (CNP) | CenterPoint Energy, Inc. | 15.23 | 21.41 | 40.58% | 44.96% |
| (HCP) | HCP, Inc. | 34.02 | 45.51 | 33.77% | 38.50% |
| average return | 13.36% | 17.51% |
The standout performers from the Scott’s Investments list were Altria Group (MO) with a total return of +55.18% and CenterPoint Energy (CNP) with a gain of +44.96%. Both stocks exceeded the returns of the Nasdaq 100 in the same period of time indicating that even dividend stocks can generate the high returns necessary beat even the majority of the top high growth stocks. The stocks that underperformed were Frontier Communications (FTR) which lost –30.67%, Qwest Inc. (Q) with a loss of –5.05% and Windstream Corp. (WIN) with a loss of –0.97%. The recurrent theme of rural and non-traditional telecommunication companies suggests the hard times that these companies may have had since October 2010.
The average return of Scott’s Investments list based on capital appreciation was +13.36% and +17.51% on a total return basis. This compares to the Dow Jones Industrial Average rising +23.66% and the S&P 500 index returning +25.39%, on a capital appreciation basis.
The next list is the New Low Observer with the following companies:
| Symbol | Name | 10/8/2010 | 10/5/2012 | Cap. Appr. | total return |
| (CL) | Colgate-Palmolive Co. | 71.95 | 108.45 | 50.73% | 52.57% |
| (CAG) | ConAgra Foods, Inc. | 20.85 | 27.79 | 33.29% | 37.17% |
| (NTRS) | Northern Trust Corp. | 46.84 | 47.35 | 1.09% | 3.14% |
| (WST) | West Pharmaceutical | 34.22 | 53.73 | 57.01% | 58.31% |
| (BBT) | BB&T Corp. | 22.71 | 33.64 | 48.13% | 50.92% |
| (MDT) | Medtronic | 32.39 | 44.67 | 37.91% | 40.52% |
| (BEC) | Beckman Coulter (acquired) | 47.78 | 83.5 | 74.76% | 74.76% |
| (SBSI) | Southside Bancshares | 17.86 | 21.91 | 22.68% | 33.52% |
| (USB) | U.S. BanCorp. | 21.84 | 34.92 | 59.89% | 62.87% |
| (WAFD) | Washington Federal | 14.95 | 16.72 | 11.84% | 12.90% |
| (FUL) | HB Fuller Company | 19.96 | 30.77 | 54.16% | 55.40% |
| average return | 41.04% | 43.82% |
The top performing stocks on a total return basis were Beckman Coulter (BEC) with +74.76%, U.S. Bancorp. (USB) with +62.87% and West Pharmaceutical (WST) with 58.31%. The worst performing stocks were Northern Trust (NTRS) at +3.14% and Washington Federal (WAFD) at +12.90%.
The average return of the New Low Observer list of stocks based on capital appreciation was +41.04% and +43.82% on a total return basis. The average return of the New Low Observer list of stocks exceeded the return of the Nasdaq 100 (QQQ), Dow Industrials (DIA) and S&P 500 (SPY) by +2.32%, +17,38% and +15.65%, respectively.
A very important distinction is that Scott’s Investments was indicated to be for the purposes of trading and not necessarily to be held for the long-term. Conceivably, the list by Scott’s Investments could have been bought and sold at substantial gains already. However, as the title of the article highlighted high yield stocks, we believe that there was an implied need to hold the stocks for an extended period of time in order to achieve the maximum benefit. With the aforementioned thoughts in mind, special attention should be directed to the total returns of the stocks with high yields as compared to the low yield dividend stocks on the New Low Observer list.
The high yield stocks, although sporting an average yield of 6.25% at the time the article was published, generated at total return that was less than half that of the New Low Observer list with an average yield of 2.31%. It wasn’t as if the companies on Scott’s Investments list were considerably better or worse than those on the New Low Observer list. However, from our work on the topic, high yielding stocks typically result in lower average returns especially when examined over longer periods of time.
This concept of high yielding stocks generating lower returns presents a challenge because some investors have no choice but to seek out high yield investments to meet their immediate financial needs. However, without a strict criteria for choosing high yield investments, some stocks offer the siren song of mediocre total returns. In addition, the longevity of the high yield can be compromised due to excessive payout ratios and detrimental borrowing simply for the purpose of sustaining a high dividend yield. Alternatively, low yield stocks can generate high quality total returns that warrant a second look, as long as the immediate need for substantial income is not the goal.
The primary purpose of examining any stock list is to isolate outstanding strategies that can be easily replicated and applied. Because successful investing hinges on time and total return, it becomes essential for new and seasoned investors to understand the strategies that work consistently as early as possible, in order to increase total return. We believe that the success of great investors like Warren Buffett, Peter Lynch, John Templeton and Shelby Collum Davis lies not only in the strategy that they employed but how early they were able to recognize the strength of such an investment approach.
As this examination attempts to demonstrate, choosing stocks that have a history of dividend increases and near a new 52-week low provides a superior starting point for investors who are not in need of immediate income. Additionally, those who seek stocks that have high yields need to accept the potential trade-off of lower total returns.
Posted in Low Yield, Scott's Investments
Low Yielding Stocks Offer Exceptional Gains
As a reaction to the sting of the stock market decline from October 2007 to March 2009, there has been a mad rush by many investors to seek safety by investing in high yield stocks. The problem with investing in high yield stocks is that high yield almost literally means higher risk. This concept is especially true when an investor cannot differentiate between high and low quality stocks in general. What few investors realize is that stocks that generate “low” dividend yields tend to make up for it with above average price appreciation.
Unfortunately, a person who is bound and determined to get the highest yield possible is more likely to select a stock that will not stand the test of time as oppose to selecting a company that, although sporting a high yield, has a reputation of good management and a long history of dividend increases like my favorite Dividend Achievers from Mergent’s. Even more striking is the fact that low yielding, high quality, Dividend Achievers run circles around their high quality, high yielding brethren.
A great summary on the misguided effort of buying high yield stocks is titled “Investing in High-Yield Stocks” by Dividends4Life (D4L) at SeekingAlpha.com. In the article, the author cites data that shows the immense trade-offs when trying to obtain the highest yields available without regard to quality. D4L later goes on to name some of the very best high quality, high yielding stocks that are part of the Dividend Achiever index of stocks.
In an effort to demonstrate the power and conviction of the idea that high quality, low yielding stocks make up for what they lack in yield, I have compiled a list of current and former Dividend Achievers with dividend yields below 3% that have appreciated in value by at least 60%. This list does not include financial (banks, brokerage, and insurance) companies since most, if not all, increased in proportion to their exaggerated declines. Also, this list of stocks excludes non-financial companies that have increased in value more than 30% to 59%. Having so many companies on the list would only overstate the obvious.
|
Symbol
|
Name | Price | Yield | % Up |
| XEC | Cimarex Energy Co | $64.42 | 0.50% | 157.06% |
| HP | Helmerich & Payne, Inc. | $42.76 | 0.50% | 60.51% |
| GCI | Gannett Co., Inc. | $18.28 | 0.90% | 509.33% |
| HOG | Harley-Davidson, Inc. | $35.22 | 1.10% | 134.96% |
| NDSN | Nordson Corp | $75.58 | 1.10% | 120.80% |
| ROST | Ross Stores, Inc. | $58.40 | 1.10% | 68.11% |
| HRC | Hill-Rom Holdings Inc | $31.55 | 1.30% | 177.97% |
| SCL | Stepan Co | $74.79 | 1.30% | 113.44% |
| TJX | TJX Co, Inc. | $47.69 | 1.30% | 79.15% |
| TDS | Tel and Data Systems, Inc | $35.42 | 1.30% | 60.93% |
| WWW | Wolverine World Wide, Inc. | $31.50 | 1.40% | 75.00% |
| FO | Fortune Brands, Inc. | $53.73 | 1.40% | 70.14% |
| FELE | Franklin Electric Co., Inc. | $35.40 | 1.40% | 64.65% |
| JWN | Nordstrom, Inc. | $45.34 | 1.50% | 149.81% |
| JCI | Johnson Controls, Inc. | $35.01 | 1.50% | 100.98% |
| FAST | Fastenal Co | $55.71 | 1.50% | 90.46% |
| AOS | A.O. Smith Corp | $52.87 | 1.50% | 88.62% |
| PH | Parker-Hannifin Corp | $70.44 | 1.50% | 78.19% |
| TNC | Tennant Co | $34.86 | 1.60% | 147.76% |
| CSL | Carlisle Companies | $40.75 | 1.60% | 100.54% |
| MAS | Masco Corp | $18.10 | 1.70% | 122.09% |
| SWWC | Southwest Water | $10.55 | 1.90% | 144.21% |
| BGG | Briggs & Stratton Corp | $22.57 | 2.00% | 75.10% |
| SWK | Stanley Black & Decker | $63.00 | 2.10% | 101.92% |
| BRC | Brady Corp | $33.29 | 2.10% | 79.46% |
| TFX | Teleflex Inc | $64.46 | 2.10% | 65.41% |
| PNR | Pentair, Inc | $37.85 | 2.10% | 63.15% |
| AVY | Avery Dennison Corp | $38.57 | 2.10% | 62.40% |
| HHS | Harte-Hanks, Inc. | $13.88 | 2.20% | 112.88% |
| DOV | Dover Corp | $50.25 | 2.20% | 70.05% |
| SJM | J.M. Smucker Co | $63.01 | 2.20% | 67.71% |
| GD | General Dynamics Corp | $78.21 | 2.20% | 64.27% |
| UTX | United Technologies Corp | $76.43 | 2.30% | 65.22% |
| NC | NACCO Industries, Inc. | $86.59 | 2.40% | 219.64% |
| FSS | Federal Signal Corp | $10.01 | 2.40% | 84.35% |
| ITW | Illinois Tool Works Inc. | $52.35 | 2.40% | 66.30% |
| CAT | Caterpillar, Inc. | $67.51 | 2.50% | 124.96% |
| MDP | Meredith Corp | $37.01 | 2.50% | 93.16% |
| ACO | Amcol Intl | $30.60 | 2.50% | 89.47% |
| NFG | National Fuel Gas Co | $53.10 | 2.50% | 73.76% |
| MMM | 3M Co | $86.05 | 2.50% | 64.82% |
| EMR | Emerson Electric Co | $52.59 | 2.60% | 73.34% |
| PII | Polaris Industries Inc. | $63.99 | 2.70% | 141.11% |
| HD | Home Depot, Inc. | $35.72 | 2.70% | 60.40% |
| KWR | Quaker Chemical Corp | $32.54 | 2.90% | 211.98% |
| LYTS | LSI Industries Inc. | $6.89 | 2.90% | 66.02% |
| VFC | V.F. Corp Co. | $86.84 | 2.90% | 63.02% |
The average performance of the above 47 low yielding stocks exceeded the 1-year gain (April 23, 2009 to April 23, 2010) in the Dow Industrials by 64%, the Nasdaq Composite by 53% and the S&P 500 Composite by 75%. Although all of the stocks on this list had much higher dividend yields one year ago, they certainly weren’t the “must have” high yield stocks that everyone was clamoring for.
It should be noted that there is a distinct difference between a high yield and a high paying out of company earnings to meet the quarterly dividend payments (also known as payout ratio.) A high dividend yield is derived from the amount of the dividend payment in relation to the current market price of the stock. If a stock is selling for $10 and earnings are $12 per share with the dividend payment at $2, then the dividend yield is 20% and the payout ratio is 16%. However, if the same company with the same dividend payment has earnings per share of $2.05, then the yield is still 20% but the payout ratio is 98%. Although a 20% dividend yield is extremely high, it is unclear how sustainable the dividend is, especially with earnings at $12 per share. However, with a payout ratio of 98%, the likelihood of the dividend being cut is almost guaranteed. It is just a matter of time.
Please note that the New Low Observer team does not endorse the purchase of the 47 companies mentioned above. Our strongest conviction lies in the selected companies that are on our Dividend Achiever Watch List for the week ending on April 23, 2010.
Investing Notes:
- Avoid stocks with high payout ratios
- Don’t ignore low yielding, high quality stocks
Email our team here.