
- Japan
- Market Indicator
- Price Momentum Indicators
- Richard Russell
- Silver
- Speed Resistance Lines
- U.S. Dividend Watch List
Category Archives: iShares Silver Trust
Silver: India and China as a Catalyst
In a September 28, 1929 BusinessWeek article titled, “Silver Is Cheap” is the following commentary:
“The price of silver fell to $0.50375 U. S. cents per fine Troy ounce, the lowest price touched since Sept. 18, 1915.”
“India and China are the markets for the silver of the world and, as they prosper or keep the peace, silver rise[s]…”

The argument for India and China as a catalyst for the potential rise in the price of precious metals has been around for a long time. However, the reality is very different from what is hoped for.
see also:
Posted in iShares Silver Trust, Silver
Silver: August 2020
On August 25, 2019, we presented upside resistance targets for the price of silver. In that posting, we said the following:
“The above levels are where the price of silver should experience a reversal of the rising trend. The more dramatic the rise the greater chance that silver will decline -66% of the current rise.”
At two of the three target ranges, the price of silver experienced reversals. In the first instance falling from $19.81 to $11.81, approximately -40%.

The second reversal seems to be playing out from the $29.26 level.
We can’t emphasize enough the fact that Silver isn’t the topic here, it is price. If it trades with a price attached to it on a regular basis then there are reasonable levels at which to expect reversals on the way up or down. The work of Charles H. Dow and Edson Gould inform us on what to focus on when observing price.
Above is an inset chart of the price of Silver with the upside resistance targets. Below, we provide a full chart of the price of Silver with the upside resistance target prices. Also, we review the downside targets based on the run-up from the March 18, 2020 low to the $29.26 high. These targets will assist in managing risk. Continue reading
Silver: August 2019
Review
On May 5, 2011, when the iShares Silver Trust (SLV) was trading at $34.39, we said the following:
“What remains is a high level of uncertainty for (SLV) going forward. However, in general, we should see SLV tread water for a brief period of time before falling back to the prior low which began with the current run back in November 2008. Dow Theory suggests that a reasonable buying opportunity would exist at below line B (blue line B). However, we wouldn’t jump in at the slightest move below line B. Instead, we’d like to see the price decline to the dashed blue line at $15.41 or below.”
The chart below highlights the points of interest on the iShares Silver Trust (SLV) based on the peak price, the date we gave downside targets and the first date that the price of SLV closed below our target of $15.41.

Since our May 5, 2011 posting, SLV has not exceeded the prior peak of $47.26. Additionally, SLV has reached the $15.41 level and has outlined a significant basing pattern at that price point. Using the price of silver, we will outline the upside resistance targets based on the December 2015 low. Continue reading
Silver: Downside Targets Met
As early as May 5, 2011, when silver was trading at $35 an ounce, we’ve maintained the view that the prospect of silver, in the form of the exchange traded fund iShares Silver Trust (SLV), falling below $20 was well within the realm of possibility (article here). At the time, we said the following: Continue reading
Posted in Charles H. Dow, Dow Theory, Edson Gould, iShares Silver Trust, Silver, SLV, speed resistance line
Tagged members
Correction of Errors on iShares Silver Trust (SLV) Interpretation
In our previous reviews of the iShares Silver Trust (SLV) (found here), we attempted to apply Dow Theory to the price movement of SLV. However, we have made an error in our analysis that has resulted in arriving at the wrong conclusion of the price potentially declining to the previous low that was established at the beginning of the bull market run on November 21, 2008 at $9.02.
Instead, we are revising our analysis to reflect that the price of silver may decline as low as $21.02 if it were to replicate the rise and decline from October 2001 to November 2008.This revision should provide a more qualitative view on the future prospects for both SLV and the price of silver.
As background to the error that was made, we first must explain that the iShares Silver Trust (SLV) is supposed to track the price of silver. However, SLV has only been in existence since April 2006.Our Dow Theory analysis of SLV was incorrect because we didn’t have an appropriate starting point, the previous low, to arrive at a correct downside target. The previous low occurred in 2001 which was long before SLV began trading.
This resulted in the mistaken belief that SLV should be expected to go back to the low of 2008 at $9.02. To remedy our error, we have obtained the price of silver from the last major low in the price, and re-ran our Dow Theory analysis. The chart below provides the three downside targets from the March 17, 2008 high of $20.99.
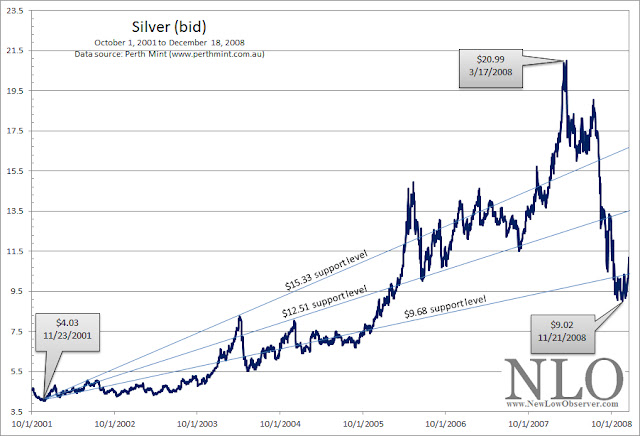
The downside targets from the peak were as follows:
-
$15.33
-
$12.51 (50%principle)
-
$9.68
In the final outcome, the price of silver fell below the third downside target of $9.68, ultimately resting at the $9.02 level before making the ascent to the recent high of $48.35.This sets the stage for our analysis of the current price action.
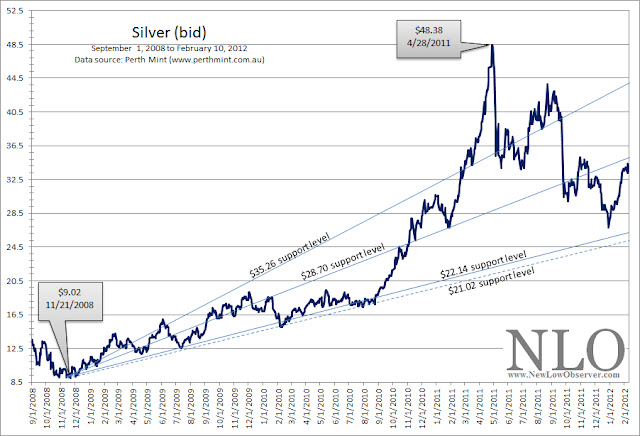
Our current Dow Theory analysis involves the period from the November 21, 2008 low at $9.02 to the peak of April 28, 2011 at the $48.38 level. The downside targets are as follows:
-
$28.70 (50%principle)
-
$22.14
-
$21.02
It should be noticed in the chart below that as time passes, the support levels increase which exerts greater pressure on the price to either rise substantially or breakdown.
Despite the revision to our numbers, our previous analysis about the expected outcome has remained accurate.Our May 5, 2011 article was on target with the claim that SLV would trade in a range before falling much further. SLV traded in a range until mid-July and ultimately fell as low as $26.16, a drop of -30.87% since that article was written.
The current indications suggest that SLV will fall as the $22.14 support level. Because silver easily fell to the third support level in the period from 2001 to 2008 (within the context of a precious metal bull market), we expect that the $21.02 is a realistic worst case scenario to watch for. We will consider buying silver and related derivatives at $22.25 and below.
We view the most recent rise from the December 2011 low as running out of steam.Therefore, the rising resistance level established at $28.70 appears to be firmly in place…for now.
Posted in Dow Theory, Error, gold, iShares Silver Trust, SLV
iShares Silver Trust (SLV) Update
The iShares Silver Trust (SLV) ETF has fallen in line with our assessment from May 5, 2011. However, it is times like these that we get nervous about our ability to believe that the price action of SLV will continue on a forecast that was presented over six months ago. Back in May, we said the following:
“…we should see SLV tread water for a brief period of time before falling back to the prior low which began with the current run back in November 2008. Dow Theory suggests that a reasonable buying opportunity would exist at [or] below line B (blue line B).”
Currently, the “blue line B” is around $24.31 and rising as time passes. In our May Dow Theory interpretation of SLV, the price fell right through line B in 2008 without any hesitation. We’re not so certain that such action will occur this time around. As long as SLV can hold above the Dow Theory fair value of $28.15, there is a good chance silver will be able to rebound in a meaningful fashion. However, closing below $28.15 (again) could be a confirmation of the downtrend.
Many precious metal enthusiasts are arguing that what happened in 2008 was an outlier event for silver and therefore is unlikely to happen this time around. It is hard to argue against such a view. However, it is difficult to get the period from 1974 to 1976 out our mind (visual here) when gold fell 50% and gold stocks fell 66% in the middle a gold bull market.
Below is our updated chart of SLV reflecting the most recent price action:
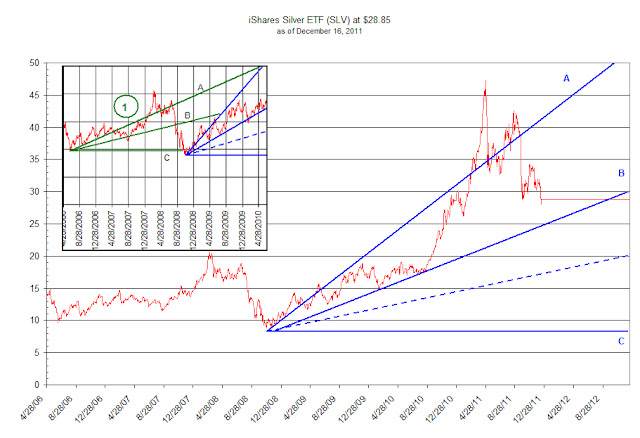
The Punchline: If you like the idea of investing in silver, then a buying opportunity should be at/or below the blue line B ($24.31). However, don’t go all in, just in case the dashed blue line does materialize at $17.
-
iShares Silver Trust (SLV) Debrief, May 5, 2011
iShares Silver Trust (SLV) Debrief
On April 14, 2011, we provided what we believed to be the downside target for the Philadelphia Gold and Silver Index (XAU) in anticipation of the current decline that is taking place using Edson Gould’s speed resistance lines (article here). Although appearing to be very similar, there is a distinct difference between Gould’s resistance lines and Charles Dow’s 1/3 support levels. Gould’s lines have support levels based on 1/3 of high while Dow’s support levels are based on 1/3 the difference between the prior bottom and the most recent high.
In this review we’re going to tackle the trading pattern of the very controversial iShares Silver Trust (SLV). In the chart below we have drawn the Dow Theory support levels where the price of iShares Silver Trust (SLV) is likely to revert to as part of a normal reaction. As a point of clarification, according to Dow Theory, a bear market does not begin until the index or stock falls by at least 1/3 of the prior rise. In the case of (SLV), today’s closing price at $33.72 heralds what is sufficiently below the first support $34.52 and should be considered to be a bear market.
Although this could be considered a bear market based on Dow Theory, we only need to look back to 2008 to know how quickly and viciously a bear market in precious metals can begin and end. The precious metals bear market of 2008 crushed the XAU gold and silver stock index with a 68% decline in eight months. During the same time, the iShares Silver Trust (SLV) declined slightly more that 55%.
Bear market or not, some observations are worth considering. First, in the chart below, the overall pattern of the price decline in (SLV) for the Dow Theory indication numbered 1 (in green) is very similar to the current decline represented with the Dow Theory indication numbered 2 (in blue). Since Dow Theory works on a relative basis, once initiated at a major low, the signals provided are not confused through the distortions of large or small numbers. Headlines about SLV having declines of historic proportions are grossly exaggerated if there is no comparison on a percentage basis and compared to prior declines.
Second, at the beginning of each run at point 1 and 2, the price of SLV bounced off of the middle line B (also known as the 2/3 support line) before going parabolic.
Finally, the decline from each peak was rapid and vicious. One-third of the prior rise was wiped out in a matter of days after the peak.
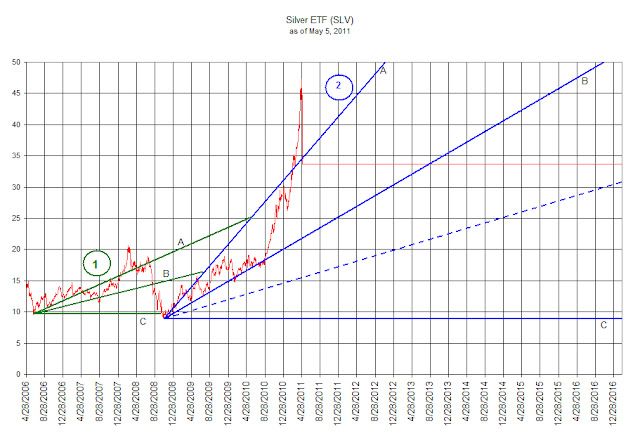
What remains is a high level of uncertainty for (SLV) going forward. However, in general, we should see SLV tread water for a brief period of time before falling back to the prior low which began with the current run back in November 2008. Dow Theory suggests that a reasonable buying opportunity would exist at below line B (blue line B). However, we wouldn’t jump in at the slightest move below line B. Instead, we’d like to see the price decline to the dashed blue line at $15.41 or below.
Posted in Dow Theory, Edson Gould, gold, iShares Silver Trust, Silver, SLV, XAU