
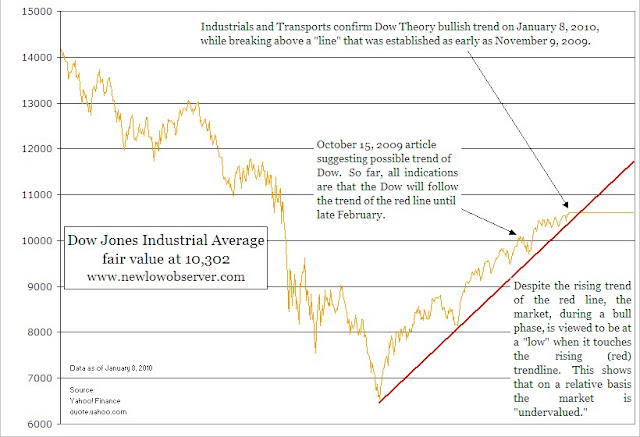
On January 8, 2010, the Dow Industrials and the Dow Transports confirmed the Dow theory cyclical bull market trend of the stock market. The significance of this is that we can expect the Dow Industrials to head much higher in spite of the threat of future economic uncertainties. Below are the recent charts for the Dow Transports and the Dow Industrials.
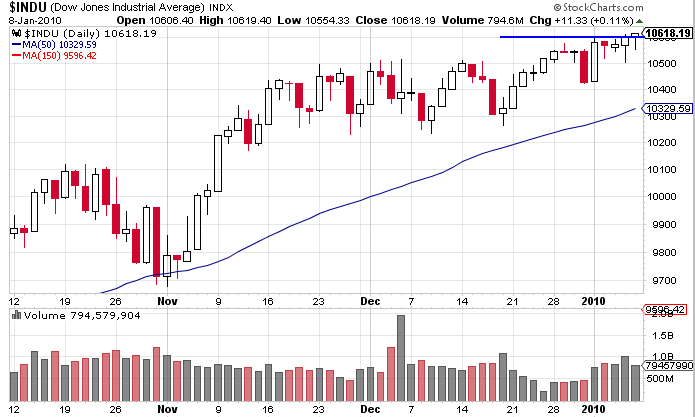
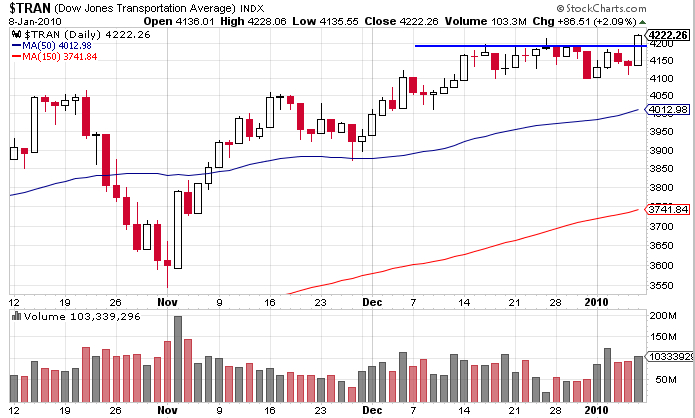
According to Dow Theory, the formation of a line can act as the equivalent of a market decline or secondary reaction in a bull market if it lasts for over eight weeks. In this instance, the line lasted exactly 8 weeks. I’m hesitant to accept that the “rule” of 8 weeks can be trusted altogether. However, the upward bias of the market has indicated that the most recent breakout will be followed until proven otherwise. It is important to note that secondary reactions act as a release valve from built-up pressure in the market. The fact that the market has responded by breaking above the line that had been drawn indicates that the market has successfully absorbed the large amount of shares that have been distributed by corporations as well as the negative economic news since the March 2009 low.
Because the Dow Industrials and the Dow Transports have both broken to brand new highs at the same time, along with the fact that the Dow Industrials have broken above the line that has been drawn since November 9, 2009, we can safely guess that the market has little desire to go lower and that the bull market is still in place.
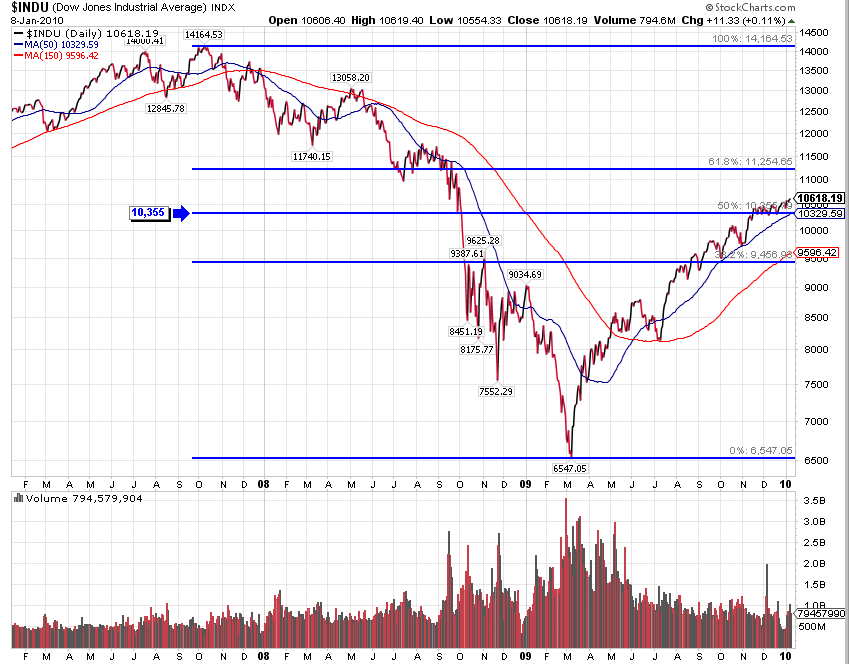
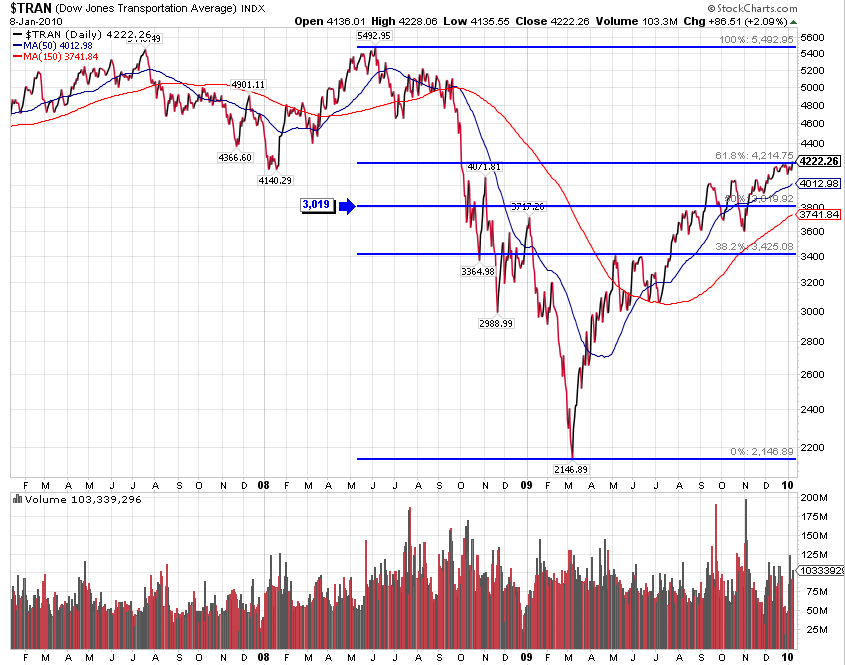
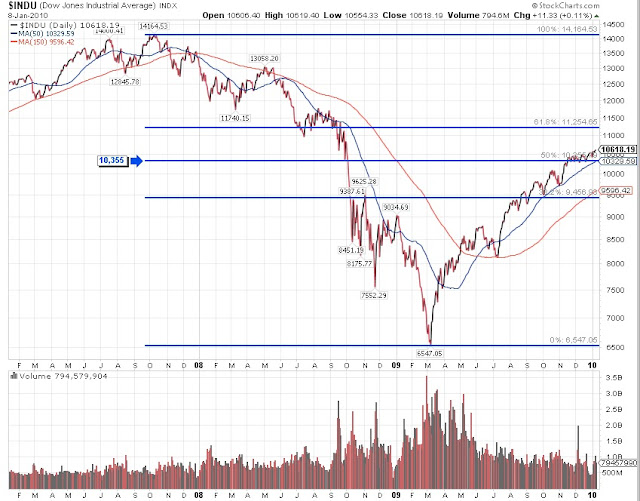
Below are the charts of the Dow Industrials and Dow Transports retracements from their respective peaks in 2007. The Dow Industrials have retraced more than 50% of the prior peak while the Transports have retraced more than 60% of the prior peak. This suggests a possible move to retest the high of 14,000 and 5,400. According to Charles Dow, if the market can retrace more than half of the prior move, it (the market) will likely go to the old level that was previously established. One way this was demonstrated was during the decline from October 2007 to March 2009. The decline that took place accelerated significantly once the Dow Industrials exceeded 50% of the rise from September 2002 to October 2007. Likewise, we should be on the lookout for a similar accelerated rise in the market on the way to 14,000.
Since writing the article on October 15, 2009, the Dow Industrials have remained above the upward (red) trendline (see chart below.) I continue to believe that the strongest resistance for the market will be when the Dow Industrials get to 10,700. At this juncture, the Dow Industrials will either break out to the upside in dramatic fashion or retrace back to 9,500. However, given the strong indications from the Dow Industrials and Dow Transports on Friday, I suspect that we can reach 12,000 not long after the month of February 2010.
