Source: New York Times. October 7, 2008. page F4.
- Japan
- Market Indicator
- Price Momentum Indicators
- Richard Russell
- Silver
- Speed Resistance Lines
- U.S. Dividend Watch List

Source: New York Times. October 7, 2008. page F4.
Posted in AIG, Bear Stearns, Fannie Mae, FNM, FNMA, FRE, Freddie Mac, Merrill, Wachovia, WaMu
Advocates for the bailout of Boeing (BA) are citing the “black swan” event of COVID-19 as the reason the company has reached the tipping point of failure. These same people are saying that, in spite of Boeing:
The company is too big to fail because the cascade of job losses throughout the entire U.S. economy would be catastrophic.

We’d argue that demise of Boeing began near the February 20, 2018 period. We don’t know why it occurred at that time, However, the stock had run out of upside momentum and vacillated between the $356.66 price since that time.
The most recent decline is the culmination of the collective wisdom of the markets which decided after March 4, 2019 that the fate of the company had been determined.
As with the bank and auto bailouts of 2008, the belief is that there doesn’t exist the capacity of the largest and most broadly developed economy in the world to absorb the loss of such a big company. Thanks to the bailout to come, we will continue to never know.
Performance Review
This is a review of the nearly 1-year performance of the Insurance Watch List from February 21, 2016.

On the whole, the analyst estimates for insurance stocks were on target. Although AmTrust Financial Services (AFSI) did not come close to the estimated gain projected on February 2016, at least the price of the stock did not register a loss in the period of time covered.
“The problems of tomorrow are being created today as we write this letter. Furthermore, there are risks in the balance sheets that we cannot see. Companies such as Fannie Mae (FNM), Freddie Mac (FRE) and American International Group (AIG) are now showing financial strains from previous actions taken to enhance the look of their financial reports. We are also concerned that many of these companies have used financial derivatives that are totally unanalyzable by outsiders, since there is insufficient information disclosed in their financial statements for a risk assessment.”
Robert L. Rodriguez. Letter to Shareholders. April 16, 2005. Page 4.
Posted in AIG, Fannie Mae, FNM, FRE, Freddie Mac, Robert Rodriguez
|
Symbol
|
Close date
|
Total % Gain | % of Portfolio | |||
|
(FDO)
|
|
1/31/2008
|
|
10.65%
|
|
96.67%
|
|
(WSC)
|
|
2/11/2008
|
|
-3.93%
|
|
94.28%
|
|
(AIG)
|
|
2/28/2008
|
|
12.52%
|
|
82.65%
|
|
(CTAS)
|
|
3/13/2008
|
|
-3.81%
|
|
29.43%
|
|
(CDE)
|
|
3/13/2008
|
|
-12.42%
|
|
1.91%
|
|
(BSC)
|
|
3/14/2008
|
|
7.33%
|
|
26.10%
|
|
(HTX)
|
|
3/24/2008
|
|
1.73%
|
|
29.52%
|
|
(KGC)
|
|
3/24/2008
|
|
-16.73%
|
|
38.15%
|
|
(CTAS)
|
|
4/16/2008
|
|
-4.34%
|
|
31.11%
|
|
(GSS)
|
|
4/16/2008
|
|
-13.21%
|
|
1.77%
|
|
(NC)
|
|
7/23/2008
|
|
27.30%
|
|
32.11%
|
|
(MSA)
|
|
8/11/2008
|
|
19.02%
|
|
36.71%
|
|
(WIN)
|
|
8/14/2008
|
|
5.55%
|
|
27.27%
|
|
(BGG)
|
|
8/27/2008
|
|
1.27%
|
|
31.38%
|
|
(ANAT)
|
|
9/9/2008
|
|
-11.64%
|
|
28.26%
|
|
(EXPD)
|
|
9/9/2008
|
|
-5.51%
|
|
33.01%
|
|
(HPQ)
|
|
9/9/2008
|
|
115.03%
|
|
0.07%
|
|
(NSEC)
|
|
9/9/2008
|
|
-17.36%
|
|
3.08%
|
|
(TDS)
|
|
9/9/2008
|
|
-3.97%
|
|
38.10%
|
|
(NEM)
|
|
9/17/2008
|
|
3.27%
|
|
32.03%
|
|
(HL)
|
|
9/18/2008
|
|
5.70%
|
|
39.06%
|
|
(AIG)
|
|
9/23/2008
|
|
33.94%
|
|
38.27%
|
|
(ANAT)
|
|
9/29/2008
|
|
2.80%
|
|
29.25%
|
|
(ADM)
|
|
9/30/2008
|
|
-8.43%
|
|
20.77%
|
|
(WAG)
|
|
9/30/2008
|
|
-1.75%
|
|
44.09%
|
|
(TMR)
|
|
10/7/2008
|
|
-14.66%
|
|
11.36%
|
|
(NXG)
|
|
10/7/2008
|
|
-12.72%
|
|
11.40%
|
|
(AEM)
|
|
10/10/2008
|
|
-3.03%
|
|
15.58%
|
|
(FNM)
|
|
10/10/2008
|
|
-46.25%
|
|
7.14%
|
|
(GSS)
|
|
10/10/2008
|
|
-8.66%
|
|
12.11%
|
|
(JOF)
|
|
10/14/2008
|
|
2.34%
|
|
22.18%
|
|
(DOG)
|
|
10/15/2008
|
|
1.14%
|
|
43.23%
|
|
(AIG)
|
|
10/20/2008
|
|
-2.55%
|
|
66.35%
|
|
(BMI)
|
|
10/22/2008
|
|
-5.40%
|
|
35.38%
|
|
(EUM)
|
|
10/27/2008
|
|
5.26%
|
|
46.63%
|
|
(AEM)
|
|
10/28/2008
|
|
-4.08%
|
|
25.83%
|
|
(ABX)
|
|
10/28/2008
|
|
-2.92%
|
|
24.26%
|
|
(CTL)
|
|
10/31/2008
|
|
-9.93%
|
|
34.18%
|
|
(NC)
|
|
10/31/2008
|
|
-0.14%
|
|
43.42%
|
|
(NC)
|
|
11/7/2008
|
|
-12.16%
|
|
49.47%
|
Related Articles:
Please revisit Dividend Inc. for editing and revisions to this post.
Comments Off on AIG Trading Notes
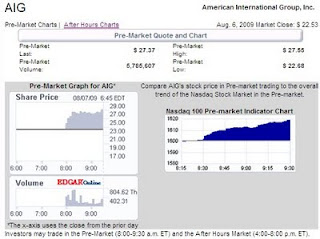
Posted in After Hours, AIG, pre-market, trading notes