Author Archives: NLObserver Team

Article Flashback: April 20, 2009

Below is my response to a critic of my April 20, 2009 article about how past management of the Dow Jones Industrial constituents had contributed significantly to the declines in the market from 1929 to 1932. I feel that this response is so instructive about stock indexes and the crash of 1929 that all my new readers should see it again for the first time.

According to this critic (SivBum) the purpose of an index is, "not to pick stocks with strength but to reflect the overall market place."

My response was the following:

"I completely agree with your comment that the purpose of the index isn't to pick stocks with strength but to reflect the overall market. However, you need strong companies to last long enough to actually reflect the market. Otherwise, the companies chosen would go out of business and then have to be be replaced. As you'll see below, many other stocks that went in and out of the index never were either obsolescent or bankrupt.

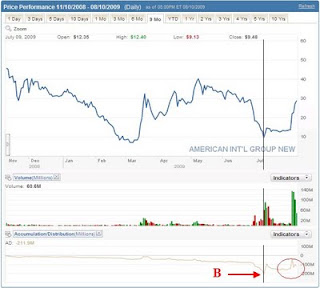
Although AIG has been nationalized it conceivably could still be in the index. After all, even though the railroads were nationalized in 1914 they still were part of the Dow-Jones Transportation Index.

Regarding changes to the Dow it should be noted that many companies have been added and dropped in the fashion of an inexperienced trader. Here are some notable examples:

  • American Tobacco was dropped in 1899 and added in 1924, was dropped in 1928 and replace with the American Tobacco B shares, B shares were dropped in 1930
  • General Electric was dropped in 1898, added in 1899, dropped in 1901, added 1907.
  • IBM was added in 1932, dropped in 1939, added in 1979
  • International Paper preferred shares were added in April 1901, dropped July 1901, common shares were added in 1956, dropped in 2004.
  • Remington Typewriter was added in 1925, dropped in 1927
  • Texaco or Texas Company was added in 1916, dropped in 1924, added in 1925, dropped in 1997.
  • Goodrich was added 1916, dropped in 1924, added in 1928, dropped in 1930.
  • Coca Cola was added in 1932, dropped in 1935, added in 1987.

The evidence seems to indicate that the managers of indices act like traders rather than trying to reflect the overall economy or market."

I have to thank the critics on Seeking Alpha for forcing me to go the extra mile in my research to make an even better point than I had set out to. Touc.


Please revisit Dividend Inc. for editing and revisions to this post.

Nasdaq 100 Watch List

Industrial Production Index

In my previous discussion of the Industrial Production Index (IPI), I clearly made a mistake in my interpretation of the “price” action of the index. On March 16, 2009, I said that if the IPI fell below 97.8399 then we would face the equivalent of economic “dark ages.”

In looking at the movement of the index, I dismissed the peak of 95.3271 on May 1998 and the trough of July 1998 as a significant technical support/resistance level for the index. This appears to be a critical oversight since the June 2009 low in the IPI at 95.4571 appears to have created a temporary support level. Even though the difference between 97.8399 and 95.4571 is only 2.32%, I feel it is necessary to identify this issue in my analysis as a potential learning opportunity.


Now for the shameless self-promotion, in my January 27, 2009 analysis of the IPI index, I said, "Based on this most recent move the IPI is expected to decline at least to the December 2001 level of 97.8399." This observation was about as accurate as you could get. Additionally, I said, “…we're in for at least another six months of declines in the IPI.” This assessment was off by 1 month which isn't bad. As mentioned before, the IPI hit a temporary bottom in June 2009. Some folks who snicker at the thought of technical analysis being applied to an economic indicator that isn’t even a critical component of the U.S. economy have every right to question the method. However, the fruitless effort, in this instance, “seems” to have been useful.

Finally, let’s look at where I think the IPI index is possibly going from here. In the 90-year history of the reporting of the IPI, there has been only one declining period in which the index had temporarily gone up and then down more than once (fake out.) We’ve already had one fake out of the index when it sharply rose in October of 2008 and then continued downward. I don’t see (revealing my limitations) this index falling below the current trough of 95.4571 until it does a Dow Theory retrace of at least one, and possibly all three, of the following upside targets:

  • 101.1035
  • 106.7499
  • 112.3963

Implicit in my discussion of the IPI is that we are at a turning point for the economy. Based on the combination of the Dow Theory confirmation of July 23, 2009 and the IPI turning up from the June low, I will have to guess that the National Bureau of Economic Research (NBER) is going to proclaim June 2009 as the official end to the recession. The end to this recession will be lackluster and questioned from all corners. Additionally, the stock market will only follow the pattern of a cyclical bull market (bear market rally) within a secular (long term) bear market. I doubt that the general public will agree that the recession is over since jobs will not be as plentiful as the past. However, from the standpoint of an economist the recession is over provided the IPI June low is sustained over an extended period of time.

Again, the IPI index generally lags the stock market by 6 to 9 months. Therefore, the index could continue to rise while the stock market has reversed to the downside. We’ll have to see just how much the most recent trough remains in place.Touc.

Monday's Article:

Dow Theory

Please revisit Dividend Inc. for editing and revisions to this post.

Dividend Achiever Watch List

The bull pushed the market up 227.41 points. The Dow closed at a yearly high of 9,505.96. My watch list shrank from 13 to 7 companies this week as the market pushed majority of the stocks above 20% range from the low. Here are the companies on my watch list as of August 21, 2009.

Cardinal Health (CAH): Right on Target

Like a bevy of bobby sock teenagers chasing their heartthrob crooner, analysts and reporters are falling all over themselves to point out the glowing earnings forecast of Cardinal Health (CAH.) Even the Cramer folks were crooning about CAH, too bad they're charging for information ex post. Any surprise to us? Naw, my June 4, 2009 research recommendation pointed out the obvious at a time when it was most useful to you. At the time, I was so stunned by the quality of the company I went so far as to say:

"Either the books are being cooked or this stock is ridiculously underpriced."

I went out on a limb with that remark but it was clear that, with a company that had increased its dividend every year for 12 years in a row, the quality of earnings wasn't an aberration. Just my luck, I issued a sell recommendation on July 29th. After all, I'm in pursuit of "fair profits" rather than holding and hoping. I love to sell my stocks to a frantic buying public. Rereading my June 4th post has a lot of insights that might be useful for new readers to my blog.

Again, research recommendations are meant to alert investors to potential long term opportunities while sell recommendations are intended to deal with the short term reality of the market. Touc.

Please revisit Dividend Inc. for editing and revisions to this post.

Becton Dickinson (BDX): On Our Radar First

It was no fluke that we pointed out Becton Dickinson (BDX) on our May 4, 2009 posting. Now we find that Warren Buffett was acquiring shares of BDX on June 30th at a price that was 16% above the price on May 4th. Using the strategy that has been outlined numerous times on this blog, I have noticed that, whenever Buffett has been reported buying domestic stocks they are companies that I have either purchased or researching almost 50% of the time. Too bad we recommended selling the stock on May 31st after an 11% gain. The good news is that if you didn't catch the boat the first time around then you can still buy the stock below the sell recommendation price.

When a company, in this case BDX, promises a dividend of 2.17% and the gain in the price is 500% what you could have earned if you held the stock for a whole year then the best thing to do is move on. This blog makes no illusions about the realities of the stock market. Research recommendations are meant to alert investors to potential long term opportunities while sell recommendations are intended to deal with the short term reality of the market. Touc.

"If people with either large or small capital would look upon trading in stocks as an attempt to get 12 per cent per annum on their money instead of 50 per cent weekly, they would come out a good deal better in the long run."

William Peter Hamilton. The Stock Market Barometer. 1922. p. 257.


Please revisit Dividend Inc. for editing and revisions to this post.

Dividend Achiever Watch List

This was a volatile week for those who follow the market. We had a wild swing in the Dow which jumped from below 9,250 to above 9,400. At the end of the week, we are down 47 points. My watch list rose from 10 to 13 companies. Although the bottom three are marginally above 20%, they are great blue chip names that I can't leave them out. Here are the companies on my watch list as of August 14, 2009.

The companies that are within 10% of the low offer a great opportunity.
I flagged you to Becton Dickinson (BDX) last week in my watch list. It turns out that Warren Buffett is looking at the same thing. See this link for the related news.

Freddie Mac (FRE) Trading Notes

When it comes to the cornering of a stock there are two kinds, those that fail and those that succeed. The essential element that causes the failure is the inability to get the public to "buy in" to the market action. The movement of Freddie Mac (FRE) today appears to be on the side of those who are behind the cornering of the stock.

Market activity for Freddie Mac (FRE) was off the charts today, rising $0.49 or 66% in the pre-market session on almost 18 million shares and rising another 37% on 391 million in the regular hours of trading. This equals a combined increase, from Friday's closing price of $0.74, of 128%. (pre-market data below)

Chart Source: Nasdaq.com

There is a distinction between the price movement of FRE and AIG. Although both are moving on syndicates' pre-market prompting, the FRE cornering of the stock may have the ability to succeed at keeping the price high for an extended period of time. Notice in the chart below that the accumulation/distribution of the stock had gone from the extremely negative low of -319 million (red arrow at point A) to a positive figure (green arrow at point A) based on the activity of today's trading.

Chart Source: Schwab.com
Contrast the movement of FRE's accumulation/distribution with the that of AIG. While both accumulation lines hit their lowest point on July 24th, the day after the Dow Theory bull market confirmation, AIG has not yet broken above the accumulation line (red circle.) Additionally, as AIG has gone up in price the volume has trended down.

Chart Source: Schwab.com
The AIG run does not look "sustainable" over the long term unless the accumulation/distribution improves along with a rising price and rising volume. For traders, it is expected that FRE will have a pullback, however there may be legs on this speculation as compared to AIG.
Because we're in a cyclical bull market within an even larger bear market I would consider these stocks as pure speculation regardless of the "potential" upside. Let's see which of the syndicates that are running these stocks up in pre/post market activity comes out the winner. From what I can tell, the FRE gang is miles ahead of the AIG crew in this race. This should be interesting to watch. Touc.

related articles:

Please revisit Dividend Inc. for editing and revisions to this post.

Nasdaq 100 Watch List

Dividend Achiever Watch List

An amazing company came on my watch list this week. That company is Proctor & Gamble (PG). After reporting a bad quarter, the stock fell 3% on Wednesday and followed by another 4.5% drop on Thursday. Here are the companies on my watch list as of August 7, 2009.
In addition to PG, another great name is Becton Dickinson (BDX) which raised its fiscal 2009 profit outlook on 7/30/09.

AIG Trading Notes

Today, AIG traded up a whopping 20.46% on volume of 101,064,355 shares. On the surface of it this seems like a resounding vote of confidence for a company that is 80% owned by U.S. taxpayers. However, beneath the surface lies a murky story waiting to be told.

The story waiting to come out is that on Thurday August 6, 2009, AIG had a closing price of $22.53. During "Pre-market" trading Friday August 7th, AIG went from $22.53 to $27.37, a gain of 21.48%. The volume of shares traded during the "Pre-market" was 5,785,607 (after hour thumbnail.)

Once the regular hours of trading began on Friday August 7, 2009 the price of AIG actually fell from the $27.37 pre-market level to finally close at $27.14. Again, the regular hours of trading volume was 101,064,355.

What does all this mean? Over 5 million shares moved the price from $22.53 to $27.37. Once the regular market opened the public battled it out to come to the conclusion that the $27.37 wasn't the right price. Over 100 million only impacted the price by $0.23 lower than what 5 million was able to do by increasing the price over 20%.

My conclusion is that the public has less confidence in the future prospects for this company, and possibly the stock market, than the pre-market participants would have us believe. I also noticed that in after-hours trading the price rose an additional $0.08 on volume of 244,363 shares. Ain't it funny, 244,363 shares can raise the stock $0.08 while 100 million results in a loss of $0.23. The pre-market and after-market traders are gaming the system.

It appears that if you want to be a "trader" then you need to be entering and exiting the market before or after regular market hours. Otherwise, I would be cautious about dealing in this stock and any other stocks that are so easily managed based on so few participants. Conversely, if you're a "long term" investor then be ready to sell on a moments notice using market orders only. If you use a stop order to sell at the price of $27 then it is likely that you could get stopped out at $24 instead of $26.99 or thereabout if the stock trades down in the pre-market on Monday (wouldn't be surprised if this happens.) Touc.

Source:

Related Articles:

Please revisit Dividend Inc. for editing and revisions to this post.

This blog is being featured on www.condron.us, I hope you find this useful

Sell Bank of Hawaii (BOH) at the Market

It is now time to recommend that Bank of Hawaii (BOH) be sold at the market. The stock has performed modestly since the research recommendation was issued on January 12, 2009. It is highly recommended that anyone who bought the stock based on my research should re-read the posting. The stock took a huge dive in early March, it is hoped that shares of BOH were bought somewhere below the recommendation price.

From the current level, BOH is likely to continue higher as the current deflationary spiral ends and an inflationary environment begins. If you believe that inflation is coming down the road then the Japanese economy has typically performed better during inflation. Growth in the Japanese economy has typically meant growth in the Hawaiian economy. Additionally, BOH has held up very well in the banking crisis that just past and is poised to reach the $45 level, especially because we just got a Dow Theory cyclical bull market signal (within a larger secular bear market.) In the pursuit of "seeking fair profits" the returns that this stock has provided within the last 207 days say that it is worthwhile considering alternative opportunities.
BOH was recommended when it was trading at $37.76. As of August 6, 2009, BOH was quoted at $40.98. This equals a total return (dividends plus appreciation) of 11.36% in a little over 7 months. Conservatively, on an annualized basis this would equal approximately 19.47% return. Selling this stock now also generates a return 4 times greater than the amount of the dividend yield if the stock was held for a whole year.

It is always recommended that when selling a stock, one should not place an order after hours or when the market is closed. This leaves the seller in the position of being vulnerable to the whims of the market makers. Instead, place your sell orders only as a market order during market hours. Some would complain that a market order during market hours might leave some profits on the table. However, I would rather leave some money on the table rather than have it taken away from me by the trades that are placed by institutions and market makers. Touc.


Please revisit Dividend Inc. for editing and revisions to this post.

After-Hour Conundrum

The first after-hour profile is Applied Material (AMAT). In the screen shot below we see that AMAT has a market capitalization of $18.3 billion. During market hours on August 5th, we see that the stock traded down by 1.51% or $0.21. Over the last 3 months, AMAT has had average daily volume of 21 million shares.

In the screen shot below, we see that in after-hour trading AMAT traded up by exactly $0.21 bringing the price right back to where it started in the beginning of the day. Notice that during the after-hour trading it took only 160,000 shares to offset 12,303,994 shares traded during regular hours. Also notice that four trades equaled 73% of the total after-hour volume.
What I'd like to know is this, who is holding 48,252 worth of AMAT shares valued at $663,465? Why does anyone who owns so many shares try to sell them at a time when they wouldn't likely get the best price available? Who is matching up these trades?
Next up is Cognizant Technology Solutions (CTSH). Below we see that CTSH traded up by $0.99 on trading volume of 9,503,064. 
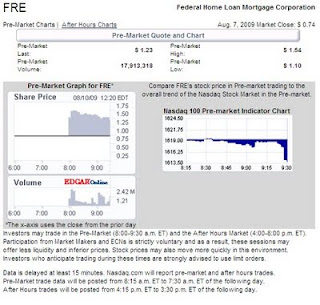
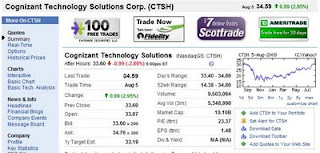
However, during after-hour session we can see that CTSH trades back down by $0.99. It only took 99,202 shares to get the price exactly back to where it started earlier in the day.
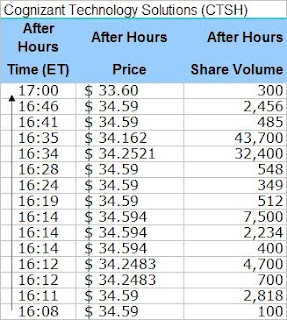
Again, notice that someone with 43,700 shares worth $1,468,966 decided that after-hours was the best time to unload the shares. Not to be outdone, someone else with 32,400 shares valued at $1,109,768 feels like getting rid of their shares.

Conclusion

From my experience routing trades to the floor of the NYSE in the mid-90's, these transactions are suspect. After all, who would try to unload so many shares without disrupting the market price. In the case of Cognizant Solutions, the 43,700 shares sold was 44% of all after-hour trading. such a large proportion of trading volume would normally spike the price up or down dramatically. Strangely, there was someone willing to obtain the odd number of shares after-hours. This is a highly unusual transaction for so many shares at a time when the market is so illiquid. In fact, most of the After Hours Activity that I have posted show similar patterns.
My suspicion is that institution(s) are accumulating short/long positions as the price of the stock rises during the regular hours. Once the market closes, the same institution sell/buy the shares to/from themselves or a related party. Additionally, options for the stock could have been purchased, sold or written in anticipation of the expected change in price after-hours. This is definitely something that is worth investigating further to determine how these transactions are being carried out. Not to mention the fact that the shares are rising and falling by exactly the opposite amount that took place during regular market hours.
Sources:
 

Sell Matthews International (MATW) at the Market

It is now time to recommend that Matthews International (MATW) be sold at the market. The stock has performed reasonably since the research recommendation was issued on March 31, 2009. It is highly recommended that anyone who bought the stock based on my research should re-read the posting. The stock took a tiny dip in mid-April, however the recommendation was essentially at the low for the stock price. From the current level, MATW is poised to reach the second upside target of $40.77, especially because we just got a Dow Theory cyclical bull market signal (within a larger secular bear market.) In the pursuit of "seeking fair profits" the returns that this stock has provided within the last 126 days say that it is worthwhile considering alternative opportunities .
MATW was recommended when it was trading at $29.04. As of August 3, 2009, MATW was quoted at $31.95. This equals a return of 10.25% in a little over 4 months. Conservatively, on an annualized basis this would equal approximately 29% return. Selling this stock now also generates a return 11 times greater than the amount of the dividend yield if the stock was held for a whole year.

It is always recommended that when selling a stock, one should not place an order after hours or when the market is closed. This leaves the seller in the position of being vulnerable to the whims of the market makers. Instead, place your sell orders only as a market order during market hours. Some would complain that a market order during market hours might leave some profits on the table. However, I would rather leave some money on the table rather than have it taken away from me by the trades that are placed by institutions and market makers. Touc.


Please revisit Dividend Inc. for editing and revisions to this post.

Another Market Anomaly

As strange as it might seem, the following companies (excel format) traded down or up in after-hours trading in the exact dollar amount that they traded up or down during the regular hours of trading. This is exactly what I mentioned took place August 29, 2008.

These aren't small cap companies that we're talking about. These are large companies with reasonable amounts of market volume during the regular hours. How is it that all the activity of the masses can be so easily off-set by marginal volume after hours to go back from whence they came? Since the article on the same topic was posted last year, it was posited that maybe traders were balancing their books and therefore it really wasn't all that significant after all. Others said that because all of these sources get their data from the same place it really didn't matter how many sources I procured.

First, the balancing of market maker books needs to take place during market hours unless there is a crash in the market and the volume cannot be handle in the normal fashion. Second, after hour balancing of the books in this fashion should be considered market manipulation to the ordinary citizens who bought or sold their stock during the regular trading hours. Third, I chose to confirm the data from as many sources as possible to verify that it is accurate.

At best this should be considered manipulation and at worst it should be considered stealing, especially since the records of these after-hour transactions are lost in the normal course of market trading. When everybody wakes up tomorrow there will be no record of what happened during after hours trading.

After hours trading needs to be stopped or the records of these transactions should be widely available to the public in a fashion that can be tracked over time. Touc.

  • AMER ST WATER AWR
  • Autodesk, Inc. ADSK
  • BancFirst Corporation BANF
  • BRADY CP CL A BRC
  • BRIGGS STRATTON DC BGG
  • C.H. Robinson Worldwide, Inc. CHRW
  • CIMAREX ENERGY CO XEC
  • Cintas Corporation CTAS
  • CITIGROUP INC C
  • COMMUNITY BK SYS INC CBU
  • EMERSON ELEC CO EMR
  • Expeditors International of Was EXPD
  • FIRST COMMONWLTH FIN FCF
  • Fulton Financial Corporation FULT
  • Harleysville Group Inc. HGIC
  • HARSCO CP HSC
  • HEINZ H J CO HNZ
  • HILL-ROM HOLDINGS IN HRC
  • IBERIABANK Corporation IBKC
  • ILL TOOL WORKS INC ITW
  • INTEGRYS ENERGY GRP TEG
  • MERCK CO INC MRK
  • Meridian Bioscience Inc. VIVO
  • MINE SAFETY APPL MSA
  • MYERS INDS INC MYE
  • Otter Tail Corporation OTTR
  • OWENS AND MINOR INC OMI
  • PENTAIR INC PNR
  • PITNEY BOWES INC PBI
  • QUESTAR CP STR
  • S J W CP SJW
  • S&T Bancorp, Inc. STBA
  • Sigma-Aldrich Corporation SIAL
  • SMITH A O CORP AOS
  • STEPAN CO. SCL
  • SUPERIOR IND INTL SUP
  • TAUBMAN CENTERS INC TCO
  • TELEFLEX INC TFX
  • TENNANT CO TNC
  • TOTAL SYSTEM SVC INC TSS
  • Universal Forest Products, Inc. UFPI
  • Urban Outfitters, Inc. URBN
  • Vertex Pharmaceuticals Incorpor VRTX
  • Warner Chilcott Limited WCRX

Sample Data Sources:


Please revisit Dividend Inc. for editing and revisions to this post.
This blog is being featured on www.condron.us, I hope you find this useful.