Author Archives: NLObserver Team

Dow Theory

In reading The Stock Market Barometer by William Peter Hamilton, I find that there is significant contribution to the topic of Dow Theory. It is Hamilton’s book that led to the even better The Dow Theory and Dow’s Theory Applied to Business and Banking by Robert Rhea. One area of contention is my belief that Charles H. Dow was absolutely right about double tops and double bottoms. Hamilton, in reference to double tops and double bottoms, says:

“In the same editorial (Wall Street Journal, 1/4/1902) Dow goes on to give a useful definition from which legitimate inferences may drawn. He says: ...

‘It is a bull period as long as the average of one high point exceeds that of previous high points. It is a bear period when the low point becomes lower than the previous low points. It is often difficult to judge whether the end of an advance has come because the movement of prices is that which would occur if the main tendency had changed. Yet, it may only be an unusually pronounced secondary movement.’

This passage contains, by implication, both the idea of ‘double tops’ and ‘double bottoms’ (which I frankly confess I have not found essential or greatly useful) and the idea of a ‘line,’ as shown in the narrow fluctuation of the averages over a recognized period, necessarily one either of accumulation or distribution.”

Hamilton, William Peter. Stock Market Barometer. Harper and Brothers. 1922. page 32.

In my May 15, 2009 article, I pointed out how important double tops and double bottoms have played a role in defining the direction of the Industrials and Transports. So important is the role of double tops and double bottoms that they have accounted for 72% of the major bull and bear moves in the stock market. The current market action, since May 1st, has been in favor of double tops and bottoms in the Transports index portending the change in the market direction in the intermediate term.

As you can see from the chart below, there have been two double tops and two double bottoms. So far, both double bottoms (B and C) and one double top (A) have been followed by sizable moves in the Transportation and Industrial index.

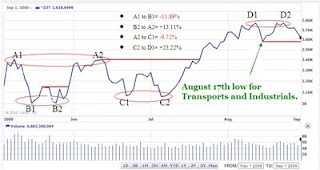
Currently, we're faced with the double top indicated as D1 and D2. From what I can tell, if the decline from D2 goes any further below the August 17th low then we may retrace up to 75% of the gains from C2 to D1. This assessment is based on the prior correction of A2 to C1 from the rise of B2 to A2. On the way down to C2 there are smaller support levels however their significance is not as pronounced as the percentage change from A2 to C1. We should assume the worst case scenario and expect that the Transports will go to 3239.36. Falling to points C1 and B1 would be the next order of operation.

Interestingly, Charles H. Dow says that the action of double tops and double bottoms is most commonly associated with market manipulation. In Hamilton's Stock Market Barometer there is a July 20, 1901 Wall Street Journal excerpt where Dow says:

"Another method [for detecting manipulation] is what is called the theory of double tops. Records of trading show that in many cases when a stock reaches top it will have a moderate decline and then go back again to near the highest figures. If after such a move, the price again recedes, it is liable to decline some distance."

Hamilton, William Peter. Stock Market Barometer. Harper and Brothers. 1922. page 36.

The method described by Dow is commonly executed by institutions and other large money interests. The term that is most often used today is called a trial balloon. If successful, the money interests can gauge small investors willingness to sell or buy stocks and then execute a bull or bear raid. Today, it would seem unheard of for the editor of the Wall Street Journal to suggest there is manipulation and then go so far as tell how to detect it. And yet, the words of Charles H. Dow ring true today as they did in early 1900.

Note: On August 25th I said that the great Dow Theorist Richard Russell was wrong about his call of a new or renewed bull market. Well, after placing a call to Russell and talking to his staff the bull market indication was taken away the very next day and a non-confirmation was iterated. I'm sure that Mr. Russell got many calls on that error so I don't think that I swayed him personally (though I'd love to think that I did.)

My goal wasn't to have the bull market indication taken away, instead it was to demonstrate that a non-confirmation needed to be worked through. For this reason I still stand by my belief that the bullish move (within the context of secular bear market) from the March 9th low isn't over unless we resolutely pierce the 8146 level on the Dow Industrials. Touc.


Please revisit Dividend Inc. for editing and revisions to this post.

Gaming the Pre/After Hour Markets

The following are transactions that took place before and after the regular hours of trading which canceled out gains or losses of the regular hours of trading from the same day. The purpose of tracking this activity is to see if the trends or patterns can be established in the behavior of the related stocks or the general market. One conclusion that I've come to so far can be found in the following related articles:

Articles


Pre-Market Data
The following information demonstrates that low volume pre-market trading determines the closing price of high volume regular hour trading. In most instances, you can find traders are able to buy or sell large allotments of stock without affecting the pre-market price while small allotments can be seen to crush or inflate the price. This defies the basic economic principle of supply and demand affecting price.
  • August 21, 2009
  • August 20, 2009
  • August 17, 2009
  • August 10, 2009
After Hour Market Data
The following information demonstrates that low volume, after hour trading can undo or off-set all of the previous high volume regular hour trading. As mentioned before, you can find traders are able to buy or sell large allotments of stock without affecting the after hour price while small alloments can be seen to crush or inflate the price.
  • August 10, 2009
  • August 7, 2009
  • August 6, 2009
  • August 5, 2009
  • August 4, 2009
  • August 3, 2009
  • August 29, 2008

Coppock Curve Review

"Too much too soon." Those are the words of E.S.C. Coppock in describing the emotional state of the uninitiated investors response to the ups and downs of the stock market. The purpose of the Coppock Curve is to measure the emotional overreaction to the movement of the stock market.

Mr. Coppock observed that investors tend to ignore the fact that earnings are stable or rising and instead sell off a stock which is thought to be in trouble. Therefore, the monthly averaging of an index like the Dow Jones Industrials allows for better clarification of the what the price action is telling us.

So far the Coppock curve is indicating that, although we may not be at the bottom in the stock market, we are still in a relatively risk free period to invest in stocks. The following is the movement of the index from the lowest point since April 2009:

  • Apr 2009: -388
  • May 2009: -383
  • Jun 2009: -378
  • Jul 2009: -359
  • Aug 2009: -321

With the Coppock Curve indicating that we're at a relatively risk free period for stocks along with the Industrial Production Index moving up and the Dow Theory bull market indication of July 23rd, it appears that we could be on our way to higher levels in the stock market and the economy over an extended period of time. Dow Theory still has a pending non-confirmation to be worked through but I will not report on that until we get a resolute signal. Touc.

related articles:

Please revisit Dividend Inc. for editing and revisions to this post.

Reviewing the Stock Analysts

When I came up with the idea of writing about stock analysts, I thought about many of the negatives that I've observed over the years. After all, I've seen analyst ratings go from a buy to a hold overnight. In other instances, I've seen ratings on stocks lowered the same day that the stock was crashing. Analyst ratings never seemed to match up with the concept of offering foresight or depth of knowledge.

In doing my research on stock analysts, I realized that instead of focusing on those who got it wrong in their upgrades and downgrades, I would try to find those who got it right. This turned out to be like searching for a needle in a haystack. So many analysts were unclear on their ratings that I couldn't really use recommendations like neutral, accumulate, market perform and outperform.

Additionally, I couldn't use buy recommendations since they were a dime a dozen and possibly had more to do with investment banking relationships. For this reason, I was forced to track only the stock recommendations that had sell ratings. Sell recommendations comprise only 5% of all ratings issued. The performance of such ratings are easier to track with clear instructions of what to do with the stock and little in the way of issues like conflict of interest with a buy rating.

What I found was enlightening and refreshing. I found the sell recommendation of Select Comfort (SCSS) issued on August 30, 2007 by Matrix USA, LLC. Naturally, SCSS fell from the high of $17.09 to the most recent 52-week low of $0.19. The decline equaled 98.9% and has only risen to $3.25 as of August 28, 2009.

Clearly I was shooting ducks in a barrel because I went straight to where I knew the market was topping out to find clear sell recommendations. However, it is precisely the top of the market where few analysts are willing to issue outright sell recommendations.

When I looked for a little background on Matrix USA, I learned that it had already been a leader in quality buy and sell recommendations. Unfortunately, you cannot find Matrix USA LLC any longer but the former managing director Daniello Natoli was found to be working at EVA Dimensions LLC. Stern Stewart, Founder and CEO of EVA Dimensions, is the author of the book Quest for Value which outlines the principles behind economic value added (EVA) measurements for publicly traded companies. EVA is the model that helped Matrix USA LLC build a successful string of buy and sell recommendations.

Apparently, Matrix USA LLC no longer exists, however the ability to issue solid buy and sell recommendations makes the method that they utilized well worth investigating. This would be one time I could honestly say that the book Quest for Value might be a good "investment." Touc.

Please revisit Dividend Inc. for editing and revisions to this post.

Nasdaq 100 Watch List

Dividend Achiever Watch List

The market showed sign of weakness this week. After the Dow opened at 9,541.63, it managed to gain only 2.57 points ending the week at 9,544.20. My watch list shrank from 7 to 6 companies this week. For the first time, I do not have any company that is within 10% of the yearly low. My advice is to hold or begin taking some profit and wait for a better opportunity. Here are the companies on my watch list as of August 28, 2009.
Note: You may notice that I do not have any financial institutions on my watch list. That is because I feel that the financial sector is weak. There are many regional financial institutions on my list but I omitted them due to risk factor.

Cephalon Inc. (CEPH) at $56.61

Speculation Observation

Cephalon Inc. (CEPH), according to Yahoo!Finance is, "a biopharmaceutical company, engages in the discovery, development, and commercialization of products for central nervous system, inflammatory disease, pain, and oncology therapeutic areas."

The earnings history of this company is a train wreck filled with inconsistency. This, more than anything else, makes CEPH highly speculative. It seems that this company is still on the borderline of being an upstart biotech company and a major drug manufacturer. I don't understand how Valueline and Morningstar could attach such high expectations as $170 and $140 on the upper end.

This company is within 7.73% of the one year low. This situation may have many reasons why it is trading so close to the low however the technical pattern for this stock is very interesting. As indicated in the chart below, we see that CEPH has an upside down head-and-shoulder formation. In addition, the stock has an ascending low price (red line) that is about to converge with the descending high price (blue line.)

For whatever reason, this stock has the ability to make wide swings up and down within an overall declining trend of the market.

According to Dow Theory, this stock has the following downside targets:
  • $54.20
  • $14.40
  • $4.00
The fact that the stock hit a low of $52.55 recently and turned up could indicate that this stock has seen its bottom.

According to Value Line Investment Survey, CEPH has an average price to cash flow ratio of 14. After adjusting the price/cash flow downward from 95 million to 78 million diluted shares I got an average price of $66.92. This means that the stock is theoretically trading 18% below the average historical price.

However, if we don't adjust for the increase in shares from 78 million to 95 million then we get historical price of $81.62, a 44% difference from the historical average price. We always want to assume the worst in this scenario so we're going with the 18%.

Please check the fundamentals for this company to verify that you've got the guts to hold on to this stock were it to fall to the $39.80 level or lower. Good luck in your research of this company and remember that CEPH is highly speculative.

Art and Touc

Walgreen Co. (WAG): Sell at the Market

It is now time to recommend that Walgreen Co. (WAG) be sold at the market. The stock has severely underperformed since the research recommendation was issued on September 24, 2008. It is highly recommended that anyone who bought the stock based on my research should re-read the posting. It is hoped that the stock was researched and purchased well below the initiation price.

WAG has been on a steady rise since hitting a technical double bottom on March 9th 2009. At the current rate, WAG could easily breach the $39 level in the next few weeks. WAG is up an astounding 59% from the low in March. In the pursuit of "seeking fair profits" the returns that this stock has provided within the last 338 days say that it is necessary to consider alternative opportunities.

WAG was recommended when it was trading at $31. As of August 27, 2009, WAG was quoted at $33.83. This equals a compounded return of 11.03% in 11 months. Conservatively, this would equal approximately 11.91% return. Selling this stock now also generates a return of 6.23x greater than the amount of the dividend yield if the stock was held for that extra month.

As I have indicated in the purposes and function of this site, the goal is to:

  • maximize the annual yield of each trade.
  • reduce time between buying and selling of each stock.
  • exceed the annual yield of government guaranteed alternatives in each trade.


Sell recommendations are intended to deal with the short term reality of the market. The tracking of the Sell recommendations are the worst case scenario if you happen to have bought a stock at the time the research recommendation was made (please avoid making this mistake.) I aim for mediocrity in my returns, therefore I am happy with 9-12% annual gains. However, since codifying my approach to investing in 2005, I have had annual returns of 14% and above every year since.

It is always recommended that when selling a stock, one should not place stop orders, limit orders or orders after hours. This leaves the seller in the position of being vulnerable to the whims of the market makers. Instead, place your sell orders only as a market order during market hours. Some would complain that a market order during market hours might leave some profits on the table. However, I would rather leave some money on the table rather than have it taken away from me by the trades that are placed by institutions and market makers. Touc.


Please revisit Dividend Inc. for editing and revisions to this post.

A Well Reasoned Response

Today's posting is a rebuttal to my article on August 25th about Warren Buffett's seemingly conflicting stance on stocks and investing. I feel that this response is so important that everyone could learn from it. I will add my response in the comment section if you are interested.

By RandFan

"To be sure, investors are right to be wary of highly leveraged entities or businesses in weak competitive positions." -- Warren Buffett, from "Buy American, I Am."

Buffett's message has never changed over the years...but market conditions have....

"Even if you agree that the 12 percent equity coupon is more or less immutable, you still may hope to do well with it in the years ahead. It's conceivable that you will. After all, a lot of investors did well with it for a long time. But your future results will be governed by three variable's: the relationship between book value and market value, the tax rate, and the inflation rate." Warren Buffett, from "How Inflation Swindles the Equity Investor"

The author of "Will the Real Mr. Buffett Please Stand Up" is either a very sloppy student or a Sophist trying to stir up controversy. To make this argument, you have to make two fatal assumptions: 1) For the equity investor, 1977 is functionally equivalent to 2008 and, 2)An "equity investor" is functionally equivalent to a "value investor." Regarding the first fatal assumption: Market value to book value for many excellent companies was much lower in late 2008 than it was in 1977, so the "investor's equation" produced a different signal. Tax rates were also much higher in 1977 (and may not reach that level again for some time because of today's political climate--a point Buffett made recently in a NYTimes OP-ED piece)which effects return on book value and, thus, the results of the investor's equation.

Throughout his career, Buffett has allowed his disciples an audience to his life-long process of learning. He carries on "out loud" mental discussions with himself as he incorporates new, conflicting data into his world view and through a process of creative destruction strengthens his understanding. His 1977 article is, I think, simply an academic exercise for him. He just so happens to be letting the world in on it. He's going about the process of reconciling information which contradicted truisms that he had learned earlier in life from sources such as John Burr Williams' "The Theory of Investment Value," a book which I highly recommend to anyone who is interested in understanding what Buffett means by "the investor's equation." At any rate, long story short, this is just another pseudo-controversy about Buffett that boosts web-hits and proves that age-old frailty of man: Envy.

Please revisit Dividend Inc. for editing and revisions to this post.

Sell Bard Corp. (BCR) at the Market

It is now time to recommend that Bard Corp (BCR) be sold at the market. The stock has performed moderately since the research recommendation was issued on April 23, 2009. It is highly recommended that anyone who bought the stock based on my research should re-read the posting. It is hoped that the stock was researched and purchased well below the initiation price.

BCR has formed a powerful accumulation base which could indicate that the stock is headed much higher. BCR is among many of the medical device manufacturers that are being underpriced due to the debate about healthcare reform. In the pursuit of "seeking fair profits" the returns that this stock has provided within the last 126 days say that it is necessary to consider alternative opportunities.

BCR was recommended when it was trading at $71.28. As of August 26, 2009, BCR was quoted at $78.31. This equals a compounded return of 10.11% in a little over 4 months. Conservatively, this would equal approximately 29% return. Selling this stock now also generates a return of 10.64x greater than the amount of the dividend yield if the stock was held for a whole year.

As I have indicated in the purposes and function of this site, the goal is to:

  • maximize the annual yield of each trade.
  • reduce time between buying and selling of each stock.
  • exceed the annual yield of government guaranteed alternatives in each trade.

Research recommendations are intended to be a starting point for investigating a quality company at a reasonable price. It is hoped that after doing the background research you can buy the stock at a lower price. Ideally the stock should be held in a tax deferred account and should not consist of less than 20% of your holdings. Personally, I prefer holding only 2-3 stocks at a time.

Sell recommendations are intended to deal with the short term reality of the market. The tracking of the Sell recommendations are the worst case scenario if you happen to have bought a stock at the time the research recommendation was made (please avoid making this mistake.) I aim for mediocrity in my returns, therefore I am happy with 9-12% annual gains. However, since codifying my approach to investing in 2005, I have had annual returns of 14% and above every year since.

It is always recommended that when selling a stock, one should not place an order after hours or when the market is closed. This leaves the seller in the position of being vulnerable to the whims of the market makers. Instead, place your sell orders only as a market order during market hours. Some would complain that a market order during market hours might leave some profits on the table. However, I would rather leave some money on the table rather than have it taken away from me by the trades that are placed by institutions and market makers. Touc.


Please revisit Dividend Inc. for editing and revisions to this post.

Sell Sysco (SYY) at the Market

It is now time to recommend that Sysco (SYY) be sold at the market. The stock has underperformed since the research recommendation was issued on December 17, 2008. It is highly recommended that anyone who bought the stock based on my research should re-read the posting. It is hoped that the stock was researched and purchased well below the initiation price.

SYY has formed an upside down head and shoulders pattern which could indicate that the stock is headed much higher. SYY is the ultimate hedge against inflation and it may go as high as my first target price of $27.58. In the pursuit of "seeking fair profits" the returns that this stock has provided within the last 253 days say that it is necessary to consider alternative opportunities.

SYY was recommended when it was trading at $23.60. As of August 26, 2009, SYY was quoted at $25.34. This equals a compounded return of 10.85% in a little over 8 months. Conservatively, on an annualized basis this would equal approximately 15.65% return. Selling this stock now also generates a return 2.59x greater than the amount of the dividend yield if the stock was held for a whole year.

As I have indicated in the purposes and function of this site, the goal is to:

  • maximize the annual yield of each trade.
  • reduce time between buying and selling of each stock.
  • exceed the annual yield of government guaranteed alternatives in each trade.

Research recommendations are intended to be a starting point for investigating a quality company at a reasonable price. It is hoped that after doing the background research you can buy the stock at a lower price. Ideally the stock should be held in a tax deferred account and should not consist of less than 20% of your holdings. Personally, I prefer holding only 2-3 stocks at a time.

Sell recommendations are intended to deal with the short term reality of the market. The tracking of the Sell recommendations are the worst case scenario if you happen to have bought a stock at the time the research recommendation was made (please avoid making this mistake.) I aim for mediocrity in my returns, therefore I am happy with 9-12% annual gains. However, since codifying my approach to investing in 2005, I have had annual returns of 14% and above every year since.

It is always recommended that when selling a stock, one should not place an order after hours or when the market is closed. This leaves the seller in the position of being vulnerable to the whims of the market makers. Instead, place your sell orders only as a market order during market hours. Some would complain that a market order during market hours might leave some profits on the table. However, I would rather leave some money on the table rather than have it taken away from me by the trades that are placed by institutions and market makers. Touc.


Please revisit Dividend Inc. for editing and revisions to this post.

Dow Theory

The great Dow Theorist Richard Russell (www.dowtheoryletters.com) has indicated that based on today's market action we are now (again) in a bull market. This is after Mr. Russell had taken away his bullish stance from August 14, 2009 to August 24, 2009. While I respect Mr. Russell's over 50 year contribution to Dow Theory, the longest recorded history of Dow Theory from a single person, I have to disagree with the notion that we can say with confidence that the bullish indication needed to be taken out on the 14th and that we've achieved a confirmation of the trend today.

Regarding the matter of August 13th and 14th, on August 13th the Industrials and Transports both hit a new high (on a closing basis) from the March 9th low. On August 14th both indices fell in unison, achieving a temporary low on August 17th. However, what makes for a reversal of a bullish pattern according to Dow Theory is that both indices take out the point at which both indices initiated the bullish move to begin with. This means that both indexes would have had to fall below their respective July 23rd breakout levels. For the Industrials this would be the 8799.25 and for the Transports this would be 3404.11. The decline from the August 13th high never took out the levels that initiated the bull market indication.

It should be noted that on July 22nd, Richard Russell had a bear market indication at the end of the trading day. On July 23rd, Mr. Russell had a bull market indication prominently displayed at the end of the trading day. As I've said in the past, most if not all, Dow Theorist should come to the same conclusion at the same time. This is widely represented by searching "Dow Theory " and "July 23, 2009."

As I said in my July 24th Dow Theory commentary, what remains unresolved according to Dow Theory is the fact that the Dow Jones Transportation Average has not gone above the previous high of 3774.12 while the Industrials keep racking up new, albeit tepid on a percent basis, daily highs. What we have currently is what is known as a classic Dow Theory non-confirmation. This non-confirmation is resolved by the Transports exceeding 3774.12 along with the Industrials making a new high (above each previous high point since March 9th) or both indexes going below the breakout level that initiated the bull market.

I am hopeful that Mr. Russell will either correct me on my interpretation (giving me the chance to learn something new from the best) or that he revises his indication to reflect that the market is bullish with a pending non-confirmation that needs to be resolved. Touc.

Please revisit Dividend Inc. for editing and revisions to this post.

Will the Real Mr. Buffett Please Stand Up!

As an investor who has to take responsibility for my actions, I seek out as much information as I can. Although I am willing to take in as much information as possible, I attempt to discern quality from the junk, critically analyze the information and questioning my assumption along with the author that I’m reading. For this reason it did not go unnoticed when I read the October 16, 2008 New York Times op-ed piece written by Warren Buffett titled “Buy American. I Am.”

It turns out that in my zeal for seeking quality information, I found that Mr. Buffett had written an article in Fortune Magazine back in May of 1977 titled “How Inflation Swindles The Equity Investor.” If you didn’t know who the author was you’d probably think that the articles were written by two entirely different people.

In the article “How Inflation Swindles The Equity Investor,” Warren Buffett states in significant detail many reasons why and how inflation is the bane of equity investors. One such reason is that in order for companies to get through an inflationary period they are forced to issue new shares to service liabilities that had been accrued in prior years. This method of dealing with inflation was used to offset the payment of dividends.

In essence, a company would pay a dividend “…of $3.3 billion and asked investors to return $3.4 billion” (in the issuance of new stock). According to Mr. Buffett, the act of paying dividends and then issuing new stock exceeding the value dividend payments is among the problems that are part of the equity swindle. It should be known that Mr. Buffett’s article was extensive and left no doubt about the impact that inflation has on corporations.

Fast forward 31 years later, Mr. Buffett writes a concise op-ed piece in the New York Times titled “Buy American. I Am.” Published in the throes of a banking crisis, Mr. Buffett’s words were intended to provide assurance to a public that couldn’t trust either the banks, the government or regulators assigned to ensure stability in the financial system. Mr. Buffett points out that government policy to deal with the financial crisis “…will probably prove inflationary and therefore accelerate declines in the real value of cash…” Mr. Buffett goes on to suggest that individuals would be wise to invest in stocks.

I begin to wonder how an investor is supposed to make sense of the two articles. In the one case, Mr. Buffett offers an elaborate explanation for why equity investors are getting "swindled" during inflationary periods. In the other case, Mr. Buffett suggests that over the next ten years stocks will beat cash in a high inflation environment.

Is the only distinction that Mr. Buffett is making is the comparison between cash and stocks during inflation? If this is the case then we have to wonder which is the bigger swindle, cash that is being debased or stocks, where the management of a company can arbitrarily increase the number of shares denominated in a debased currency.

As far as I can tell, the last several months have had the largest increase in the issuance of secondary offerings (new stock) from major corporations. You'd think that Mr. Buffett would be speaking out about this based on his writings from the 1970's. I believe that I know which of the two articles is correct however, what is a person supposed to think when they hear the most successful investor in the world seemingly speak out of both sides of his mouth? I'm guessing that Mr. Buffett isn't expecting us to remember what he said 31 years ago.

“A patriot wraps himself around the flag to defend it; a scoundrel wraps it around himself to defend himself”

Sources:
  • Ellis, Charles. Classics: An Investor's Anthology. The Institute of Chartered Financial Analysts. 1989. p. 483.
  • Buffett, Warren. "Buy American. I Am." New York Times. October 16, 2008. accessed online August 21, 2009.

Suburban Propane (SPH) Says, "Just Add Water"

In a move that is not uncharacteristic of an overpriced stock, Suburban Propane Partners (SPH) has issued 2.2 million shares at a market price of $41.50. SPH, a 10 year-dividend achiever, might as well shout from the hilltops that they don't think their price can go much higher therefore if we can unload these share on the public then so much the better.

SPH basically said that it was going to pay down debt with the money raised from the sale of the stock. So what they're doing is watering down the stock (diluting per share earnings) in a maneuver known as "Robbing Peter to Pay Paul" method of accounting. You've got to admit, it is a great strategy from the perspective of the company with overvalued shares but current shareholders are getting the shaft. In a May 5th article, I pointed out that SPH was at a relatively high price and should be considered for selling, the recent issuance of shares is the final nail in that coffin.

By the way, who do we think is buying up all these dilutive shares? All the companies that were involved in the syndication like Wells Fargo Securities (WFC), BofA Merrill Lynch (BAC), Citi (C) and Goldman, Sachs & Co. (GS) distribute any unwanted shares to the mutual funds that they manage. In effect, the mutual fund shareholders become the neighborhood "chumps." Touc.


Please revisit Dividend Inc. for editing and revisions to this post.

Dow Theory

When it comes to Dow Theory, we have to carefully monitor the market to see if we get a clear sign of a non-confirmation of the trend. A non-confirmation of the trend can take place in many ways and is most prominent when one index goes up while the other goes down. Anyone interested in Dow Theory must be vigilant for signals that might indicate that a reversal of the primary or secondary trend is in the offing.

On Friday August 21, 2009, the Dow Jones Industrial Average (^DJI) exceeded the prior high of 9398.19 set on Wednesday August 12th. Unfortunately, the Dow Jones Transportation Index (^DJT) are lagging in the ability to exceed the high of 3774.12 set on Thursday August 13th. The only thing that favors the Transports in this instance is the fact that on a percentage basis the Transports rose 2.58% versus the Industrials 1.67% increase. This indicates that there is relatively strong interest in the Transports. Hopefully this enthusiasm will spill over into today's trading.

If the Transports do not break above the August 13th high then we might be on track for a non-confirmation. A non-confirmation means that the recent upward trend in the market will be coming to an end soon. Conversely, if the Transports break the indicated high while the Industrials move moderately higher then we could be in good shape for the short term.

Dow Theory Q & A

Q.When looking at a chart with weekly Dow prices, how is the weekly price calculated? Is it the Friday close or is it an average of the whole weeks close?

A. In all my readings of Dow Theory, I cannot remember anyone suggesting the use of weekly data for analysis. This doesn't mean that weekly data isn't useful, you might see a consistent pattern that I would otherwise overlook. Dow Theory is supposed to be calculated by using the closing price for both indices on a daily basis. I have bastardized Dow Theory by taking the high and low price of a given period as a way to get a sense of herd mentality or market psychology. This is in contrast to taking only the closing price.

Depending on the source, weekly data is calculated using the opening price from the open on Monday, the high and low price is from whichever days in the week that had either number and the closing price from the Friday close. An average of the week isn't how the weekly closing price is calculated. Touc.


Please revisit Dividend Inc. for editing and revisions to this post.