Author Archives: NLObserver Team

Dividend Achiever Watch List

The Dow continued to move higher this week and finished the week up 222.12 points (2.31%) higher.  At the end of the week, my watch list has 8 companies compared to 9 from the previous week. Here are the companies on my watch list as of September 18, 2009.

Inflation and Equity Investors

Back on 8/24/09, I wrote about Warren Buffett and his view on equity investment during inflationary time. Today write up offers an extended commentary and example of the situation.

Why Moderate Inflation is Beneficial
Let's assume you are an owner of a basketball team. You've just picked up a great young player and decided to sign him for a 5 years contract for $5 million per year (cost). You have a fixed cost of $25 million. It's now time to sell tickets (revenue). You do not fixed your ticket price. Every year, you raise them by inflation rate. As a result, your revenue increase at a faster pace than your cost which is fixed!
I understand that not all business is set up like a sports team, but most business operate using fixed cost model and thus the Fed try to target a moderate inflation rate.

Inflation and the Dow
What happen when stock price stay stagnant or trade in a range for years while economy slowly improve? Value are being created! Price stagnant while earning begin slowly improve. Market now become cheaper every year as earning slowly begin to improve because of moderate inflation. At some point, earning exceed a certain threshold creating an undervalued market which attracts buyers. This creates the beginning of bull market. The chart below shows the Dow plot against CPI.

You can see that the Dow did nothing until it broke to the upside in 1982.
Another illustration is when I compare the Dow to the GDP. Think of the Dow as the Price (P) then using GDP as the earning (E) of our entire economy. What you have is a P/E of our entire economy. The chart below shows that the Dow fluctuated while GDP rose slowly.

As are result, this is why our government wants inflation. However, the government cannot control the stock market. The market will move up with the right value is established. Most notable range is from 4%-6% dividend yield on the Dow. During the Great Depression, yield reached 10%. The Dow reached 4% yield during the March low and is now sitting around 3% yield.

AngloGold (AU) and Other SA Stocks Offer No Margin of Safety

If we're on the brink of a breakout to gold at $9,000 an ounce as UBS claims (source: Financial Times, requires registration) then let the party begin. By my own calculations, after halving my worst case scenario, gold could go as high as $9,414.16. Yeah, I know, make an outrageous claim and cement your fame. However, I have a logical explanation for my belief that a run up in gold is possible.

Confidence in my math on how gold could plausibly get to $9,000 is actually less important than the wait that we're in for to get to such a level. After all, the rise from $35 an ounce in 1969 to $800 an ounce in 1980 took a lot of twists and turns. I personally believe that we'd see a collapse in the price of gold and other related commodities before we move to the insane levels that I mentioned earlier.

If you compare the yields on gold stocks today to the 1970's you'd think we were on different planets. As an example, Barrick Gold (ABX), a "domestic" producer, has a dividend yield of 1% while AngloGold Ashanti (AU) has a paltry yield of 0.40%. DRDGOLD (DROOY), the old Durban Deep, has the massive yield of 1.4%. In the list of gold stock provided by Richard Russell, only 3 stocks sported no dividend. None of the publicly traded South African gold producers have dividend yields that provide a margin of safety.

In an earlier posting, I scoffed at the notion of gold stocks paying a dividend just to get investors into the market. Despite that concern, it doesn't stop me from believing that if we are really in a long term bull market in commodities (inflationary period) then it would certainly be nice to get compensate for the wait.

Keep your mind open to the prospect that even if some gold stocks are paying a dividend just to get speculators in, there might be a chance that the current run up in gold is a repeat of the early stages of a genuine gold bull market. If you happen to find gold stocks with such outrageous yields then let me know, I'm always interested (only those with earnings please.) Touc.

*See my note on commodities in the comment section of my September 12, 2009 posting.


Please revisit Dividend Inc. for editing and revisions to this post.

Warren Buffett’s View on Inflation

I read a lot on a daily basis. Nothing gets me more excited than to see a new editorial by great investors such as Bill Gross of PIMCO and Warren Buffett of Berkshire Hathaway. I've learn a great deal from these investors on many subjects but nothing confuse me more than the subject of deflation and inflation. We are hearing these terms on a regular basis because of the recent turn of events in our economy. Misunderstand the two and how to invest during such time can be costly.

I turned to one of the greatest investor of our time, Warren Buffett, for advice on how to invest during inflationary period. What I found confused me rather than enlightened me. Back in 1977, Buffett wrote an article titled "How Inflation Swindles the Equity Investor" (Fortune, May, 1977) which implicitly suggest that investors stay away from stock (equity) during inflationary time. The quote below was taken from the context of that article.

It is no longer a secret that stocks, like bonds, do poorly in an inflationary environment. We have been in such an environment for most of the past decade, and it has indeed been a time of troubles for stocks. But the reasons for the stock market's problems in this period are still imperfectly understood.

He stated that the problem is that the return on capital hasn't risen with inflation and seems to be stuck at 12 percents. He wasn't too excited about stock during inflation. Fast forward to our current bear market. On October 16, 2008, Buffett wrote an op-ed piece in NY Times titled "Buy American. I Am." The except below was taken from the context of that article.

Today people who hold cash equivalents feel comfortable. They shouldn’t. They have opted for a terrible long-term asset, one that pays virtually nothing and is certain to depreciate in value. Indeed, the policies that government will follow in its efforts to alleviate the current crisis will probably prove inflationary and therefore accelerate declines in the real value of cash accounts.

Equities will almost certainly outperform cash over the next decade, probably by a substantial degree. Those investors who cling now to cash are betting they can efficiently time their move away from it later.

Interesting! It appears that Buffett now favors stocks as a hedge against inflation.
My personal view is that any tangible assets, whether it be gold, silver, corn, sugar, or beans, will do just fine during inflation. Equity holder also is protected by having exposure to the underlying assets that company hold. You can find this under the balance sheet in current assets or inventory.

I had an investment in Heinz not long ago and wrote that "We were told to have gold in our portfolio for inflation hedge. The good news is that can of beans will do just that." Things were probably different in 1977 or maybe I misinterpret his article, but any investors who took his advice without educating himself may have missed the greatest bull run from 1982 to 2000. Please see the chart below. Related article.

The market will do what you want it to do, but never when.
My next article title "Inflation and Equity Investors" will have more detail on why inflation is good for equity investors. -Art

U.S. Nat. Gas (UNG): The ETF Unwind Begins

In my blog posting on July 3, 2009 titled "ETF: Mediocrity with No Pretense of Value," I said:

"The structure of a scheme like this [ETFs] only works when the market continues higher or new money floods in."

Are we on the cusp of seeing this situation with EFTs unravel? Currently, the U.S. Natural Gas Fund (UNG) is being forced into the position of issuing new shares to offset the expiration of old creation units. Without the issuance of new units, UNG has become priced well above net asset value as new money has flooded in with a diminishing number of units.

Some have said that the real problem is the fact that UNG has been too successful at raising money. I believe that the flood of money into the fund shouldn't be considered a success, instead it should be considered bordering on a ponzi or pyramid scheme. Again, no value exists unless more money comes into the fund. If the spigot of new money was turned off, in a matter of months the fund would end up worthless, unless the price of natural gas goes up.

One guy, Jim Cramer, said back in June that he believed that the flood of money into the ETF would actually allow UNG to push up or prop the price of natural gas. However, when you view the history of natural gas prices over the last year (courtesy James L. Williams WTRG Economics at WTRG.com) you can easily see that, in this case, UNG and the futures price of natural gas are in complete agreement.

Most market professionals would claim that a changing of the rules is the real reason why there is turmoil in the commodity ETF market which is reminescent of the FIRREA rule change on Savings and Loan institutions before the S&L crisis. The reality is that the rule changes are an outgrowth of lawsuits from overzealous attorneys on behalf of misinformed investors. In their zeal to create hedging and leveraging opportunities to the retail investors, leveraged ETF distributors didn't emphasis enough the fact that the risk of loss was far beyond known market risk. Unfortunately, like the FIRREA rule change we could see painful unintended consequences.

Oh, by the way, did I mention that there is no real intrinct value to ETF funds. Whether they are Index ETFs or leveraged ETFs it is really all about the luck of the draw. If a lot of money is coming in at the time that you own the fund then the net asset value (NAV) will move in-line with the market. However, when net redemptions exceed new money coming in, the value of the ETF declines. The only hope is that market for that fund is in a rising trend.

The news on UNG's plight isn't all that encouraging even though the issuance of more shares is meant to mitigate the disparity in the NAV. My hope is that things don't get to out of hand as we enter the most volatile months in the year. -Touc

The following are the latest articles on what may become the great ETF unwind.


Please revisit Dividend Inc. for editing and revisions to this post.

Nasdaq 100 Watch List

Dividend Achiever Watch List

It was another strong week for the Dow. The market closed higher four days straight and closed Friday down 22 points. At the end of the week, the market gained 165 points and sit at 9,605.41. I mentioned last week that things appear to be "weak" and as I expected, the market act in the opposite direction. At the end of the week, my watch list has 9 companies compared to 12 from the week before. Here are the companies on my watch list as of September 11, 2009.

Air Products & Chemicals (APD): Sell at the Market

It is now time to recommend that Air Products and Chemicals (APD) be sold at the market. The stock has severely underperformed since the research recommendationwas issued on September 29, 2008. It is highly recommended that anyone who bought the stock based on my research should re-read the posting. It is hoped that the stock was researched and purchased well below the initiation price.APD's stock price got crushed right after the research recommendation was issued which is exactly what we want to happen. Despite the massive decline in the stock price, APD continued to raise the dividend. APD is up an astounding 82% from the low in November. In the pursuit of "seeking fair profits" the returns that this stock has provided within the last 345 days say that it is necessary to consider alternative opportunities.

APD from Buy to Sell

APD was recommended when it was trading at $71.43. As of the September 9, 2009 close, APD was quoted at $75.56. This equals a compounded return of 11.76% in almost 12 months. Selling this stock now also generates a return of 3.75x greater than the amount of the dividend yield.As I have indicated in the purposes and function of this site, the goal is to:

  • maximize the annual yield of each trade.
  • reduce time between buying and selling of each stock.
  • exceed the annual yield of government guaranteed alternatives in each trade.

Research recommendations are intended to be a starting point for investigating a quality company at a reasonable price. It is hoped that after doing the background research you can buy the stock at a lower price. Ideally the stock should be held in a tax deferred account and should not consist of less than 20% of your holdings. Personally, I prefer holding only 2-3 stocks at a time.

Sell recommendations are intended to deal with the short term reality of the market. The tracking of the Sell recommendations are the worst case scenario if you happen to have bought a stock at the time the research recommendation was made (please avoid making this mistake.) I aim for mediocrity in my returns, therefore I am happy with 9-12% annual gains. However, since codifying my approach to investing in 2005, I have had annual returns of 14% and above every year since.

It is always recommended that when selling a stock, one should not place stop orders, limit orders or orders after hours. This leaves the seller in the position of being vulnerable to the whims of the market makers. Instead, place your sell orders only as a market order during market hours. Some would complain that a market order during market hours might leave some profits on the table. However, I would rather leave some money on the table rather than have it taken away from me by the trades that are placed by institutions and market makers.

Dow Jones Industrial Altimeter

When considering where we are it helps to see where we've been. Implicit in this thought is the idea that we use as many perspectives as possible in order to build context around our view. One such tool that is worth looking at is the Dow Jones Industrials Average Altimeter.

Historically, since 1871 (Cowles Commission Expectation of Individual Stocks), the altimeter has indicated that whenever the Dow Industrials went above the 30 range the market was overvalued and whenever the market was below 15 the market was undervalued. As illustrated in the chart below, since 1920 the Dow Industrials followed this pattern quite well until the breakout above 38.47 on June 13, 1995 (point X).

After the January 13, 1950 (point J) buy signal, the altimeter gave numerous sell signals from 1961 (point K) to 1972 (point R). At any point that the sell signals were given, except for 1961 (point K), you would have avoided the major market declines of the late 60's and throughout the 1970's. When the next buy signal was registered on December 13, 1974 (point S) the stock market was off to the races and never looked back.

From December 13, 1974 (point S) until the present we've been confronted with an unprecedented pattern change in the altimeter. Even though the pattern that was established no longer seems to fit previous indications, it is important to note that the indicator is giving us a massive head and shoulders technical pattern to watch for.

After the peak in the altimeter on August 25, 1987 at 38.24 (point V) and the subsequent crash that followed, the market bounced from the 1989 bottom (point W) at 21.14 to the 38.07 level in December 28, 1993. The declined that followed the 1993 peak signified that the 38 level was very important to watch for. Of course, after falling to the 1995 level of 32.88 (point X) the altimeter went to the unprecedented level of 68.13 in 1999.

Everything that has happened since 1999 has only cemented the significance of the 38 and 21 levels on a technical basis. The reversal of the decline from 1999 to 2003 at 36.06 (point X1; near 38) and the congestion, and subsequent crash, in 2007 led to the altimeter falling back down to 21 on March 9, 2009.

If we get lucky, we could see the Dow go back to the 38 level. This means that we could possibly reach the 10,901.44 on the index. After reaching the 38 level we should expect the stock market to decline at least to the 21 level again. However, the current trend is still indicating a downward trend since hitting the most recent peak of 33.53 on August 27, 2009.

Let's watch how closely the head and shoulders pattern is established. If we do complete a head and shoulder pattern, then we could expect that after reaching 10,901.44 the Dow will go back to 6024.48. If we go significantly beyond 10, 901. 44 then I'll have to reassess the situation at that time. Touc.


Please revisit Dividend Inc. for editing and revisions to this post.

Nasdaq 100 Watch List

Below are the Nasdaq 100 companies that are within 21% of the 52-week low for the respective week.

Dow Industrials Altimeter

When considering where we are it helps to see where we've been. Implicit in this thought is the idea that we use as many perspectives as possible in order to build context around our view. One such tool that is worth looking at is the Dow Jones Industrials Average Altimeter.

Historically, since 1871 (Cowles Commission Expectation of Individual Stocks), the altimeter has indicated that whenever the Dow Industrials went above the 30 range the market was overvalued and whenever the market was below 15 the market was undervalued. As illustrated in the chart below, since 1920 the Dow Industrials followed this pattern quite well until the breakout above 38.47 on June 13, 1995 (point X).

After the January 13, 1950 (point J) buy signal, the altimeter gave numerous sell signals from 1961 (point K) to 1972 (point R). At any point that the sell signals were given, except for 1961 (point K), you would have avoided the major market declines of the late 60's and throughout the 1970's. When the next buy signal was registered on December 13, 1974 (point S) the stock market was off to the races and never looked back.

From December 13, 1974 (point S) until the present we've been confronted with an unprecedented pattern change in the altimeter. Even though the pattern that was established no longer seems to fit previous indications, it is important to note that the indicator is giving us a massive head and shoulders technical pattern to watch for.

After the peak in the altimeter on August 25, 1987 at 38.24 (point V) and the subsequent crash that followed, the market bounced from the 1989 bottom (point W) at 21.14 to the 38.07 level in December 28, 1993. The declined that followed the 1993 peak signified that the 38 level was very important to watch for. Of course, after falling to the 1995 level of 32.88 (point X) the altimeter went to the unprecedented level of 68.13 in 1999.

Everything that has happened since 1999 has only cemented the significance of the 38 and 21 levels on a technical basis. The reversal of the decline from 1999 to 2003 at 36.06 (point X1; near 38) and the congestion, and subsequent crash, in 2007 led to the altimeter falling back down to 21 on March 9, 2009.

If we get lucky, we could see the Dow go back to the 38 level. This means that we could possibly reach the 10,901.44 on the index. After reaching the 38 level we should expect the stock market to decline at least to the 21 level again. However, the current trend is still indicating a downward trend since hitting the most recent peak of 33.53 on August 27, 2009.

Let's watch how closely the head and shoulders pattern is established. If we do complete a head and shoulder pattern, then we could expect that after reaching 10,901.44 the Dow will go back to 6024.48. If we go significantly beyond 10, 901. 44 then I'll have to reassess the situation at that time. Touc.


Please revisit Dividend Inc. for editing and revisions to this post.

A Point Worth Making

The following is a comment made by Pecede on the Seeking Alpha financial forum regarding my latest article on Fannie and Freddie.

While I respect and agree with much of your logic, let's not forget that it is the people who borrowed the money to pay for property they can no longer afford that are sticking it to the taxpayer by reneging on their promises.


My response is as follows and is relevant to the topic:

Your point is well taken. However, a financial institution should always be held to a higher standard. Therefore, while a consumer signed on the dotted line, the lender was willing to let the loan go through even though it was clear that the client couldn't survive financially in the short and long term.

All consumers, if given the opportunity, will borrow to the max. It is the responsibility of the lender to make the decision not to give the loan. While working for Fannie and Freddie from 2001 to 2006, I would contact the loss mitigation unit of the banks and the response was always the same from the loss mit team inside the bank, "why in the world did the bank give out the loan to this individual?"

The point being, it was abundantly clear from the initial loan docs that were approved, that the individual couldn't maintain the mortgage from the very beginning. You can't expect the public, who is more versed in the art of voting for American Idol contestants, to understand or care about the terms of a document. Most Americans routinely sign legal contracts without faking that they've read the terms beforehand. This puts the responsibility back on the banks.

By no means does my position support the belief that the consumer isn't to blame somehow. Instead, the banks should have been concerned about doing due diligence and determine the long term financial viability while remaining profitable. Such a stance may mean sacrificing short term competitiveness in order to avoid the pending train wreck. Or, you could at least sell out at the top like Golden West Financial did (my favorite financial institution, former Dividend Achiever and a real success story for a bank) when they got bought by Wachovia (WB).

Unfortunately, Fannie and Freddie fanned the flames which encouraged banks to take on more risk than was prudently acceptable. Touc.

Please revisit Dividend Inc. for editing and revisions to this post.

Silver Should be the Focus

I watch with glee as Yahoo!Finance includes a price quote for gold in the Market Summary section on their home page. After all the financial turmoil that we've been through since the introduction of the internet, when did Yahoo!Finance realize that a gold quote was necessary? The obvious answer is, "When the public demands it."

Well, when the public finally demands the price quote of gold on their finance homepage, it is probably too late to participate in gold on a level that could be considered meaningful. After all, at nearly $1000 an ounce, there isn't going to be a stock split in the price of gold. Or is there? (I've been pondering this possibility lately) In any event, gold is fast becoming an expensive asset in a world full of correspondingly deflating alternative "assets." What to do? What to do? Get out there and do your research on silver!!! That's what you do!!!

I say do your research on silver because if I told you that, regardless of the Hunt Brothers cornering the silver market in the 70's, the price of silver always outpaces gold on a percentage basis by a ridiculous margin, you'd probably laugh in my face. But as you should know, silver is the "poor man's gold" and coincidentally, there are more "poor" men than rich men can afford to buy.

When I first bought gold and silver back in 1996 (in bulk and never purchased again), I knew that I was getting a bargain. When I exchanged 75% of my gold for silver in 2008, I knew I was committing highway robbery. I've always noted that "gold bugs" were blinded by the historical significance of the yellow metal, while at the same time claiming that they were investors who used gold as a form of insurance against government mismanagement of paper currency.

The real deal is in the price of silver. While gold has run up 259% since I purchased it, silver has gone up only 266% in the same period. This means that silver hasn't appreciated as much as it historically should relative to the price of gold. Which begs the question, what should we expect silver to do relative to gold? I have my own calculations for the future price of gold and silver. But more importantly, let's look at what history has to offer us.

I like chopping everything into halves. This means that if the Hunt Brothers' cornering of the silver market brought the price of silver to $50 then the real price probably should have been $25. From this vantage we now have to choose a starting point. Where did the price of silver start out?

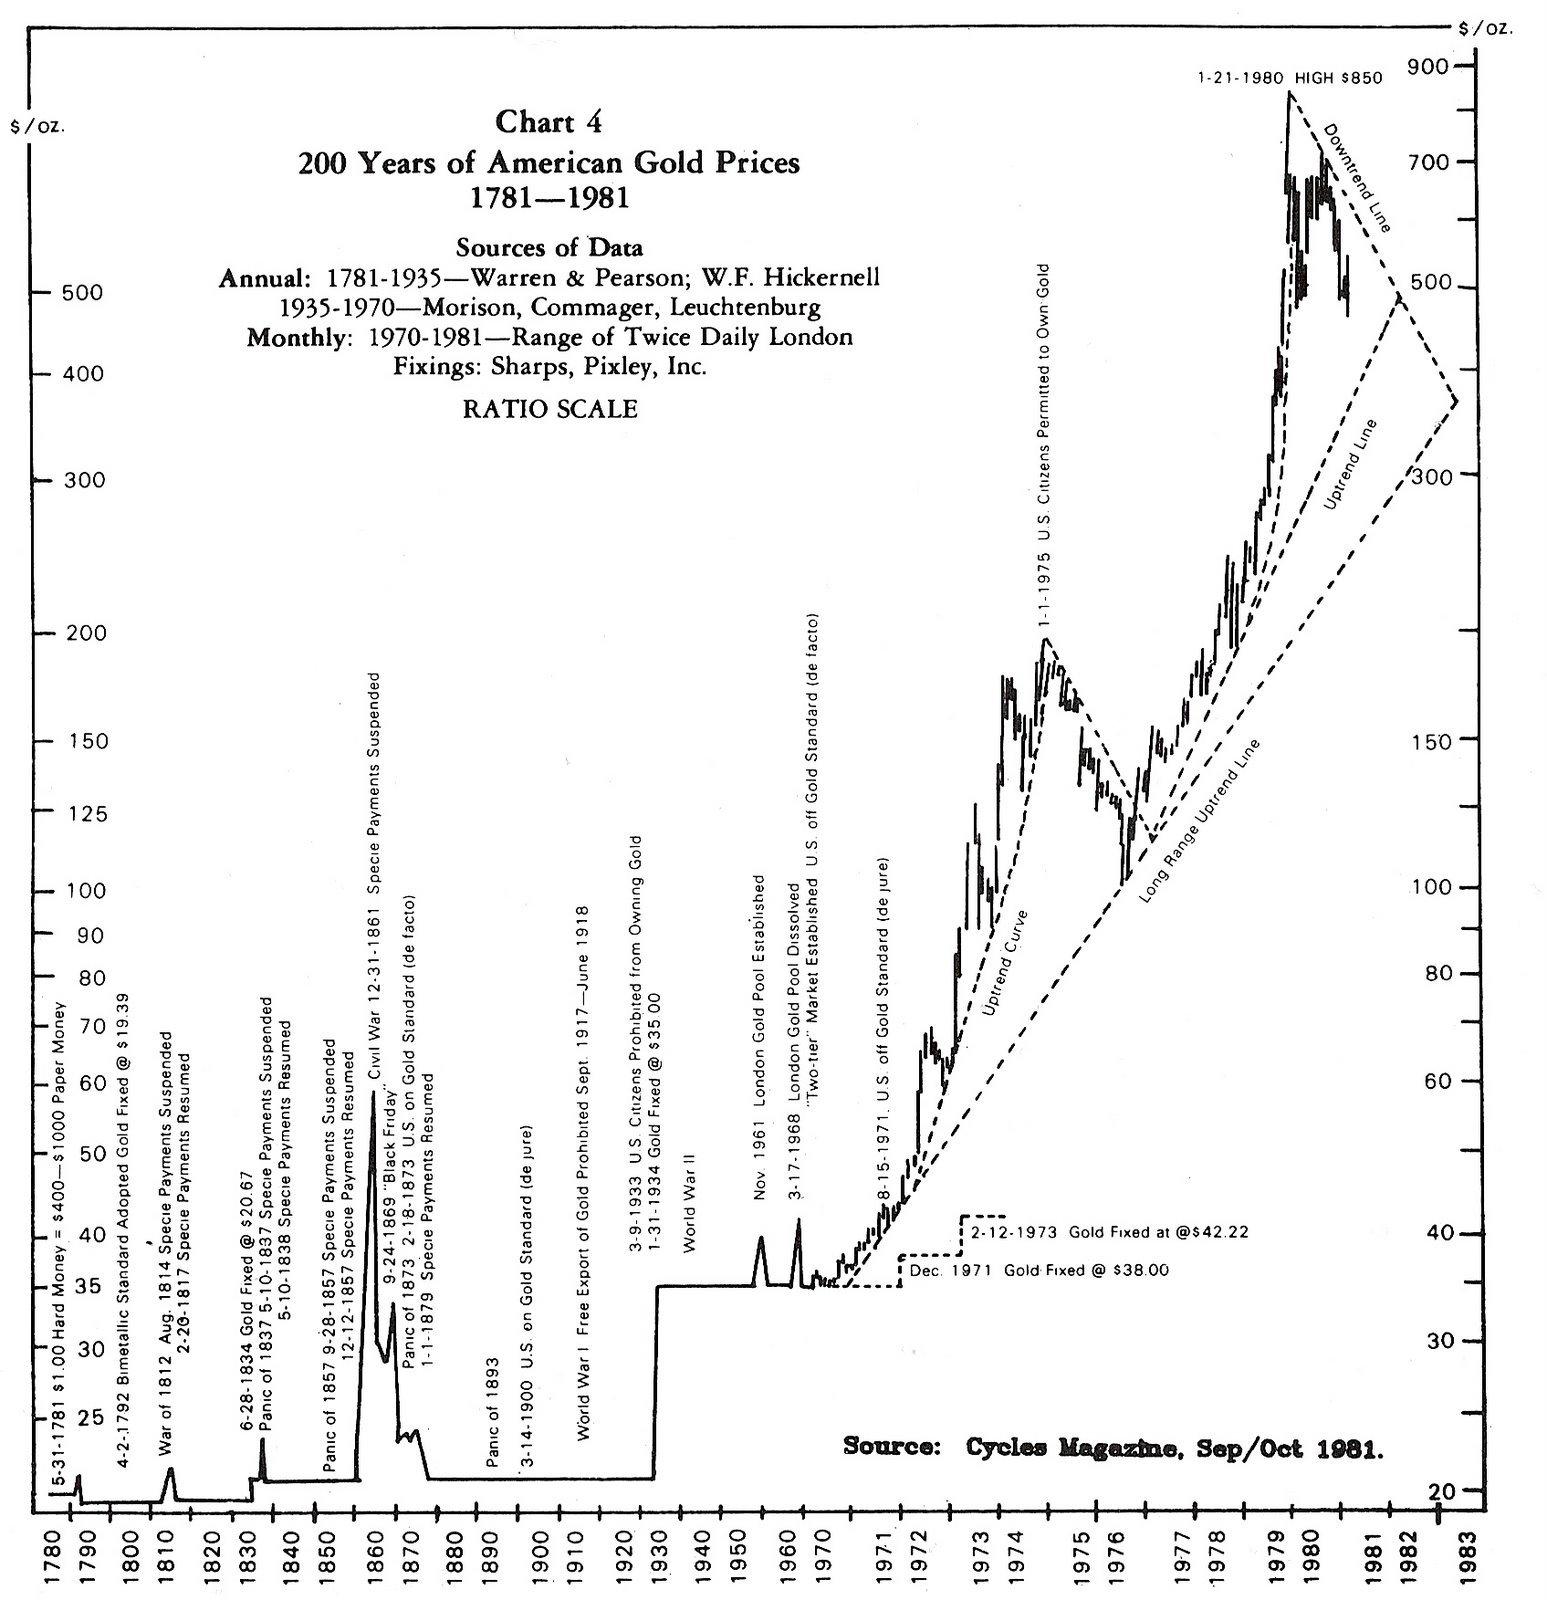
For illustrative purposes, let's start with the bottom of 1932 and compare silver with gold. At the low in 1932, silver was priced as low as $0.24 an ounce. Gold, on the other hand, was fixed at $20.67 per ounce. At the peak of the market in 1980, gold was selling at $800 an ounce while silver was selling at $50 an ounce. During the period from 1932 to 1980, gold went up 3,770% while silver went up 20,730%.

Gold bugs, ever clinging to their religion, would argue that silver was cornered so the $50 figure was a fraud. Gold bugs would also claim that if gold was allowed to freely float during the crisis of 1929-1932 then gold would have been much higher than the price of silver in 1932. These arguments demonstrate a lack of knowledge on how commodity markets work, basic economics and history in one fell swoop.

For the aforementioned reasons, I will calculate the change of silver from $0.24 to $25. Despite halving the figure, silver still achieves an astounding 10,316% increase from the low of 1932. Any way you slice it, the ratios are completely disfigured and in favor of silver. I could have started my pricing point in the 1950's, 1960's or the 1970's and the distortion would be the same but that would be an exercise in futility when talking to a gold bug. Their retort is always the same, "what about this?" or "You're being selective" or "You're biased" or etc. etc. etc. ad infinitum...

Back to me and my silver holdings, when the price of silver has moved in step with the price of gold, on a percentage basis, then I know that silver is underpriced as a precious metal. With this in mind, I converted a majority of my gold holdings into silver. I'm an investor, therefore I don't want to get myself caught up in the religions debates about gold.

So, if (note the size of the if) you're considering taking the dive into gold then move on to the alternative with every bit the attribute. I suggest that you avoid the numismatic varieties of silver. Instead, aim for junk silver of the half dollar denominations. Again, only buy precious metals as part of a balanced diet of physical real estate, stocks, bonds and cash.

In my opinion, gold and silver stocks are perpetual options on the price of gold and silver. Therefore, precious metal stocks are great for speculation but poor investment choices. Be mindful of the coming competitive dividend war between precious metal companies. I remember one, now defunct, gold company that paid out their dividend in actual gold. These are all gimmicks to lure investors in at a time when the rule of the day should be "head to the exits."

If you've read my blog at any length then you already know of the Dividend Achievers that have beat gold and silver stocks without the added risk. However, if you're a hardened equity speculator, you could nab select gold and silver convertible preferreds. Gold and silver equities aren't my first choice but now you know some of the options available to you.

A Note of Caution for All Precious Metal Investors
As the price of the precious metals get higher, the less likely you'll get the widely quoted price when trying to cash in. Precious metal dealers, being business folk, will not be willing or able to take the risk of buying back your gold and silver at the highest quoted price. Therefore, even though gold was at $800 and silver was at $50 back in 1980, investors who tried to cash in at those prices were being turned away by dealers. This will be one of the signs that we're at a top in the market for precious metals.

When you read the following articles on gold and silver, you need to understand that I have a vested interest in the topic. Therefore, I theoretically should say things that only support the investment positions that I retain. Unfortunately, I don't see (revealing my limitations) the value of the philosophy of "whose food I eat, whose song I sing." Additionally, it would be no contradiction that I would explore and write about the breadth of both sides of the topic of precious metals investing. Touc.

related articles:


Please revisit Dividend Inc. for editing and revisions to this post.

Fannie Mae (FNM) and Freddie Mac (FRE) Fraud

In my article titled "Delisting of GSEs Looms Large" published on February 21, 2009, I discussed the fact that as Fannie Mae (FNM) and Freddie Mac (FRE) remained under $1, the prospects were that we'd either see the companies delisted from the NYSE or that the price would skyrocket. Not long after writing the article, the stock of FNM and FRE fell as low as $0.35 on March 9th. In that February article, I said the following:

"Look for a boosting of the share price to ridiculous levels (anything above $1) or go literally to zero in the next delisting notification process."

Soon after falling t0 $0.35, Fannie Mae and Freddie Mac briefly, on a closing and intraday basis, went above $1 on March 19th and then promptly fell from there. According to the New York Stock Exchange, spend six months under $1 and you get delisted. As strange as it may seem, September is exactly six months away from the month of March.

One reader of this blog, Ron, poignantly remarked, "...it seems to me the exchanges are constantly bending their own rules about delisting, extending grace periods, etc. Especially in this case the govt will probably be leaning on the exchanges not to delist." My response was, "...there is little need to do this (bend the rules.) If you're the government, and you don't know anything about fiscal responsibility, you'll more than likely feel compelled to waste the money and artificially inflate the stock price." Furthermore, I specifically stated that this was going to be "one of the biggest speculations in history."

Well, as promised, the U.S. government proved to be as gullibull as has been the case since the beginning of time. In an article titled "Fannie, Freddie Avoid Delisting as Price Triple" published by Bloomberg.com, you get the sense that there is a collective exhaling about the notification that the companies would not be delisted. Strangely, FBR Capital Market's Paul Miller seemed indignant at the thought that the Fannie and Freddie stock price went up. Miller, a banking analyst, said that the rise was "unjustified" and that there was "no fundamental value remaining" in the two GSEs.

I say to Mr. Miller (with tongue firmly in cheek), the threat of being delisted was a completely justifiable reason for Fannie and Freddie stock to go up in value. The government had already gamed the markets by reverse splitting AIG, so it would be challenging to commit the same fraud twice on the investing public in such a short time.

Also Mr. Miller, if Fannie and Freddie are delisted, the market for all bad mortgages cannot be absorbed by the taxpaying public through the GSE conduit. That means these two companies are incredibly valuable. Mr. Miller, maybe Fannie and Freddie are not valuable to you but they are definitely valuable to the banks that are receiving bailouts in the front door and dumping their trash on the taxpayer through the back door. Silly Mr. Miller, still talking about notions like fundamental values and such.

We have witnessed the all too familiar quality known as predictably irrational behavior of the government and the financial markets. In many respects, Ron was right, the rules were bent to favor those in powerful positions. When the NYSE says "The World Put Its Stock in Us," they should have also added that it is the best exchange that money can buy. After all, the NYSE should be held criminally for allowing such blatant fraud to reign on their exchange. Instead, they looked the other way in the face of clear manipulation and malfeasance.

It is just our luck that history repeats so well and so often in financial markets. This is the reason why the addressing of this matter of the delisting of the GSEs was so predictable. The maneuvers that I've described have happened so many times in the remote and distant past with far more inferior technology that it's laughable. The more things change the more they remain the same...and that ain't no cliche in the financial markets. Touc.

related articles:


Please revisit Dividend Inc. for editing and revisions to this post.

Dividend Achiever Watch List

The market closed this week down 101.64 points (roughly 1%). The big picture is not looking good. My watch list rose from 6 to 12 companies this week. That is more than double. For a second consecutive week, I do not have any company that is within 10% of the yearly low.

Although the market appear to be "topping out", I bought a stock that I sold earlier in the year, Altria Group (MO) at a yield of 7.5%. I placed Altria as my wild card company on the watch list because the company isn't trading near its low but after increasing the dividend by 6% plus a strong fundamental, I had to buy some for my family. If Altria falls to 52 weeks low, it would yield an amazing 9.5% and the company is known to have a ridiculous payout ratio of 90%+. Enough about that, here are the companies on my watch list as of September 4, 2009.
Nasdaq 100 Watch List