- Japan
- Market Indicator
- Price Momentum Indicators
- Richard Russell
- Silver
- Speed Resistance Lines
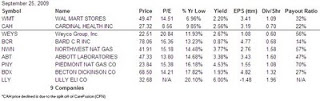
- U.S. Dividend Watch List

In today's research recommendation of NWN, I will cover the issue of cyclicality, the Coppock Curve, natural gas prices, and Dow's theory as it relates to the stock. I have compiled this information as I consider buying NWN. It is hoped that you thoroughly review NWN from all angles before committing any money to this accomplished Dividend Achiever.
When someone asks me about any cyclical stocks that I might be able to suggest, I often stammer at the thought. In fact, I'm clueless as any true cyclical stocks. However, after a considerable review of NWN, I can prove that it is definitely a true cyclical stock. First, NWN has exhibited a pattern of hitting a relatively low price between the months of January and May since 1970.
The stock hitting a low during the first five months of the year occurred 87% of the time. New lows during the months of February, March and April took place 78% of the time within the period from January to May. The month of February comprised 33% of the new lows between January and May. From the numbers that I ran, February and April are the most optimum month to consider buying this stock.
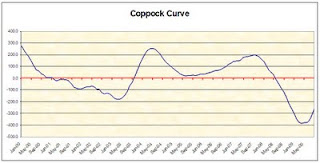
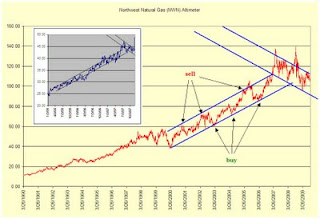
Next up is the Coppock Curve for NWN. In the chart below, you can seen that the Coppock Curve along with a 14-month trendline. After falling below the zero line, the rise crossing over the trendline indicated a ideal buying point on the first day of November 1994 at an adjusted price of $7.67. Subsequently, the stock reached an adjusted high of $16.74 in December of 1997.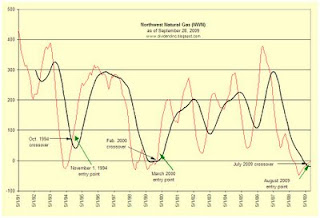
The next point when the Coppock Curve was crossed by the 14-month trendline was in February 2000. If you bought the stock on the first day of March 2000 at the adjusted price of $12.70, you would have seen the shares rise to an adjusted price of $52.19 on September 18, 2008. The rise from March 2000 to September 2008 is in spite of the bear market which began in October 2007. Currently, NWN's Coppock Curve has just crossed above the 14-month trendline. All indications are that this is a buying point based on the Coppock Curve.
Next up is the natural gas wellhead price from 1977 to the present. In the chart below, I have indicated the points where, based on the Coppock Curve, the price crossed above the 14-month trendline. It appears that the Curve accurately called the bottom in the price, almost to the very lowest point possible. From this indication, it appears that the natural gas wellhead price is about to rise from here.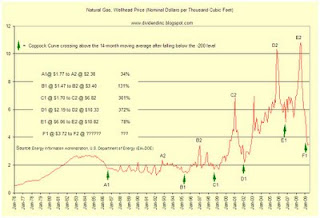
Finally, we'll look at the prospective upside and downside targets for NWN based on Dow's Theory.
Upside:
Comments Off on Northwest Natural Gas (NWN) at $40.94
Posted in Northwest Natural Gas, NWN
Comments Off on Dividend Achiever Watch List
Posted in Dividend Achiever Watch List
Art
Comments Off on Research Request: Mylan, Inc. (MYL)
Posted in MYL, Mylan, Research Request
Comments Off on End of September Market Commentary
Posted in Dow Theory Bull Market indication, Dow Theory Letters
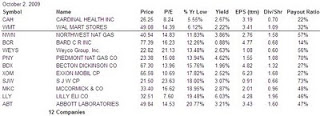
Disclosure: All figures are from Yahoo! Finance as of 9/29/09
Comments Off on Stock to Watch: Cardinal Health (CAH)
Posted in CAH, Cardinal Health, Individual Stock
Comments Off on Dividend Achiever Watch List
Posted in Dividend Achiever Watch List

To follow up with what I am seeing today, I have drawn the chart below. Two strong pattern I see are the golden cross which is when short-term moving average crosses mid-term moving average and an ascending triangle.
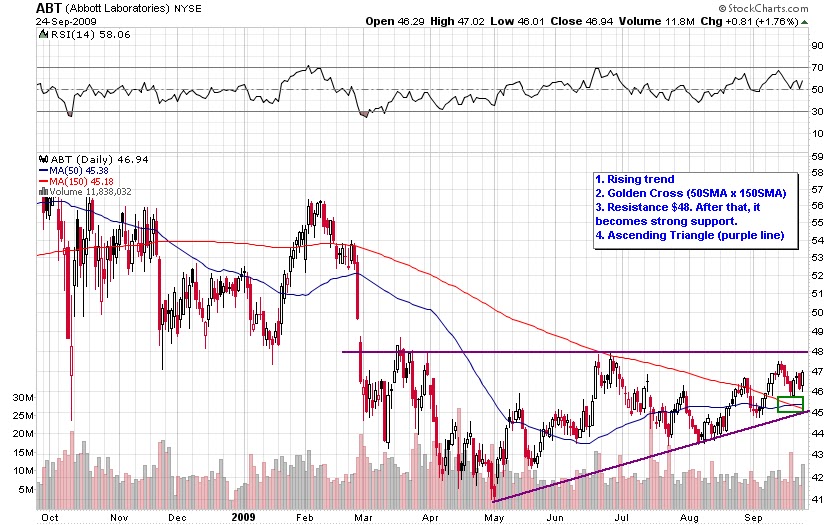

As we can see, ABT has a low range at 103 and a high range at 171. In two prior instances, I have circled the areas where ABT went up and then fell back down before rising to a new overvalued level. Currently, ABT is either in the middle of another temporary rise before falling a little bit further or we could be in a full scale move straight to overvaluation. In either case, if you bought now, according to the altimeter, you wouldn't be overpaying for this stock.
Comments Off on Stock to Watch: Abbott Laboratories (ABT)
Posted in ABT
Because the company’s stock price at year-end was significantly below the company’s book value of tangible assets and its book value of equity, accounting rules effectively required that the company take a non-cash write-off of goodwill and certain other intangible assets totaling $436 million or 431.6 million net of taxes of $4.1 million.
Art
Comments Off on Stock Checkup: Nacco Industries Inc. (NC)
Posted in Nacco Industries, NC
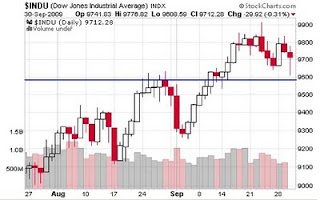
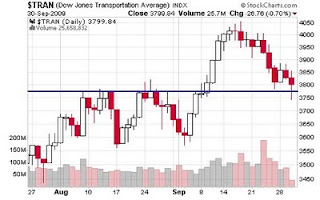
In the chart below, we see a one year diagram of the Dow Jones Composite index of 65 companies. The composite index briefly exceeded the November 4, 2008 high of 3407.33 by only 1.82 points on September 16, 2009. It is important to know that the high for the day of September 16, 2009 did not exceed the high for the day of November 4, 2008. The fact that the market cannot go above November 4, 2008 so far has much broader implications than just in the financial arena.
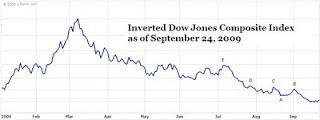
Since the September 16th peak the Dow Jones Composite Index has traced out an interesting pattern lower. This same pattern could not be seen if you looked at any one of the individual indexes alone. In the chart below, we can see where the next destination might be for the markets on the downside.
The following are the prospective downside targets for the Dow Jones Composite Index as represented in the inverted chart above:
Why have I inverted the chart of the index? Because there is uniform agreement among all great Dow Theorists that calling a peak is the most challenging thing to do. It is the nature of humans to be positive, otherwise most progress isn't possible. With the chart showing a bottom instead of a peak we can feel comfortable seeing the prospects for the future. In terms of Dow Theory, the inverted chart allows us to see a bear market from the same context that we can see a potential bull market.
Now, to play further mind games on you, I recommend that you look at the most recent trend of the Composite Index. After posting above the 3407.33 on September 16th at 3409.15, the market has exhibited two lower peaks on the September 18th and September 22nd. This indicates that a market breakdown to the 3293.86 level (point A) is a probability.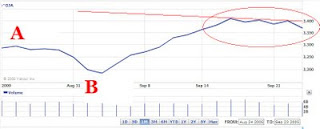
The declines that I have mentioned are in the context of a cyclical bull market within a larger secular bear market. Any of the declines that I have pointed out are all acceptable and constructive for a bull market. Soon after the declines are out of the way we can expect that the market will retest the old high before going higher (both Transports and Industrials) or confirming the previous declining trend.
If you have questions or thoughts then please email me at the following link.
Comments Off on Dow Theory
Posted in Dow Theory
Comments Off on Northwest Natural Gas (NWN) Altimeter
Posted in Altimeter, Edson Gould, Northwest Natural Gas, NWN
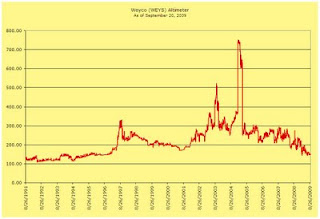
One consideration is the fact that WEYS has tremendously low trading volume. Additionally, this stock has only increased its dividend 10 years in a row which means that we can't be sure that the company can weather an true economic cycle. However, as mentioned before, this company has no debt and my be worth a second look. Touc.
Comments Off on Weyco (WEYS) Altimeter
Posted in Altimeter, Edson Gould, Weyco, WEYS
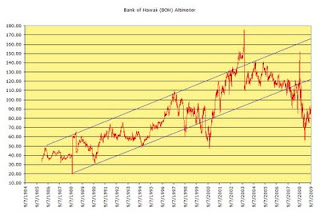 The channel that BOH has managed to fluctuate within suggests that the stock is overvalued at the high end and undervalued at the low end. The period of extreme overvaluation is reflected in 2003 and started to move in a declining trend to undervaluation when BOH increased the dividend from $0.19 to $0.30.
There are two periods of extreme undervaluation in the altimeter. The first level of extreme undervaluation hit bottom in October 2000. The second period was most recently in March of this year. If the stock were to go back to the "historical" low end of the range, BOH would be priced at $54 a share. Although we do not have an extensive history on the periods of extreme undervaluation, it could be inferred that, based on the altimeter, an investment in BOH while not risk free, could be considered low risk.
At least one hitch to my assessment on BOH, in terms of the altimeter, is the fact that the low in March 2009, around the 60 level, could be part of a normal low range that is being established for the stock. If the 60 level is the low end of a new long-term range, my best guess is that the 110 level is the upper end of the range. At the 110 level, BOH stock price would be $49.50.
Only time will tell whether the escalating failure of banks is going to spread even further. However, BOH has managed to fare better than most banks of a similar size. As a further indication of BOH's strength, the dividend increase in November 2008 suggests that management believes the company will survive through the present banking liquidation cycle. Regardless of BOH's strength, I wouldn't be surprised if BOH does not increase the dividend in November. However, if a cut in the dividend takes place then I would be more cautious on the company and the stock. Touc.
related articles:
Please revisit Dividend Inc. for editing and revisions to this post.
Posted in Altimeter, Bank of Hawaii, BOH, Edson Gould
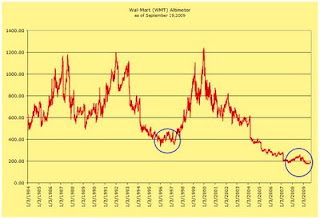
Based on the above chart, we can see that WMT is traditionally overvalued between 1100 and 1200 level. Additionally, when WMT falls to the 550 level the company is considered undervalued. What should be noticed is the double bottom that took place in the 1995 to 1997 period. After that time, WMT took off like a rocket.
In the most recent period from 2007 to 2009, we can see that WMT is forming a similar double bottom. From this indication, we should look out for the stock to rise significantly over the next four years. The expected rise in WMT should be in spite of all the economic forecasts of a continued decline in the economy.
The chart below is my own interpretation of WMT if the company pursued a less aggressive policy of increasing the dividend at such a high rate.
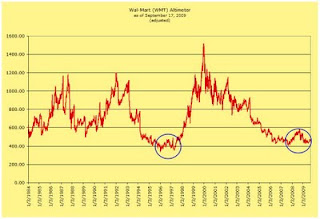 In the first chart, you can see that after 2004 WMT fell to an extreme level of undervaluation. The reason this occur is because WMT continued in increase the dividend at a high rate even though the company didn't have the earnings to support such increases. With diminished earnings, WMT issued more shares to raise capital to fund the dividend payments at the expense of per share earnings.
My model continues to increase the dividend every year but at a rate of 50% less than what WMT did from the period of 2004 to the present. This lowers the number of shares that need to be issued. In fact, my model would not have required the issuance of new shares to cover the dividend.
At the moment, we could consider WMT undervalued. However, keep in mind the fact that the continued issuance of shares in order to keep the dividend history intact undermines future earnings growth.
related article:
Comments Off on Wal-Mart (WMT) Altimeter
Posted in Altimeter, Edson Gould, Wal-Mart, WMT
In the first chart we see that MO is considered overvalued when the indicator is at 16 and above and is undervalued when the indicator is at 7 or below.
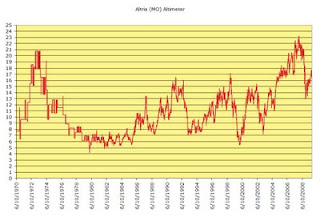 The chart below is also the altimeter for MO however, it reflects the valuation if unadjusted for the spin-off of Kraft (KFT) and Philip Morris International (PM).
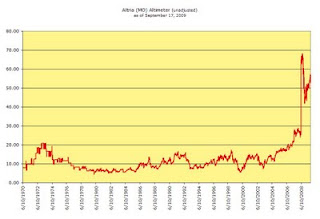 Hopefully these charts give a better understanding of when might be a good time to invest in MO. As you can tell from the first chart, MO is presently considered overvalued. Touc.
Comments Off on Altria (MO) Altimeter
Posted in Altria, MO, overvalued, undervalued