Author Archives: NLObserver Team

Q & A

Q: Do you really think we get through this crisis without ever having an undervalued market?

A: First, the crisis is past us and now we're faced with sorting through the wreckage which is more painful than the actual crisis itself. The general public now has the taste of bitterness necessary to feel that maybe there is a difference between saving and investing or the distinction between investing and speculating. The public now knows, by force of nature, that a home is a place where you live and not an investment. These realities, which faded after the Dow first hit 10,000, are in the recesses of the collective subconscious. While the lessons will be quickly forgotten, reminders will reappear in stark contrast to the hopes of the ever optimistic public.

In many of my postings and in the right hand column of my site you'll see that I expect this to be a bear market for at least the next 7 to 9 years. My 2016 date (based on cycle analysis) is the approximate year that I expect that either the market will hit its ultimate low or the point when valuations are expected to be at the most extreme low levels. Even after the year 2016 I do not expect the market to immediately go to new highs. Instead I expect that the market will meander for another 6-8 years before exceeding the previous high for good.

Within the context of a secular bear market there will be cyclical bull markets or bear market rallies. Great examples of the kind of market action that I expect are years from 1906-1924 or 1966-1982. Remember, a secular bull market has the ability to exceed the previous market high by at least 16.5%.

We will see a period when valuation are at historical low levels. Unfortunately, it will be very difficult to convince the retail investor that buying stocks en mass is the right thing to do. As an example, 1982 was a great year to buy stocks but with treasuries yielding 12% there was no way to convince the public that the Dow with a yield of 5.5% was worth it. Guaranteed money at 10-12% versus stocks at 5% seemed like a no-brainer.

Q: Do corporate earnings just recover from here while the market moves sideways to allow P/E and dividend yields to catch up?

A: I believe that we'll see earnings remain flat as corporations continue to cut costs but the shocker will be that we'll see earnings. The problem will be that corporations will cut costs too much which will lead to a general rise in prices and an increase in the value of corporate assets. Chapter 2 of the book Dow 3000 by Thomas Blamer and Richard Shulman clearly explains what most investors forget at the end of a bear market. Essentially, companies will become more valuable even though the stock price and earnings don't go anywhere.


"Men, it has been well said, think in herds; it will be seen that they go mad in herds, while they only recover their senses slowly, and one by one."


Mackay, Charles. Extraordinary Popular Delusions and the Madness of Crowds. preface. 1852.


Dividend Achiever Watch List

The market continued to march higher this week. The Dow gained 78 points, a gain of 0.86%. My watch list now contains 9 companies compare to 11 of last week. Important introduction to this list is Pitney Bowes(PBI). The company fell 12% on Friday after announced earning of $0.55/share and the consensus was for $60/share. A missed of 8%. Read this post for some detail on the stock. Here are the companies on my watch list as of July 31, 2009.

Nasdaq 100 Watch List

Coppock Curve Review

Today is the end of the month which means that we can now review the Coppock Curve(also known as the Coppock Index) to determine if the direction for stocks is indicated to be moving higher overall. Since the last bottom in the Coppock Curve back in April the index has had the following monthly figures:

  • April 2009:-388
  • May 2009:-383
  • June 2009:-378
  • July 2009: -359

From what I can tell we need another 3 months of rising numbers along with an increase above -260 for the Coppock Curve to establish a clear signal that a sustainable market reversal is at hand. I know that asking for 3 more months of rising figures seems like a lot. However, I just don't want to get faked out like what occurred in May of 2002. The actual turn in the index took place in March of 2003, almost a full year later. Would I be missing a lot of market "action" by taking this stance? Absolutely. However, the risk to your hard earned principal is what is at stake. It is always best to take the cautious stance on these matters.


Remember, The Coppock Curve is a relative strength index. In almost every instance that this index rises from a negative number to a positive number it has coincided with a relatively risk-free time to invest in stocks. In turn, an improvement in the stock market is a reflection of the better times in the U.S. economy overall. Let us hope that the trend continues. Touc.


Please revisit Dividend Inc. for editing and revisions to this post.

Achiever Alert: Pitney Bowes (PBI)

Yesterday (July 30th) in after-hour trading, Pitney Bowes (PBI) fell by $1.89 or 8.04% to close at $21.61 due to downward revisions of future earnings. This may be the situation where the stock becomes severely underpriced by the markets.After a quick read, I found out that PBI normally trades around 7.5 times cash flow according to Valueline Investment Survey. If we use full year 2008 cash flow of $4.66 then we'd arrive at a mean price of $34.95. This suggests that PBI is trading 38% (a nice Fibonacci and Dow Theory number) below the mean price. As a Dividend Achiver, PBI has increased the dividend every year for 25 years in a row at a 10-year CAGR of 5.5%. According to Investment Quality Trends, PBI is undervalued at a price of $29 with a yield of 5%.

PBI has many issues that cannot be ignored. The debt situation is not very favorable to the company, especially since PBI provides the financing for their consumers. PBI could have overextended credit on the upswing of the previous cycle and is now getting hit by the double whammy of companies having difficulty paying back their debt as well as a stalled economy that has reduced the demand for their postal equipment. PBI also has a high dividend payout ratio of 73% based on trailing twelve months earnings.

My expectation is that PBI will fall further when the market opens. As long as the Dow Theory bull market indication isn't reversed and depending on the extent of the decline, I would consider buying PBI. Of course, I'm hoping for a situation where the price goes all the way down to the $14 or $15 level established in 1992. I strongly recommend that you watch this stock and do your research. Touc.


Please revisit Dividend Inc. for editing and revisions to this post.

Congrats to Terry

The winner of my reader appreciation day book giveaway is Terry Rumpza of Newport, Minnesota. The book Dow's Theory Applied to Business and Banking by Robert Rhea is now bound for L'Etoile du Nord. Thanks to everyone who responded and please keep reading. I hope to entertain and possibly enlighten on matters related to the economy and the stock market. Touc.


Please revisit Dividend Inc. for editing and revisions to this post.

Concerned About Market Manipulation?

Lately there has been a lot of news about high frequency trading, flash trading, and "alleged" market manipulation by Goldman Sachs and others. However, in my March 16, 2009 posting, I covered the issue of short selling bans, market manipulation and their true effect on the market. It should be noticed that in the high frequency trading article there is a discussion of the issue of stocks priced in pennies. The article states:

"U.S. equity exchanges have catered to such clients since at least 1997, when the NYSE ended its century-old practice of quoting stocks in eighths of a dollar. It shifted to penny increments in 2000. That eroded earnings for NYSE and Nasdaq market makers, who profit from the difference between bids and offers. For investors, it helped reduce trading costs.
The exchanges sought to compensate for the lost business by paying rebates to high-frequency brokerages that buy shares at the best public prices. Exchanges have also overhauled their trading systems to cut transactions times and rent space in data centers so it takes less time to transmit information to buyers and sellers. Bats Global Markets processes orders in less than 400 microseconds, or 0.0004 second, which is about 1,000 times faster than humans blink their eyes."
Edgar Ortega, Jeff Kearns and Eric Martin. "High-Frequency Traders Say Speed Works for Everyone." Bloomberg.com. July 28, 2009. accessed July 29, 2009.

This issue of stocks trading in pennies instead of eighths is critical to the increased manipulation of the stock market. This was a specific matter that I raised in my March 16th posting.

Also, in the comment section of the same March 16th posting, I got a great question about the effectiveness of limit orders and stop loss orders. As I said at the time, your only tool for avoiding the maximum amount of market manipulation is to place market orders. As early as August 12, 2008 in my sell recommendation of Helmerich and Payne, I stated that only market orders should be used to avoid manipulation. Any individual investor who uses automatic orders as a form of "protection" is really subjecting themselves to greater losses and diminished gains. You heard it here first. Touc.


Please revisit Dividend Inc. for editing and revisions to this post.

Sell Cardinal Health (CAH) at the Market

It is now time to recommend that Cardinal Health (CAH) be sold at the market. The stock has performed reasonably since the research recommendation was issued on June 4, 2009. It is highly recommended that anyone who bought the stock based on my research should re-read the posting. The stock took a small dip in the early part of July, but changed direction after July 10th and hasn't looked back. From the current level, CAH is poised to reach the $43 level considering that we just got a Dow Theory cyclical bull market signal (within a larger secular bear market.) In the pursuit of "seeking fair profits" the returns that this stock has provided within the last fifty-four (54) days say that it is worthwhile considering alternative opportunities.
CAH was recommended when it was trading at $29.95. As of July 28, 2009, CAH was quoted at $33.03. This equals a return of 10.28% in less than 2 months. Conservatively, on an annualized basis this would equal approximately 61% return. Selling this stock now also generates a return 228% greater than the amount of the dividend yield if the stock was held for a whole year.

It is always recommended that when selling a stock, one should not place an order after hours or when the market is closed. This leaves the seller in the position of being vulnerable to the whims of the market makers. Instead, place your sell orders only as a market order during market hours. Some would complain that a market order during market hours might leave some profits on the table. However, I would rather leave some money on the table rather than have it taken away from me by the trades that are placed by institutions and market makers. Touc.


Please revisit Dividend Inc. for editing and revisions to this post.
This blog is being featured on www.condron.us, I hope you find this useful.

Reader Appreciation Day

Today I would like to show my appreciation to everyone who has continued to read my blog on a regular basis despite my errors and omissions. I will be giving away a copy of Robert Rhea's 1938 book "Dow's Theory Applied to Business and Banking." This book is the easiest to read and most applicable to not only the stock market but operating a business and determining the health of banks. This book is listed on Amazon.com with a starting price of US$85.00 all the way up to US$275.00. My copy of the book has a well worn jacket but the binding and pages are unblemished for such an old book. The following is the review of the book from Barron's:

When William Peter Hamilton 17 years ago, wrote the first book on the Dow theory he called The Stock Market Barometer, not because of the theory's value in forecasting the course of stock prices, but because of its value as a barometer of business. Most of the literature on the theory written since then has concentrated on technical studies of its method of identifying stock market trends, both bull and bear, shortly after their beginning.

In this book Rhea returns to Hamilton's original thesis, at which he pounded away steadily in his editorials in The Wall Street Journal and in comments in Barron's up to the time of his death in 1929. But whereas Hamilton had to depend on observation, Rhea has contributed to this subject the first detailed comparison of all the Dow theory bull and bear market signals back to 1897 with the movements of Barron's business index over the same period.

Rhea is well known as author of Dow Theory Comment, comprising air mail letters attempting to forecast stock and business trends; The Dow Theory, an introduction to the theory together with a complete collection of all of Hamilton's discussions of the price movement; and The Story of the Averages, a play-by-play history of every bull and bear market signal the averages have given since their inception and of the course of the market over the whole period. It is from this work that the Dow theory signals used in the new book are taken.

Business Book of the Week. Barron's. October 31, 1938. page 9

For the next two days I will be accepting emails from visitors to my site. I will print out the email addresses and put them in a basket. I will then randomly pull out the winner of the book. The email that is randomly selected will be notified to acquire the mailing address and the book will be sent within 10 days to wherever in the world it must go. Additionally, I will publish the winner's name on the blog. Touc.

Thanks again for reading my blog.

In my blurb on September 14, 2008, I tried to simplify the reason why Lehman Brothers failed. Well, we finally have the former vice president of Lehman Brothers come out with a book on July 21st titled A Colossal Failure of Common Sense that confirms all that I tried to convey in my simple posting. A top down culture of arrogance was the reason that the company failed.

As you read through the book you'll find that the head of Lehman, Richard Fuld, resisted all efforts to keep the company afloat. The mistaken belief by Fuld that he could easily avoid failure because of the prior bailout of Bear Stearns (otherwise known as moral hazard) is what led to the ultimate fall of Lehman. Additionally, it didn't help that while Paulson and Bernanke were trying to create sweetheart exit strategies for Lehman, Fuld maintained an "in-your-face" my way or the highway attitude.

As a sidebar, my comment that Bank of America "must really be in trouble" was precient considering that on September 15, 2008 the stock closed at $25.86. Even after rising 295% from the March 6, 2009 low, Bank of America is still trading 51.62% below the September 15th price. My September 14th thoughts on Bank of America got me to wondering where the company was headed so I did a Dow Theory analysis of BAC the very next day. I highly recommend that you re-read my analysis of BAC, it is well worth your time. Touc.

Please revisit Dividend Inc. for editing and revisions to this post.

Investment Observations

The following are companies, that in our view, are quality long term investment opportunities. These companies have a good chance of outperforming the S&P 500 over the next 2-3 years. For practical purposes, outperforming can mean falling less than the respective index rather than going higher.

Speculation Observations

The following are companies, that in our view, are highly speculative. Putting money into these stocks could mean that some, if not all, of initial capital can be lost in a very short period of time. The ability to accept loss and sell these stocks at lower prices must be the attitude before entering into a long position.
  • Electronic Arts (ERTS) on 1/11/2010
  • Cephalon Inc (CEPH) on 1/4/2010
  • Monsanto Company (MON) on 10/31/2009
  • Mattson Technology (MTSN) on 10/22/2009
  • Cephalon Inc. (CEPH) on 10/08/2009
  • Cephalon Inc. (CEPH) on 8/27/2009

Watch List Update

This week the market took me by surprise. The Dow rose 4%. My watch list shrank from 15 companies to 11 companies. Here are the companies on my watch list as of July 24, 2009.
Dividend Achiever Watch List

Nasdaq 100 Watch List 
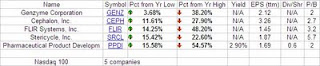
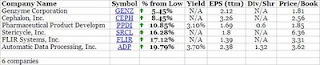
The companies that are within 10% of the low offer a great opportunity to do research and consider buying.

Market Action

The biggest development was the Dow Theory confirmation of a bull market that occurred on Thursday. The Transports confirmed the Industrials with a big move (see charts below).With this action, Richard Russell recommended people to buy Goldman Sachs (GS). I would suggest you consider either the names I recommended on this blog in the watchlist above or the Dow index (DIA) or S&P 500 index (SPY).

Recent Analysis

On July 22, 2009, I wrote an article about the current market and a comparison to the 1980's. It also contained some information and important news on real estate. Also, I did a review of my investment strategy for the Dividend Achiever Carlisle (CSL) on the July 23rd. It was a great position for those who followed my advice.

News & Video

U.S. Home Vacancies Hit 18.7 Million on Bank Seizures

Art

Dow Theory

The Dow Jones Industrials and the Dow Jones Transports both broke above previous highs on July 23rd. As shown below, the previous highs that were exceeded were the June 12th high of 8799.25 for the Industrials (blue line) and the May 6th high of 3404.11 for the Transports (red line.) Based on the fact that both indexes went to new highs on the same day would normally mean that we are in a new bull market. However, because Dow Theory considers trading volume as well as price, the fact that trading volume has been declining throughout the most recent price rise means that there isn't broad participation by either institutional or retail investors. Therefore, I would label this a cyclical bull market which can change direction to the downside without warning.

The following are the upside and downside targets for the Dow Industrials:

Upside:
  • 9,626
  • 10,302 (fair value)
  • 11,588
Downside:
  • 8192.89
  • 7754.68 (fair value)
  • 7316.49
At this point it becomes challenging to suggest buying any stocks that have already run up in price since the March 9th low. Direct exposure to the Dow Industrials or Transports might be the best way to take advantage of further moves upwards. I prefer the individual stocks with the largest weighting in the respective indexes. However, most investors probably would feel more comfortable with the exchange traded funds (ETF) DIA or IYT. ETFs aren't my cup of tea but they are alternatives to picking individual stocks.
If you've followed my blog for any amount of time then you'd know that I'm all for selling stocks that are relatively high (up from the March 9th low) and researching Dividend Achievers that are at or near a new lows. Right now there are only three Dividend Achievers within 10% of their 1 year low. The companies are Wal Mart (WMT), Bard Corp. (BCR), and Abbott Labs (ABT). I'm not comfortable with Wal Mart as explained in my June 18th posting. Additionally, I don't expect to be investing more than 50% of my portfolio during this period unless a company gets extremely underpriced. Good luck with your investing. Touc.
Please revisit Dividend Inc. for editing and revisions to this post.

About This Site

This website is intended to give new insights on a low risk approach to trading in dividend paying stocks for tax deferred accounts with the ability to buy and sell individual stocks. This website is not intended for regular or non-qualifying accounts however, the strategies and stocks mentioned can be used for non-qualifying accounts with the understanding of the consequences of potential short-term capital gains as well as the need for exceptional documentation for IRS purposes.
The stocks mentioned here are all from past and current Dividend Achievers as published by Mergent's and components of the Nasdaq 100 index. The Dividend Achiever Index of stocks was at one time published by Moody's Investor's Service. Mergent's picked up the Dividend Achievers from Moody's a few years back and has carried on the service of listing companies that have increased their dividend every year for at least 10 consecutive years in a row. The companies mentioned on this website have committed to a policy of rewarding the shareholder with dividend increases without sacrificing the potential for a higher stock price and company growth. It is strongly recommended that readers of this website first find a library that has a copy of Mergent's Dividend Achievers. After reviewing this publication you'll find that you will probably buy this book on an annual basis. Visit Mergent's Dividend Achievers website for additional information about the publication.
Only postings with Investment Observation (IO) before or after the stock name are those that are considered by New Low Observer (NLO) as worthy of being researched and then put on a watchlist and bought at the lowest possible price after the IO. All stocks that are part of NLO's IO will be followed by a sell recommendation. The absence of a sell recommendation means that the stock should be held if it has been purchased. All other stocks that are mentioned are strictly for the purpose of market or stock commentary.
Goal of this Website

When this website makes a IO it will only be in the instance that the observed stock has fallen within 20% of the 52-week (1 year) low. This is intended to bypass the problem faced by momentum investors who buy high and are forced to hold stocks until they "perform" as expected or sell the otherwise unwanted stock at a significant loss. Furthermore, Dividend Achievers allow for traders to substitute an immediate decline with holding the stock while accruing income until the price recovers.
After a stock has fallen within 20% of the 52-week low, NLO will use various means to evaluate a company. Because information about dividend paying stocks is widely available we suggest that you verify if our IO fit your short and long term investment objectives. While NLO is versed in the many ways to evaluate a stock from a fundamental and technical basis, we choose to offer up, from time to time, Dow Theory interpretations of what the stock might do.
The NLO team has no intention of fulfilling the mantra of diversification. The NLO writers feel that diversification can easily be met by owning a single S&P 500 Exchange Traded Fund (ETF) or Index Fund with low fees. NLO feels that diversification is another word for dilution of gains and reflects an investor's lack of experience and understanding of risk. Ideally, the goal of this website is to have 100% of the investment portfolio broken into fifths, at the most, and invested at all times. However, if the individual stock purchase has achieved the overall goal of exceeding the return on "safe" or "guaranteed" money then a portion or all the funds will be withdrawn from the stock market.
The primary focus of this website is to:
  • maximize the annual return of each trade.
  • reduce time between buying and selling of each stock.
  • exceed the annual yield of government guaranteed alternatives in each trade.
  • sell stocks that cut their dividends regardless of gain or loss

NLO does not subscribe to the belief that stocks should be bought and held for the "long term." Ideally, if a return of 17% can be achieved on a third of the portfolio within a six month period of time when U.S. Treasuries are yielding 5% annually then the after-tax gain of 6%-9% is justifiable. The preceding example assumes the money is in a regular or non-tax deferred account. For this reason, stocks that are part of the Investment Observations can be conceivably held as short as a day or as long as 10 years. Suffice to say, we at NLO are comfortable with gains as little as 5% as long as it exceeds the yield on government guaranteed money within a year's time.

Our Investment Strategy

The investment strategy of NLO is quite unorthodox but worth examining.

  • We only hold three stocks at a time. This means that our portfolio is broken into fifths at the most.
  • We try to be fully invested at all times. This presents challenges during bear markets (declines of 30% or more.)
  • We avoid stocks within an industry that has reached a new high.
  • High yield stocks without a dividend history are avoided. High yield often means high risk.
  • A stock is only considered a Investment Observations (IO) when it has fallen within 20% of the 1-year low.
  • Observations are put on a watchlist to be followed until an optimum price has been reached, preferably lower than the IO price.
  • Once a stock is purchased we hold until the gain on the stock doubles that of "guaranteed" money or 10% has been achieved within a 1 year time frame.
  • Stocks that have a gain of 10% or doubled the yield on guaranteed money are considered for a "sell recommendation."
  • As a stock is sold it is suggested that investors revisit the watchlist for the next stock to research.
  • Stocks to consider should be ranked in order of those that have fallen the most since the IO was issued.
  • From this point the stocks that have lost the most are re-evaluated and one is chosen for replacement of the recently sold position.

Ideally, stocks purchased using this method have the benefit of either performing (going up) in a reasonably short period of time or paying the investor for the wait. This method mirrors the "buy for the long term" approach except that it doesn't rely on the hope that the stock price will rise. Buying low(er) ensures that the investor limits the downside risk and maximizes the idea that all "investments" should derive some form of income until the investment is ultimately sold. Conveniently, this investment approach allows an investor to decided when to sell rather than being force to sell due to "buyer's remorse."

Our Team

The current contributors to this website are not registered representatives or a member of any brokers, dealers, market making firm, national or global stock exchanges. Despite our confidence in our recommendations and lacking the credentials necessary to professionally manage money, we must state that this website is for "entertainment purposes" only. We encourage your thoughtful commentary to our site as this is a forum to learn and spread knowledge.

Disclaimer

As a disclaimer, the NLO team is not liable for misunderstandings, misinterpretations, and errors that lead to investment loss. Our research is believed to be from reliable sources that are cited at all times. In the instance that a source is not cited it is done in error. It is best to assume that our team has a conflict of interest due to the fact that we may actually own the stock before the publishing of a IO or we may have sold a stock before a Sell Recommendation. We do not short sell (sell short) or hold put options on any of the Sell Recommendations that are made. Sell Recommendations are not our opinion of the management team of the company in question. Instead, Sell Recommendations are reflections of our opinion that the money invested in a particular stock is better allocated in other stocks.