Author Archives: NLObserver Team

Dividend Achiever Watch List

At the end of the week, my watch list expanded to 20 companies compared to 16 companies from the previous week. Here are the companies on my watch list as of December 18, 2009.

Symbol Name Price P/E % Yr Low Yield EPS Div/Shr Payout Ratio
SVU SUPERVALU INC 12.48 -0.89 2.89% 5.61% -13.99 0.70 -5%
CWT CALIFORNIA WATER SVC 36.66 18.33 9.47% 3.22% 2.00 1.18 59%
XOM EXXON MOBIL CP 68.21 15.89 10.27% 2.46% 4.29 1.68 39%
WTR AQUA AMERICA INC 17.29 22.72 12.35% 3.35% 0.76 0.58 76%
UMBF UMB Financial Corporation 37.94 18.07 12.75% 1.95% 2.10 0.74 35%
BCR BARD C R INC 78.49 15.72 13.85% 0.87% 4.99 0.68 14%
WMT WAL MART STORES 52.85 15.30 14.27% 2.06% 3.45 1.09 32%
SRCE 1st Source Corporation 15.83 14.26 14.38% 4.04% 1.11 0.64 58%
WEYS Weyco Group, Inc. 23.09 23.09 14.82% 2.60% 1.00 0.60 60%
NTRS Northern Trust Corporation 50.07 13.21 15.58% 2.24% 3.79 1.12 30%
UGI U G I CP 24.50 10.36 15.89% 3.27% 2.36 0.80 34%
AWR AMER ST WATER 34.51 21.30 15.96% 3.01% 1.62 1.04 64%
HSY THE HERSHEY COMPANY 35.29 20.63 16.58% 3.37% 1.71 1.19 70%
SYBT S.Y. Bancorp, Inc. 21.55 15.96 17.82% 3.16% 1.35 0.68 50%
WGL WGL HOLDINGS INC 33.70 14.11 17.87% 4.36% 2.39 1.47 62%
NWN NORTHWEST NAT GAS 44.80 15.51 18.80% 3.71% 2.89 1.66 57%
THFF First Financial Corporation 31.52 17.22 18.81% 2.86% 1.83 0.90 49%
FDO FAMILY DOLLAR STORES 28.29 13.65 18.82% 1.91% 2.07 0.54 26%
BRO BROWN & BROWN INC 17.88 15.56 19.60% 1.73% 1.15 0.31 27%
SJW S J W CP 21.93 24.42 20.36% 3.01% 0.90 0.66 73%
20 Companies
New to this list is Family Dollar (FDO) and 1st Source (SRCE).

There are several stocks that are pulling back. Bard CR (BCR) fell 6% today after two downgrades and Wal-Mart (WMT) which has been retracing back to the 50-day moving average line. We'll have to see how these names perform going forward. - Art

Citigroup (C) Continues to Struggle

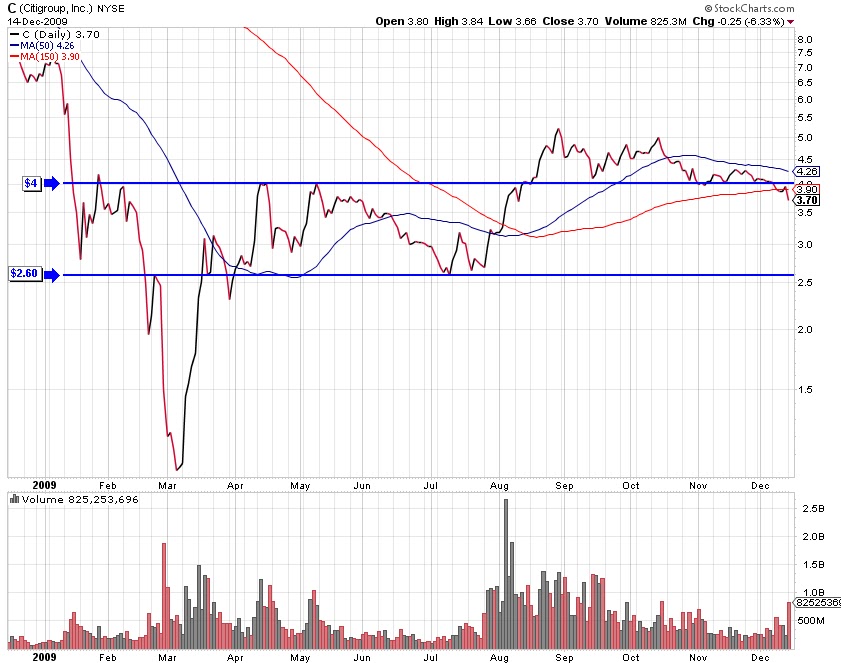
Below is a second look at an article that I published back in November 2008. This lays bare the extent of the problems faced by Citigroup. I hope anyone interested in Citigroup finds this article helpful. We can only hope that the Citi situation doesn't go the way of CreditAnstalt as described in previous articles. -Touc

The term that is the basis of all discussions in elementary economic modeling, especially when comparing two factors, is ceteris paribus. Ceteris paribus means "with other things the same" and represents the best guess as to what is likely to occur provided all thing remain unchanged. Let us take an overly simplistic view of the situation with Citigroup's government rescue plan and determine the potential outcome ceteris paribus.

According to the Wall Street Journal, in an article by David Enrich, the federal government has agreed to absorb $277 billion of $306 billion of losses that Citigroup has identified as "troubled" assets. Additionally, the Treasury is adding $20 billion on top of the $25 billion recently injected into Citigroup as part of the TARP plan. Remember, the $277 billion is separate from the $700 billion bailout package. Again, this current approach with Citi is counter to the early arguments that there needs to be a comprehensive solution, not an individual approach, to the bailouts after the fall of Fannie, Freddie, Lehman, Merrill and WaMu which spawned the TARP plan to begin with.

Now, let's look at only the off-balance sheet portion of Citigroup. The off-balance sheet portion is called an asset by Citi but isn't included on the books. The off-balance sheet items are valued at $1.23 trillion. I don't know why Citi wouldn't include these items on their balance sheet but if the U.S. government is any indication then the off-balance sheet is probably more like liabilities instead of assets.

If the government is going to front Citi $277 billion (a whopping 40% of the total TARP package for only one company) then that would leave $953 billion remaining on the off-balance sheet portfolio. If we split the $953 billion in half and conservatively assume this portion is "troubled" then we have a figure equal to $476.5 billion. Remember when Merrill Lynch auctioned off $30 billion of CDOs or "troubled" assets back in July 2008? Here's what Bloomberg.com said of that auction on July 29, 2008:

In yesterday's statement, Merrill said it agreed to sell $30.6 billion of collateralized debt obligations -- the mortgage-related bonds that have caused most of the firm's losses -- for $6.7 billion. The buyer is an affiliate of Lone Star Funds, a Dallas-based investment manager.

At the time, Merrill was only able to get $6.7 billion, a loss of 78% or $0.22 cents from every dollar originally invested. Therefore, my assumption of a 50% loss for Citi isn't so far fetched.

Ceteris paribus, this leaves Citi with at least $476.5 billion in losses to write down at some point in the future. This assumes that the economy remains in a slight recession, that earnings are the same, that the dividend for this company has been all but eliminated, that there are no further losses in the housing market. All things being equal, Citi is in for hard times. However, if we take 78% of the entire $953 billion then we get a total loss of $743 billion. A sum exceeding the amount of the entire TARP program even after a $277 billion direct injection to Citi from the government.

Clearly our government under Bush/Obama has severely underestimated the extent of how much damage has been done to our financial system. Along with the lack of knowledge that has been demonstrated, the only policy reaction is to have a blank check approach to dealing with the problem. This is what I meant when I said that 
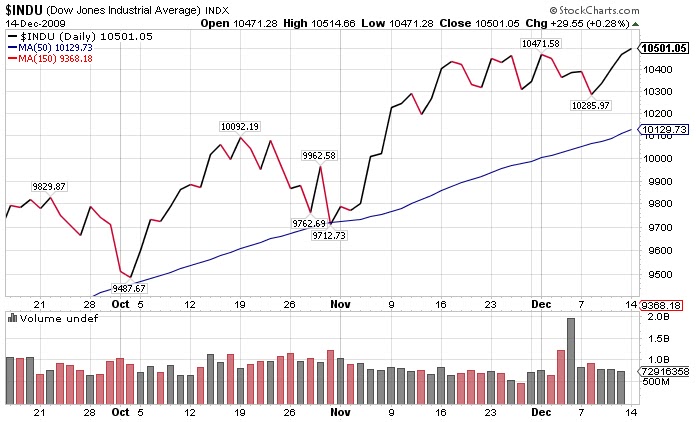
chaos will ensue when and if Bank of America falls below $14.00.

Previous articles on Citigroup

Sources:

Stock Checkup: Automatic Data Processing, Inc. (ADP)

I initiated a write up on Automatic Data Processing (ADP) on July 15th followed with a checkup on the July 30th. My original thesis of ADP was that the stock discounted the unemployment rate. The chart below shows the previous peak in the unemployment in the 1980's. Shortly after, shares of ADP peaked in May 1983. The stock didn't trade higher than the 1983 level until May 1985, two years follow.
As a result, I believe it may be time for investors to begin unloading shares of ADP. At the current price of $41.90, it is trading 34% above the yearly low and 3.6% away from the yearly high. I see this as a 34% downside risk and 3.6% reward profile, which is not much of a compelling argument to buy.
If you were to hold shares of ADP, you'd be sitting on a yield of 3.8% (assuming the original purchase price of $35). Surely that return is much greater than the average CD account and fractionally higher than treasuries. However, your principal has returned a whopping 23% is sold at or near the current price. While the company can and has raised the dividend at a double digit rate (15% CAGR since 1993), I assume that the company may not be able to retain such a pace unless growth return to the employment market.
I'm not suggesting that investor be short sighted and take any gain that comes their way, but I suggest investors to look at the valuation and the technical aspect of the stock. Currently, ADP is trading near its 2007 peak ($46.25). How likely is it that they can better their all-time high? And if they break that level, how much further can it go? See chart below.
As mentioned before, I see ADP as a bargain below $41. At $42.90, it would be wise to take some, if not all, of the profits and search for a better opportunity in the New Low Observer Watch List.

P.S. Exxon (XOM) and SUPERVALU (SVU) are currently dislike by Wall Street for various reasons. They may prove to be a better opportunity. - Art

Sell AquaAmerica (WTR) at the Market

It is now time to recommend that AquaAmerica (WTR) be sold at the market. The stock has performed moderately since the research recommendation was issued on October 31, 2009. It is highly recommended that anyone who bought the stock based on my research should re-read the posting. Unfortunately, it was not possible to buy this stock at any price lower than the recommended date.

WTR's stock price has gone nothing but up since the recommendation. However, in the pursuit of "seeking fair profits" the returns that this stock has provided within the last 46 days say that it is necessary to consider alternative opportunities.

WTR was recommended when it was trading at $15.64. As of December 15, 2009, WTR was quoted at $17.28. This equals a return of 10%. Selling this stock now generates a return of 2x greater than the amount of the dividend yield. Additionally, the 10% gain exceeds the return on a 30-year treasury purchased on October 30, 2009 by 2.35x (if held to maturity.)

Those not interested in following through with my sell recommendation can feel comfortable knowing that WTR is a great long-term holding with a 10% cushion since our research recommendation of October 31, 2009.

As I have indicated in the purposes and function of this site, the goal is to:

  • maximize the annual yield of each trade.
  • reduce time between buying and selling of each stock.
  • exceed the annual yield of government guaranteed alternatives in each trade.

Research recommendations and investment observations are intended to be a starting point for investigating a quality company at a reasonable price. It is hoped that after doing the background research you can buy the stock at a lower price. Ideally the stock should be held in a tax deferred account and should not consist of less than 20% of your holdings. Personally, I prefer holding only 2-3 stocks at a time.

Sell recommendations are intended to deal with the short term reality of the market. The tracking of the Sell recommendations are the worst case scenario if you happen to have bought a stock at the time the research recommendation was made (please avoid making this mistake.) I aim for mediocrity in my returns, therefore I am happy with 9-12% annual gains. However, since codifying my approach to investing in 2005, I have had annual returns of 20% and above every year since.

It is always recommended that when selling a stock, one should not place stop orders, limit orders or orders after hours. This leaves the seller in the position of being vulnerable to the whims of the market makers. Instead, place your sell orders only as a market order during market hours. Some would complain that a market order during market hours might leave some profits on the table. However, I would rather leave some money on the table rather than have it taken away from me by the trades that are placed by institutions and market makers. Touc.

Dow Theory

The market continues to move higher. We got a cyclical bull market confirmation within the context of a secular bear market at the close. The Industrials closed at 10,501.05, above the previous high of 10,471.58. The Transports also closed higher at 4,165.11. Art.

Stocks in Focus

Exxon (XOM) announced that it will acquire XTO Energy (XTO) in a $31 billion dollar stock deal. Shares of XOM fell 4.3% today. XOM is trading 12% above the 52 weeks low and 16% below the 52 week high. Such dislocation may provide a good opportunity to buy Exxon.
Another name that popped up today was Citigroup (C). After announcing that they will pay back $20 billion of TARP by issuing more shares, the stock fell 6.3% and is now trading below $4. I've written about the technical buy level for Citi and B of A in September. Citigroup may be a good trade if and only if it trades down to $2.60. Please note, this is purely speculation. Art.

Reader Q & A

Question:
How do you determine that a stock price is undervalued?

Answer:
Because there are many ways to answer your question, I will first refer you to the standard responses to your questions. Please follow the link to Wikipedia's response to the question of when a stock is undervalued.
Our view at New Low Observer on undervaluation is that, after selecting companies that have a proven track record of dividend increases over many years, stocks are likelier to be fairly valued or undervalued as the price falls to a new 1 year low. Although this seems obvious, most investors are unwilling to investigate a stock that has a falling price history for fear of a continuation of the trend. The prevailing view is, "I will wait until the price starts moving up before investing in company X."

Our experience has been that, provided the company has a history of dividend payments (something that cannot be manipulated through accounting methods) and all other financials attributes being in order, the company is put on a list to be acquired at the earliest opportunity. A great book that summarizes our general approach is "Dividends Don't Lie" by Geraldine Weiss and the upcoming book "Dividends Still Don't Lie" by Kelly Wright. In these books the main idea is that quality stock tend to trade in a price range based on the dividend yield.

Question:

How do you define P/E ratio? What does it indicate?

Answer:
In addressing your question, I would refer you to Investopedia's response to what P/E means. The idea of price-earnings (P/E) ratios is pretty straightforward. However, we use the P/E ratio as a means to compare to the relative history of the stock in question. Some people like to compare the P/E ratio to the stock market indexes like the S&P 500 or Russell 2000 Index. A P/E above the indexes would signal that the stock might be overpriced, a P/E below the indexes might mean the stock is underpriced. However, we try to identify what the historical range for the stock is as compared to itself and not the index. If it is a quality company, there may exist a pattern of falling and rising price based on the historical tendency of the P/E ratio.

Question:

What does the one year low indicate?

Answer:
The new low of a company's price indicates that the stock in question needs to be examined for potential purchase. This is in stark contrast to recommending a stock that has increased in price by 30% to 50%. Just like shopping for clothes, food, or a computer, we gravitate towards lower prices and careful consideration of what we buy. We operate on the mantra of caveat emptor or buyer beware.

I hope the above explanations have peaked your interest in the basics of investing. Much of what we have pointed out about considering the purchase of stocks is rooted in being reluctant participants of a consumer society. However, we have transferred the same skills as consumers of liabilities to the acquisition of assets. I hope you have time to read the book "Dividends Don't Lie" through your local library (save some money) until the new book comes out next year. Touc.

Nasdaq 100 Watch List

The following are Nasdaq 100 members that are within 20% of the 52-week low:

  • Genzyme Corp. (GENZ) at $49.74 within 5.63%
  • Apollo Group (APOL) at $56.58 within 7.18%
  • Cephalon, Inc. (CEPH) at $58.94 within 12.16%
  • Electronic Arts (ERTS) at $16.11 within 13.13%
  • Gilead Sciences (GILD) at $46.42 within 14.28%
  • Ryanair Holdings (RYAAY) at $25.34 within 16.40%
  • Biogen Idec (BIIB) at $48.65 within 16.53%
  • Pharma. Prod. Dev. (PPDI) at $21.41 within 16.53%

Dividend Achiever Watch List

At the end of the week, my watch list contains 16 companies, same as the previous week. Here are the companies on my watch list as of December 11, 2009.
Symbol
Name
Price
P/E
% Yr Low
Yield
EPS
Div/Shr
Payout Ratio
WTR
AQUA AMERICA INC
17.02
22.37
10.59%
3.41%
0.76
0.58
76%
NTRS
Northern Trust Corp.
48.12
12.70
11.08%
2.33%
3.79
1.12
30%
SVU
SUPERVALU INC
13.39
-0.96
11.40%
5.23%
-13.99
0.70
-5%
CWT
CALIFORNIA WATER
37.60
18.80
12.27%
3.14%
2.00
1.18
59%
THFF
First Financial Corp.
30.13
16.46
13.57%
2.99%
1.83
0.90
49%
UMBF
UMB Financial Corp.
38.59
18.38
14.68%
1.92%
2.10
0.74
35%
UGI
U G I CP
24.33
10.31
15.09%
3.29%
2.36
0.80
34%
WGL
WGL HOLDINGS INC
33.27
13.92
16.37%
4.42%
2.39
1.47
62%
SYBT
S.Y. Bancorp, Inc.
21.40
15.85
17.00%
3.18%
1.35
0.68
50%
XOM
EXXON MOBIL CP
72.83
16.96
17.73%
2.31%
4.29
1.68
39%
WMT
WAL MART STORES
54.65
15.82
18.16%
1.99%
3.45
1.09
32%
WEYS
Weyco Group, Inc.
23.80
23.80
18.35%
2.52%
1.00
0.60
60%
NWN
NORTHWEST NAT GAS
44.84
15.52
18.91%
3.70%
2.89
1.66
57%
BRO
BROWN & BROWN INC
17.79
15.48
19.00%
1.74%
1.15
0.31
27%
HSY
THE HERSHEY CO.
36.02
21.06
19.00%
3.30%
1.71
1.19
70%
BCR
BARD C R INC
83.05
16.64
20.47%
0.82%
4.99
0.68
14%
16 Companies


The new addition to this week list is SUPERVALU (SVU) which got hammered after Kroger (KR) plunged on Tuesday after they reported earning. Removed from this list is Piedmont Natural Gas (PNY), one of my holdings.

Sell Monsanto (MON) at the Market

Again, it is just our luck that Monsanto (MON) has done exactly what we had anticipated. On October 30th we issued a Speculation Observation which indicated that MON should be considered for short term gains. However, our upside target price was around $76, in this regard we were woefully incorrect.

MON has managed to climb to the level of $83.38 as of December 9th. Anyone who was bold enough to take our observation to heart would have a 22% gain on their hands. It is strongly recommend that a mental trailing stop is instituted to ensure retention of the gains. Personally, we would sell the stock and wait for new opportunities. Touc.

Dividend Achiever Watch List

At the end of the week, my watch list contains 16 companies compared to 17 from the previous week. Here are the companies on my watch list as of December 4, 2009.
Symbol Name Price P/E % Yr Low Yield EPS Div/Shr Payout Ratio
WTR AQUA AMERICA INC 16.81 22.12 9.23% 3.45% 0.76 0.58 76%
WGL WGL HOLDINGS INC 31.86 13.33 11.44% 4.61% 2.39 1.47 62%
UGI U G I CP 23.59 10.00 11.59% 3.39% 2.36 0.80 34%
NTRS Northern Trust Corporation 48.69 12.85 12.42% 2.30% 3.79 1.12 30%
CWT CALIFORNIA WATER SVC 37.67 18.84 12.48% 3.13% 2.00 1.18 59%
THFF First Financial Corporation 30.03 16.41 13.19% 3.00% 1.83 0.90 49%
NWN NORTHWEST NAT GAS 43.75 15.14 16.02% 3.79% 2.89 1.66 57%
WMT WAL MART STORES 54.24 15.70 17.28% 2.01% 3.45 1.09 32%
PNY PIEDMONT NAT GAS CO 24.46 15.78 18.28% 4.42% 1.55 1.08 70%
WEYS Weyco Group, Inc. 23.84 23.84 18.55% 2.52% 1.00 0.60 60%
HSY THE HERSHEY COMPANY 35.99 21.05 18.90% 3.31% 1.71 1.19 70%
SYBT S.Y. Bancorp, Inc. 21.83 16.17 19.35% 3.11% 1.35 0.68 50%
UMBF UMB Financial Corporation 40.31 19.20 19.79% 1.74% 2.10 0.70 33%
BRO BROWN & BROWN INC 17.92 15.58 19.87% 1.73% 1.15 0.31 27%
XOM EXXON MOBIL CP 74.25 17.31 20.03% 2.26% 4.29 1.68 39%
BCR BARD C R INC 83.04 16.64 20.45% 0.82% 4.99 0.68 14%
16 Companies


It wasn't that long ago that biotech / pharma sector wasn't doing anything. The street hated them and I placed them on my watch list. On October 2, 2009, I highlighted 5 names in that sector, especially CAH. Let's take a look at where they are now.
Symbol Name 2-Oct 4-Dec %Gain
BCR BARD C R INC 77.39 83.04 7.30%
ABT ABBOTT LABORATORIES 49.84 53.78 7.91%
LLY LILLY ELI CO 32.51 37.39 15.01%
BDX BECTON DICKINSON CO 67.30 78.05 15.97%
CAH CARDINAL HEALTH INC 26.25 32.14 22.44%


Dow Jones Industrial Avg
9488 10389 9.50%

S&P 500 1025 1106 7.88%
It sure is too late now but if you see sectors that are under perform it may be a good starting point. There are a lot of utilities companies on the list but they rely heavily on interest rate so I urge you to do extensive research on them prior to purchase.

Dividend Achiever Watch List

The Dow closed this week 10,309.92. At the end of the week, my watch list rose to 17 companies compared to 16 from the previous week. Here are the companies on my watch list as of November 27, 2009.

Symbol Name Price P/E % Yr Low Yield EPS Div/Shr Payout Ratio
AWR AMER ST WATER 32.12 19.83 16.55% 3.24% 1.62 1.04 64%
BCR BARD C R INC 81.86 16.40 18.74% 0.83% 4.99 0.68 14%
BRO BROWN & BROWN INC 17.62 15.32 17.86% 1.76% 1.15 0.31 27%
CTBI Community Trust Bancorp 23.00 14.20 2.00% 5.22% 1.62 1.20 74%
CWT CALIFORNIA WATER 36.26 18.13 8.27% 3.25% 2.00 1.18 59%
HSY THE HERSHEY CO. 35.60 20.82 17.61% 3.34% 1.71 1.19 70%
NJR N J RESOURCES CP 35.31 13.43 17.90% 3.51% 2.63 1.24 47%
NWN NORTHWEST NAT GAS 42.79 14.81 13.47% 3.88% 2.89 1.66 57%
PNY PIEDMONT NAT GAS CO 23.62 15.24 14.22% 4.57% 1.55 1.08 70%
RLI R L I CP 49.98 15.67 17.57% 2.16% 3.19 1.08 34%
THFF First Financial Corp. 28.03 15.32 5.65% 3.21% 1.83 0.90 49%
UGI U G I CP 23.53 9.97 11.31% 3.40% 2.36 0.80 34%
UMBF UMB Financial Corp. 39.00 18.57 15.90% 1.79% 2.10 0.70 33%
WEYS Weyco Group, Inc. 22.34 22.34 11.09% 2.69% 1.00 0.60 60%
WGL WGL HOLDINGS INC 31.46 13.16 10.04% 4.67% 2.39 1.47 62%
WMT WAL MART STORES 54.63 15.83 18.12% 2.00% 3.45 1.09 32%
WTR AQUA AMERICA INC 16.09 21.17 4.55% 3.60% 0.76 0.58 76%
17 Companies

New addition to this week is Hershey (HSY).

Nasdaq 100 Watch List

The following are the Nasdaq 100 members that are within 20% of the 52-week low:

  • Cephalon, Inc. (CEPH) at $55.23 within 5.10%
  • Apollo Group (APOL) at $55.76 within 5.63%
  • Genzyme Corp (GENZ) at $51.07 within 8.45%
  • Gilead Sciences (GILD) at $46.56 within 14.62%
  • Ryanair Holdings (RYAAY) at $25.83 within 18.65%
  • Pharma. Prod. Dev. (PPDI) at $21.41 within 19.14%
  • First Solar Inc. (FSLR) at $120.30 within 19.23%
  • Electronic Arts (ERTS) at $17.01 within 19.45%

Dividend Achiever Watch List

The market closed at 10,318.16 this week, virtually flat from prior week. At the end of the week, there are 16 companies compared to 18 from the previous week. Again, I added the regional banks to this list last week. Here are the companies on my watch list as of November 20, 2009.

Symbol
Name
Price
P/E
% Yr Low
Yield
EPS
Div/Shr
Payout Ratio
WTR
AQUA AMERICA INC
15.88
20.87
3.18%
3.65%
0.76
0.58
76%
THFF
First Financial Corporation
27.96
15.28
5.39%
3.22%
1.83
0.90
49%
CWT
CALIFORNIA WATER SVC
35.78
17.93
6.84%
3.30%
2.00
1.18
59%
WGL
WGL HOLDINGS INC
31.33
13.11
9.58%
4.69%
2.39
1.47
62%
UGI
U G I CP
23.36
9.88
10.50%
3.42%
2.36
0.80
34%
PNY
PIEDMONT NAT GAS CO
23.01
14.85
11.27%
4.69%
1.55
1.08
70%
NWN
NORTHWEST NAT GAS
42.82
14.82
13.55%
3.88%
2.89
1.66
57%
WEYS
Weyco Group, Inc.
23.17
23.17
15.22%
2.59%
1.00
0.60
60%
AWR
AMER ST WATER
31.94
19.72
15.89%
3.26%
1.62
1.04
64%
BCR
BARD C R INC
80.72
16.17
17.09%
0.84%
4.99
0.68
14%
UMBF
UMB Financial Corporation
39.48
18.80
17.33%
1.77%
2.10
0.70
33%
WMT
WAL MART STORES
54.28
15.73
17.36%
2.01%
3.45
1.09
32%
NJR
N J RESOURCES CP
35.40
13.46
18.20%
3.50%
2.63
1.24
47%
BRO
BROWN & BROWN INC
17.83
15.50
19.26%
1.74%
1.15
0.31
27%
RLI
R L I CP
50.84
15.94
19.60%
2.12%
3.19
1.08
34%
XOM
EXXON MOBIL CP
74.38
17.33
20.24%
2.26%
4.29
1.68
39%
16 Companies

Buffett Buy Low

Some of you may know that I bought Wal-Mart in September. Today news from CNBC was most welcomed as Warren Buffett announced he nearly doubled his share counts in Wal-Mart during the summer. Share count rose from 19.9 million shares to 37.84 million shares (90% increase). In addition to Wal-Mart, he also bought more Exxon. Both companies are listed in our watch list. - Art