Author Archives: NLObserver Team

Dividend Achiever Watch List

At the end of the week, my watch list contains 21 companies compared to 22 companies from the previous week. Here are the companies on my watch list as of January 22, 2010.

Symbol Name Price % Yr Low P/E EPS Div/Shr Yield Payout Ratio
SHEN Shenandoah Telecom 17.06 5.96% 27.52 0.62 0.32 1.88% 52%
XOM EXXON MOBIL CP 66.10 6.85% 15.40 4.29 1.68 2.54% 39%
THFF First Financial Corp. 28.71 8.22% 15.69 1.83 0.90 3.13% 49%
CWT CALIFORNIA WATER 36.47 8.90% 18.24 2.00 1.18 3.24% 59%
WTR AQUA AMERICA INC 17.14 11.37% 22.55 0.76 0.58 3.38% 76%
SRCE 1st Source Corporation 15.46 11.71% 13.93 1.11 0.64 4.14% 58%
WEYS Weyco Group, Inc. 22.58 12.28% 22.58 1.00 0.60 2.66% 60%
WGL WGL HOLDINGS INC 32.13 12.38% 13.44 2.39 1.47 4.58% 62%
AWR AMER ST WATER 33.52 12.63% 20.69 1.62 1.04 3.10% 64%
NTRS Northern Trust Corp. 52.07 13.74% 13.74 3.79 1.12 2.15% 30%
SYBT S.Y. Bancorp, Inc. 20.87 14.11% 15.46 1.35 0.68 3.26% 50%
WMT WAL MART STORES 52.94 14.46% 15.33 3.45 1.09 2.06% 32%
BCR BARD C R INC 79.44 15.23% 15.92 4.99 0.68 0.86% 14%
FPL F P L GROUP INC 48.14 16.06% 11.66 4.13 1.89 3.93% 46%
NWN NORTHWEST NAT GAS 43.85 16.28% 15.17 2.89 1.66 3.79% 57%
MON* MONSANTO COMPANY 77.89 17.00% 28.04 2.78 1.06 1.36% 38%
UGI U G I CP 25.00 18.26% 10.59 2.36 0.80 3.20% 34%
T AT&T INC. 25.39 18.42% 12.57 2.02 1.68 6.62% 83%
RBCAA Republic Bancorp, Inc. 17.12 19.14% 8.48 2.02 0.53 3.10% 26%
FDO FAMILY DOLLAR STORES 30.36 19.81% 14.19 2.14 0.54 1.78% 25%
HSY THE HERSHEY CO. 36.28 19.85% 21.22 1.71 1.19 3.28% 70%
21 Companies

*Although Monsanto (MON) isn't a Dividend Achiever, we feel that it has a good potential of becoming one.

- Art

Upcoming Ex-Dividend Dates for Dividend Achiever Watch List

Below are the approximate ex-dividend dates for companies that appeared on our Dividend Achiever watchlist dated January 15, 2010. If you happen to be researching these companies for potential investment it would be advisable to consider the ex-dividend date prior to possible purchases. Owning the shares of the company that you're interested in before the ex-dividend date entitles you to the upcoming dividend payment. Owning the shares after the ex-dividend date means that you would have to wait at least three months before receipt of the next payment.
Please verify the ex-dividend date and payout ratio before committing funds to these stocks. Additionally, do not base your next long or short term purchase on the dividend payment or yield. Instead, get as much research in as you possibly can before the ex-dividend date "just in case." Be advised that our Investment Observation of SVU has run up 18.81% in 15 days and will not appear on our watch list until it falls within 20% of the most recent 52-week low. -Touc
Name Symbol % from Yr Low Approx. Ex-Dividend Date
1st Source Corporation
10.19%
2010-01-30
EXXON MOBIL CP
7.82%
2010-02-06
CALIFORNIA WATER SVC
9.53%
2010-01-31
Weyco Group, Inc.
10.99%
2010-02-13
AQUA AMERICA INC
12.80%
2010-02-10
AMER ST WATER
13.17%
2010-02-05
NORTHWEST NAT GAS
16.73%
2010-01-27
SUPERVALU INC
25.47%
2010-02-26
THE HERSHEY COMPANY
19.56%
2010-02-20

Wrong Time For Recommendations

After the market in 2009, I've been searching the internet for some new ideas. Not surprisingly, I came across an article with the following sensational title, "Five Small-Cap Stocks to Own Now" from TheStreet.com.
The five stocks recommended are as follow:
  1. InterOil (IOC)
  2. Sharps Compliance (SMED)
  3. China Green Agriculture (CGA)
  4. Sourcefire (FIRE)
  5. Hi-Tech Pharmacal (HITK)
If someone is searching for a great gamble then these companies might fit the bill. For anyone who is concerned about safety of principal with a margin of safety and the prospect of buying-and-holding, these companies are far from ideal. Here is the simplest reason why. All of these stocks have risen by more than 300% over the past year.
If someone chooses to buy-and-hold, one should have considered these names at or near the low in early 2009. It is irresponsible to tell investors that they should buy something that outperformed the market by 15 times. The job of a reporter should be to report the facts which, in the area of financial journalism, often arrive too late. In this case, 300%+ after the fact. It isn't hard to go back to the earnings calls and report that company margins improved, market conditions stabilized, and so on. However, to expound on the virtues of companies that have exceeded even the most optimist scenarios within the context of a secular bear market borders on criminality when judged on the basis of the wide distribution that TheStreet.com has.
For investors seeking safety and fair returns on their investments, they should examine our approach as outlined in the article "Buy Low, Sell High.". - Art

Dow Theory on Fair Value

The purpose of this article is to demonstrate how Dow Theory approaches the question of the fair value of a stock. Most investors often hear of an analyst giving a fair value for a stock. Seldom is there ever a full description of the meaning of fair value or how exactly fair value is arrived at. Even when there is a description of how fair value is arrived at most investors have a hard time understanding what exactly it means if a stock they own goes from undervalued or overvalued to fair value.


Another name for fair value is intrinsic value. One source that we would derive our definition of intrinsic value is in Security Analysis by Graham and Dodd. According to a 1962 edition of Security Analysis:


“A general definition of intrinsic value would be ‘that value which is justified by the facts, e.g., assets, earnings, dividends, definite prospects, including the factor of management.’ The primary objective in using the adjective ‘intrinsic’ is to emphasize the distinction between value and current market price, but not to invest this ‘value’ with an aura of permanence. In truth, the computed intrinsic size is likely to change at least from year to year, as the various factors governing that value are modified. But in most cases intrinsic value changes less rapidly and drastically than market price and the investor usually has an opportunity to profit from any wide discrepancy between the current price and the intrinsic value as determined at the same time.


“The most important single factor determining a stock’s value is now held to be the indicated average future earning power, i.e., the estimated average earnings for a future span of years. Intrinsic value would then be found by first forecasting this earning power and then multiplying that prediction by an appropriate ‘capitalization factor.’”


Graham and Dodd. Security Analysis. McGraw-Hill. New York. 1962. Page 28.


The challenge with the definition of intrinsic value is the “facts” as described by Graham and Dodd. First, the valuing of assets could be done above or below their true worth. Second, earnings could be managed or manipulated in a fashion that is inconsistent with the company’s true health. Third, a company’s prospects are subject to vagaries in the market and therefore are not definite. Fourth, depending on the compensation method used for the company’s management, those in charge may act in a fashion that is counter to the continued growth of the company. The only certainty is the payment of dividends that have already taken place. In my experience observing stocks, I have seen the change in management, earnings, prospects and assets but never the change in ex post dividend payments.


Even within the definition of intrinsic value, Graham and Dodd submit to the fact that we cannot expect current conditions to exist into perpetuity. Additionally, the idea of forecasting into the future, “over a span of years,” a company’s earning potential seems to be more hopeful than anything else. The fair value of the company can decline with little more reason than a significant decline in stock price.


The spurious nature of intrinsic value can be demonstrated in what is known as an impairment charge. Recently there have been two Dividend Achievers that have had impairment charges which have significantly reduced the fair value of the company. In one instance, Supervalu (SVU) noted in their Form 10-Q filing that the “retail food operating loss for the third-quarter and year-to-date ended November 29, 2008 reflects the preliminary estimate of goodwill and asset impairment charges of $3,250,000 related to the write-down of goodwill and other intangible assets required by Statement of Financial Accounting Standards (SFAS) number 142.” What this means is that because the stock price fell so much in such a short period of time, the company was forced to adjust their fair value lower due to SFAS rule number 142.


In another example, Nacco Industries (NC) stated in their 4th quarter earnings call that, “during the quarter, the company wrote off the goodwill on its books. Because the company stock price at year end was significantly below the company’s books by tangible assets and its book value of equity, accounting rules effectively required the company taking non-cash write-off of goodwill and certain other intangible assets totaling $436 million or 431.6 million net of taxes of $4.1 million the company recorded those pretax charges as follows…” Again, this is an example of accounting rules (SFAS rule No. 142) determining the change in the value of the stock’s fair value.


Although these were “legitimate” changes to the fair value of the companies, one cannot overlook the fact that much of the fair value can be based on interpretation. Also, the timing of the changes can occur at times that are not consistent with the decline in earnings or future prospects. In the two prior examples these declines in fair value were based on the declines in stock price due to the market panic from 2007 to 2009.


Most fundamental analysis of stocks has been done based on the Graham and Dodd method which was codified in 1934 after the stock market crash from 1929 to 1933. Before 1929, there were other methods for determining a company’s fair value. One method that I have studied extensively is the Dow Theory method. Most followers of Dow Theory might not realize it but the “50% Principle,” as coined by George E. Schaefer but elaborated in great detail by Charles H. Dow, is the method for arriving at a stock’s “fair value.”


From a Dow Theory perspective, a company’s fair value is as simple to determine as the prior period of increase or decline in the stock price. However, understanding the nuances will allow for better interpretation of the meaning of fair value according to Dow Theory.


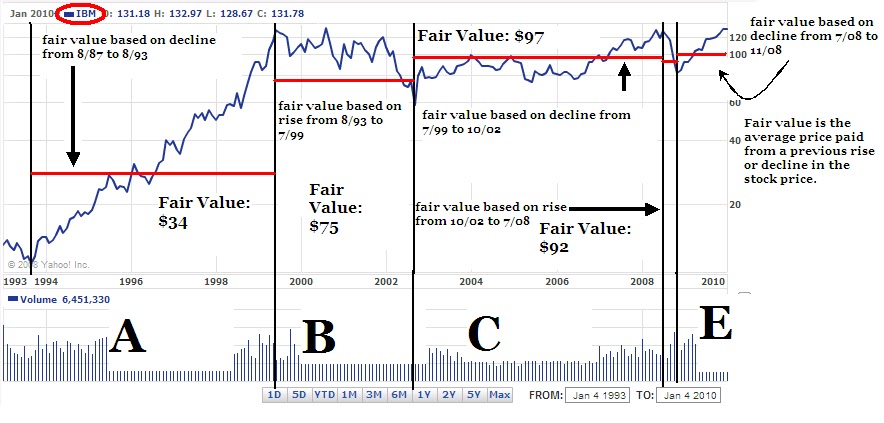
According to Dow Theory, fair value is arrived at based on one half the previous increase in the stock’s price or one half the previous decrease in the stock price. In the example above, I have selected IBM to show how fair value works according to Dow Theory.


In section A, I have indicated that the rise in 1993 to the peak in 1999 had an established fair value based on the prior decline from 1987 to 1993 (red line.) The prior declining period set fair value for IBM at $34. When IBM went from $10 up to $34 the company’s stock was considered at fair value. Any further increase in price was considered overvalued. Theoretically, any investor who bought the stock below $34 should accept that any further increase in price is icing on the cake.


Because the stock rose from $10 to $140 in the period from 1993 to 1999, a new fair value was established at $75. Section B carried the fair valuation of $75 indicating that anyone who bought the stock below $75 was getting a bargain.


In section C, I have indicated that the decline from 1999 to the trough in 2002 established a new fair value for the following increase at $97. In section C, from the 2002 low to the 2008 high, the fair value became $92. In section D, after the decline from July 2008 to November 2008 the new fair value became $100 in section E.


Each time a stock completes a major decline or increase, a new fair valuation can be established. For the cautious investor, the fair value for the next increase is derived from the previous decline and the increase that preceded the previous decline. This establishes a range that an investor would determine where a stock is fairly valued. A real-time fair value can be determined based on the most recent price trend however, an investor has to accept that, without a turn in the price (confirmation), the position is at significant risk. Below is an attempt to demonstrate how the process works.


In July 2008, an analyst issued a strong buy report on Lowe’s (LOW) when the stock was trading at $18.90. At the time, the analyst indicated Lowe’s had a fair valuation of $32.27 using an assortment of Graham and Dodd methods. However, if using the Dow Theory method for determining fair valuation, an investor would have arrived at a fair value of $26.92.


Old high of $34.93 set on 2/20/07
[($34.93-$18.90)/2]+$18.90=$26.92


Subsequent to the report that was issued at $18.90, LOW closed at $27.36 on September 8, 2008 and then traded down from that point until it rested at the $13 level in March of 2009. Using the Dow Theory method for fair valuation, an investor would have sold the stock on the approach to $26.92 and then waited to see what would have developed from there. My personal modification to this method is to move on to a different stock altogether.


Unfortunately, a person who followed the analyst recommendation of expecting the stock to go to $32.27, or fair valuation, would have held on regardless of the stock never getting to $32 and instead declining back to $18.90 and below.


Now with LOW at $13, the new fair value, according to Dow Theory, based on the old high of $34.93, is $23.97. Well, from the $13 level, LOW traded up to $24.17 and has since reversed to the downside at the current price of $23.13. Again, the investor following the Dow Theory method would have sold the stock as it approached the $23.97 level.


Anyone who had based their purchase of LOW on July 2008 using the analyst’s future fair value of $32 would have not seen the price come close to predicted fair value.


While not infallible, the Dow Theory method addresses the most primary elements seen by all investors, the price movement. Although background in Graham and Dodd never hurt anyone, fundamentals are, at times, a distraction from what the most uninitiated gambler can see without having to crack open a single investment report. Additionally, an equal number of investors and speculators are on either side of the fair value range. This gives incentive to either buy, hold or sell the stock based on crossing the fair value plane.


Some would ascribe the Dow Theory 50% principle to the use of Fibonacci counts however, R.N. Elliot’s popularization of the application of Fibonacci’s to stock prices didn’t catch on until long after the establishment of Dow Theory. The use of Dow’s Theory in determining fair value gives investors the opportunity to see exactly how much the market discounts everything. It is clear that buying and selling a stock in such a short period of time is considered diametrically opposed to the Graham and Dodd method. However, it would benefit all who wish to obtain a reasonable approximation of fair value to consider the Dow Theory approach. -Touc


  • Moves to the downside project fair values for the upside. Moves to the upside project fair value for the downside.

Nasdaq 100 Watch List

Symbol Name Price Price/Earnings
Earnings Per Share
Dividend Yield Price/Book % from Yr Low
Gilead Sciences, Inc.
45.52
17.60
2.59
N/A
7.26
12.06%
Genzyme Corporation
53.45
30.47
1.75
N/A
1.88
13.51%
Apollo Group, Inc.
60.37
14.53
4.16
N/A
6.43
14.36%
Electronic Arts Inc.
17.03
N/A
-4.06
N/A
2.10
19.59%
Cephalon, Inc.
63.10
17.44
3.62
N/A
2.23
20.08%
Above are the Nasdaq 100 companies that are within 20% of the 52-week low. This list is strictly for the purpose of researching whether or not the companies have viable business models or are about to go out of business. These companies are deemed highly speculative unless otherwise noted. -Touc

Dividend Achiever Watch List

At the end of the week, my watch list expanded slightly to 22 companies compared to 18 companies from the previous week. Here are the companies on my watch list as of January 15, 2010.

Symbol Name Price P/E % Yr Low Yield EPS Div/Shr Payout Ratio
SHEN Shenandoah Telecom 17.18 27.71 6.71% 1.86% 0.62 0.32 52%
THFF First Financial Corporation 28.97 15.83 9.20% 3.11% 1.83 0.90 49%
SRCE 1st Source Corporation 15.14 13.64 9.39% 4.23% 1.11 0.64 58%
XOM EXXON MOBIL CP 69.11 16.11 11.72% 2.43% 4.29 1.68 39%
CWT CALIFORNIA WATER 37.70 18.85 12.57% 3.13% 2.00 1.18 59%
WGL WGL HOLDINGS INC 32.48 13.59 13.61% 4.53% 2.39 1.47 62%
WEYS Weyco Group, Inc. 22.89 22.89 13.82% 2.62% 1.00 0.60 60%
WTR AQUA AMERICA INC 17.59 23.14 14.29% 3.30% 0.76 0.58 76%
OKSB Southwest Bancorp, Inc. 6.25 9.92 14.47% 1.60% 0.63 0.10 16%
UGI U G I CP 24.25 10.26 14.71% 3.30% 2.36 0.80 34%
SYBT S.Y. Bancorp, Inc. 21.05 15.59 15.09% 3.23% 1.35 0.68 50%
AWR AMER ST WATER 34.49 21.29 15.89% 3.02% 1.62 1.04 64%
WMT WAL MART STORES 53.68 15.56 16.06% 2.03% 3.45 1.09 32%
NWN NORTHWEST NAT GAS 44.02 15.23 16.73% 3.77% 2.89 1.66 57%
SVU SUPERVALU INC 14.32 31.82 18.05% 2.44% 0.45 0.35 78%
UMBF UMB Financial Corporation 39.82 18.96 18.34% 1.86% 2.10 0.74 35%
RBCAA Republic Bancorp, Inc. 17.08 9.18 18.86% 3.10% 1.86 0.53 28%
NTRS Northern Trust Corporation 51.55 13.60 19.00% 2.17% 3.79 1.12 30%
HSY THE HERSHEY CO. 36.25 21.20 19.76% 3.28% 1.71 1.19 70%
BCR BARD C R INC 82.62 16.56 19.84% 0.82% 4.99 0.68 14%
T AT&T INC. 25.79 12.77 20.29% 6.51% 2.02 1.68 83%
FDO FAMILY DOLLAR STORES 30.61 14.33 20.80% 1.76% 2.14 0.54 25%
22 Companies              

Art

Sell SuperValu (SVU) at the Market

It is now time to recommend that SuperValu (SVU) be sold at the market. The stock has performed well since the investment observation was issued on January 6, 2010. It is highly recommended that anyone who bought the stock based on Art's insight should re-read the posting. Unfortunately, it was not possible to buy this stock at any price lower than on the recommended date.

SVU's stock price has gone nothing but up since the recommendation. However, in the pursuit of "seeking fair profits" the returns that this stock has provided within the last 9 days say that it is necessary to consider alternative opportunities. The key to investment success and a key principle of economics is to seek the best alternatives.

SVU was recommended when it was trading at $12.81. As of January 14, 2010, SVU was quoted at $14.33. In after-hour trading, SVU was up $0.05 to $14.38. Based on the closing price of $14.33, SVU has gained 11.87%. The annualized return on this position would be 481%. Selling this stock now generates a return of 4.75x greater than the amount of the dividend yield if held for a full year. Additionally, the 11.87% gain exceeds the return on a 30-year treasury purchased on January 6, 2010 by 2.53x (if held to maturity.)

Those not interested in following through with our sell recommendation can feel comfortable knowing that SVU is a great long-term holding with an 11.87% downside cushion since our investment observation.

As we have indicated in the purposes and function of this site, our goal is to:

  • maximize the annual yield of each trade.
  • reduce time between buying and selling of each stock.
  • exceed the annual yield of government guaranteed alternatives in each trade.
Investment observations are intended to be a starting point for investigating a quality company at a reasonable price. It is hoped that after doing the background research you can buy the stock at a lower price. Ideally the stock should be held in a tax deferred account and should not consist of less than 20% of your holdings. Personally, we prefer holding only 2-3 stocks at a time.

Sell recommendations are intended to deal with the short term reality of the market. The tracking of the Sell recommendations are the worst case scenario if you happen to have bought a stock at the time the Investment Observation was made (please avoid making this mistake.) We aim for mediocrity in our returns, therefore we are happy with 9-12% annual gains. However, since codifying this approach to investing in 2005, we have had annual returns of 20% and above every year since.

It is always recommended that when selling a stock, one should not place stop orders, limit orders or orders after hours. This leaves the seller in the position of being vulnerable to the whims of the market makers. Instead, place your sell orders only as a market order during market hours. Some would complain that a market order during market hours might leave some profits on the table. However, we would rather leave some money on the table rather than have it taken away from us by the trades that are placed by institutions and market makers. -Touc.

Investment Observation: Gilead Sciences (GILD) at $45.52

In my August 3o, 2009 article titled "Reviewing the Stock Analysts," I pointed out a book that I felt would advance your ability to analyzing individual stocks much better than whatever method that you might be using. In the article that I posted on August 30th, I stated that I'm convinced that if you buy the book Quest For Value you would have made a wise investment.

The only reason that I'm convinced that Quest For Value is useful is due to the third party examination of the performance of the approach as applied by Matrix USA. On a consistent basis, the economic value added (EVA) method was attributable to Matrix USA beating all other stock analysts for buying and selling stocks.

Now, in the most recent issue of Fortune Magazine dated January 18, 2010, Geoff Colvin reiterates that using the economic value added (EVA) approach is resoundingly effective at discerning quality stocks without the ability of corporations to tweak or fudge the financials through generally accepted accounting principles.

The punchline to the Colvin article is that of the three top quality companies based on the EVA model, Gilead Sciences (GILD) is among them. GILD happens to be one of the Nasdaq 100 companies on our most recent watch list. On October 23, 2009, I indicated that based on the Coppock Curve, GILD would be among the best companies to investigate for a potential purchase. I am reiterating the belief that GILD is worthy of investigating since it has not varied by much since my last look at the company. -Touc

related articles:

Predictions Worth Noting

Over the years, analysts and economists attempt to make a yearly prediction of where the market and economy will end up. Some are right and some are wrong. With 2010 underway, a storm of 2010 outlooks are posted on websites and blogs. But some predictions are worth noting and discussing. One particular strategist, Byron Wien, gave ten predictions for 2009 (The Surprise of 2009). Seven out of ten came to fruition. His accuracy can only be tested after the fact but investors loss nothing from acknowledging his current outlook.
Two calls worth noting for 2009 were S&P 500 rising to 1,200 and gold reaching $1,200 an ounce. S&P 500 closed the year at 1,115.10 and gold hit a high of $1,212.50 an ounce. - Art

Illumina (ILMN) Shines a Light on Profitability

Today, Illumina Inc. (ILMN) was up 15.82% after announcing stronger than expected earnings. According to Yahoo!Quotes, ILMN "...engages in the development, manufacture, and marketing of integrated systems for the analysis of genetic variation and biological function." Apparently it was a total shock to investors and analysts alike that ILMN had the capacity to pull through with strong earnings.

ILMN was last on our Nasdaq 100 Watch List on December 19, 2009. Not long after ILMN hit our list did it catapult 43.69% in 26 days. It is hoped that followers of this website pay close attention to the companies that are on our Dividend Achiever and Nasdaq 100 Watch Lists. Each list has provided exceptional long term and short term opportunities when using fundamental and technical analysis combined. -Touc

Speculative Observation: Electronic Arts Inc. (ERTS) at $16.74

In after hours-trading Electronic Arts (ERTS) fell over 8% on news that the company had lower sales, wider annual loss and had to reduce full year guidance. According to Yahoo!Finance, ERTS "...develops, markets, publishes, and distributes video game software and content."

This is the perfect example of a company that was thought to have it all and possibly be recession proof. After all, 13-34 year old males were going to buy and play video games regardless of the economic environment. ERTS' stock price and company earnings, like much of the "conventional" wisdom the exists about the markets, proved to defy much of the logic.

Personally, I don't track earnings estimates since the concept of earnings is more or less an accounting interpretation that conveniently fits a corporate strategy to show profits or losses as needed. The concept of estimates of future expectations tied to the idea of earnings is a kind of mental gymnastics that I don't have the patience for. However, as part of the New Low Observer team, it is my primary responsibility to track Nasdaq 100 companies that have compelling price action at, or near, a new low.

ERTS last appeared on the New Low Observer on December 11, 2009. At the time, ERTS was within 13% of the new low after falling from the lofty levels of $61 in 2007. After being on our Nasdaq 100 Watch List for only a couple of weeks, ERTS rose 15.82% in 26 days.

ERTS hasn't had luck recovering from it's market doldrums. However, for astute market participants with a penchant for speculation, this stock may provide exceptional opportunities. When ERTS hit the ultimate low of $14.24 ( March 9, 2009) it was in the throes of a market meltdown. In this instance (March 2009 low), we could chalk up the stock price performance primarily to the "adverse" conditions of the market. This means that the price action didn't reflect the truly dire conditions of the company specifically.

Now, as we see the stock getting pummeled in after-hours, we can find comfort in knowing that investors have had the opportunity to better gauge the conditions of the company and are about to price in the worst that is yet to come. One matter that is tremendously bothersome to me regarding the situation at ERTS is that the company is trying to bury the bad news with a flood of press releases. This annoys me to no end and indicates that the company has more to hide than reveal in the latest earnings report.

Although ERTS is in free fall mode, I recommend that potential speculators jump on the best information resources at your disposal (Value Line, Morningstar and Mergent's etc.) and verify whether or not this company truly has a viable business model. My suspicion is that ERTS is an opportunity that is waiting to be capitalized upon after considerable assessment of risk tolerance and due diligence has been done. Be mindful of the prospect that this company could test the long term support level of $10. Only put money that you're willing to lose towards this "special" situation. -Touc

Dow Theory

There are three areas that I would like to cover regarding Dow Theory. First I’d like to discuss the Dow Theory confirmation of the trend. Next, I want to cover the concept of a “line” and it’s potential impact on the Dow Industrials. Finally, I’d like to discuss the Dow theory 50% rule. Additionally, I want to describe what I believe are the future projections for the market going forward.

On January 8, 2010, the Dow Industrials and the Dow Transports confirmed the Dow theory cyclical bull market trend of the stock market. The significance of this is that we can expect the Dow Industrials to head much higher in spite of the threat of future economic uncertainties. Below are the recent charts for the Dow Transports and the Dow Industrials.

Since November 9, 2009, the Dow Industrials have traded in a tight range of less than 3%. According to Dow theory, the market trading in a range of about 5% is considered to be a “line.” A line is a key indication of accumulation or distribution of stocks. It is not known whether or not accumulation or distribution has taken place until the market either breaks above the high range or below the low range of the line.

According to Dow Theory, the formation of a line can act as the equivalent of a market decline or secondary reaction in a bull market if it lasts for over eight weeks. In this instance, the line lasted exactly 8 weeks. I’m hesitant to accept that the “rule” of 8 weeks can be trusted altogether. However, the upward bias of the market has indicated that the most recent breakout will be followed until proven otherwise. It is important to note that secondary reactions act as a release valve from built-up pressure in the market. The fact that the market has responded by breaking above the line that had been drawn indicates that the market has successfully absorbed the large amount of shares that have been distributed by corporations as well as the negative economic news since the March 2009 low.

Because the Dow Industrials and the Dow Transports have both broken to brand new highs at the same time, along with the fact that the Dow Industrials have broken above the line that has been drawn since November 9, 2009, we can safely guess that the market has little desire to go lower and that the bull market is still in place.

Below are the charts of the Dow Industrials and Dow Transports retracements from their respective peaks in 2007. The Dow Industrials have retraced more than 50% of the prior peak while the Transports have retraced more than 60% of the prior peak. This suggests a possible move to retest the high of 14,000 and 5,400. According to Charles Dow, if the market can retrace more than half of the prior move, it (the market) will likely go to the old level that was previously established. One way this was demonstrated was during the decline from October 2007 to March 2009. The decline that took place accelerated significantly once the Dow Industrials exceeded 50% of the rise from September 2002 to October 2007. Likewise, we should be on the lookout for a similar accelerated rise in the market on the way to 14,000.

In an October 15, 2009 article, I charted what I believe to be two scenarios where the market would go. In the first scenario, I suggested that the Dow Industrials would continue on an upward trajectory. Basically, I connected the March 9, 2009 low with the low of July 2009 into the future. In the other scenario, I suggested that the Dow would be able to decline back to the July 2009 low and still be considered a bull market. Additionally, using cycle analysis, I suggested that the market would reach its respective lows between the period of December 2009 and late February 2010.

Since writing the article on October 15, 2009, the Dow Industrials have remained above the upward (red) trendline (see chart below.) I continue to believe that the strongest resistance for the market will be when the Dow Industrials get to 10,700. At this juncture, the Dow Industrials will either break out to the upside in dramatic fashion or retrace back to 9,500. However, given the strong indications from the Dow Industrials and Dow Transports on Friday, I suspect that we can reach 12,000 not long after the month of February 2010.

Considering that this is a cyclical bull market, within the context of a secular bear market, I understand that a reaction of 100% (going back to 14,164 on the Dow Industrials) is not unusual. Additionally, valuations of the market are not at historical lows. Investors should seek out quality companies that are at or near a new low that seem to have viable business models. My preference tends to favor Dividend Achievers or companies that have increased their dividend at least 10 years in a row. -Touc

Nasdaq 100 Watch List

Below are the Nasdaq 100 companies that are within 20% of the 52-week low. This list is strictly for the purpose of researching whether or not the companies have viable business models or are about to go out of business. These companies are deemed highly speculative unless otherwise noted. -Touc
Symbol Name Trade P/E EPS Yield P/B Pct from Yr Low
GILD Gilead Sciences 44.54 17.22 2.59 N/A 7.17 9.65%
CEPH Cephalon, Inc. 63.01 17.42 3.62 N/A 2.21 19.90%
GENZ Genzyme Corp 53.81 30.68 1.75 N/A 1.78 14.27%
APOL Apollo Group 60.50 16.13 3.75 N/A 8.55 14.61%

Dividend Achiever Watch List

At the end of the week, my watch list expanded slightly to 18 companies compared to 17 companies from the previous week. Here are the companies on my watch list as of January 8, 2010.

Symbol Name Price P/E % Yr Low Yield EPS Div/Shr Payout Ratio
SVU SUPERVALU INC 12.87 -0.92 6.10% 2.72% -13.99 0.35 -3%
SHEN Shenandoah Telecom 17.24 27.81 7.08% 1.86% 0.62 0.32 52%
THFF First Financial Corporation 8.78 15.73 8.48% 3.13% 1.83 0.90 49%
SRCE 1st Source Corporation 15.06 13.57 8.82% 4.25% 1.11 0.64 58%
CWT CALIFORNIA WATER SVC 36.47 18.24 8.90% 3.24% 2.00 1.18 59%
XOM EXXON MOBIL CP 69.52 16.21 12.38% 2.42% 4.29 1.68 39%
UGI U G I CP 24.01 10.17 13.58% 3.33% 2.36 0.80 34%
WGL WGL HOLDINGS INC 32.48 13.59 13.61% 4.53% 2.39 1.47 62%
WEYS Weyco Group, Inc. 23.04 23.04 14.57% 2.60% 1.00 0.60 60%
WTR AQUA AMERICA INC 17.67 23.25 14.81% 3.28% 0.76 0.58 76%
WMT WAL MART STORES 53.33 15.46 15.31% 2.04% 3.45 1.09 32%
BCR BARD C R INC 80.51 16.13 16.78% 0.84% 4.99 0.68 14%
UMBF UMB Financial Corporation 39.34 18.73 16.91% 1.88% 2.10 0.74 35%
AWR AMER ST WATER 34.83 21.50 17.04% 2.99% 1.62 1.04 64%
NWN NORTHWEST NAT GAS 44.78 15.49 18.75% 3.71% 2.89 1.66 57%
FDO* FAMILY DOLLAR STORES 30.14 14.56 18.94% 1.79% 2.07 0.54 26%
SYBT S.Y. Bancorp, Inc. 21.87 16.20 19.57% 3.11% 1.35 0.68 50%
HSY THE HERSHEY COMPANY 36.38 21.27 20.19% 3.27% 1.71 1.19 70%
18 Companies


*Although Family Dollar (FDO) is on our list, the stock rose 10% on January 6. Due to the shifting of the 52 weeks, the stock is 20% within the low.

Related Articles
Investment Observation: California Water Service (CWT) at $36.82
Investment Observation: Supervalu (SVU) at $12.81
Research Recommendation: Weyco Group (WEYS) at $22.26

Sell Mattson Technology (MTSN) at the Market

In our previous write up on Mattson Technology (MTSN) on October 22nd, we warned readers that this position was not for the faint of heart. As if to prove our point, MTSN promptly fell from the $2.65 level at the time of the recommendation all the way down to the level of $1.94 on November 4, 2009, a decline of nearly 27% in two weeks.

Now, with the stock trading at $3.32 and with a gain of 24% in 77 days, we think that it is time to relieve ourselves of this highly speculative position. With the understanding that any investment that exceeds a return of 13% within one year is exceptional, we feel that MTSN is getting long in the tooth. Additionally, if viewed from a technical standpoint, MTSN has formed a topping out pattern over the last couple of weeks. -Touc

related article: