Author Archives: NLObserver Team

Market Checkup: Coppock Curve

It's been quite some time since we made an update to the Coppock Curve. The curve or index moved into positive territory in January 2010. Let me remind you that the Coppock Curve is only a buying indicator and tells us nothing about selling. For an indicator to become bullish, the curve has to be in a negative territory and turning upward. I indicated that the bullish indicator came in May 2009 when the index rose from -386 to -380. Table below shows the March low (2009) up until now.

Date Index
Mar-09 -374.4
Apr-09 -386.0
May-09 -380.5
Jun-09 -376.5
Jul-09 -357.8
Aug-09 -319.1
Sep-09 -265.3
Oct-09 -212.7
Nov-09 -147.3
Dec-09 -61.7
Jan-10 25.1
Feb-10 95.0
Mar-10 168.0

The chart below shows that we are clearly in the positive territory. This leave us with one thing, for the curve to turn negative and reverse for a possible buy signal.

If this curve isn't an indication to sell, then why am I writing about this? Because I believe that it is a great tool for long-term investors and they should be aware of this unique indicator. When the index turned  upward in May 09', many small investors, myself included, were still bearish on the market and ignored this technical indicator. Emotions and anger about the bailout clouded our judgment. As a result, many missed the chance to buy the market via ETFs or mutual funds. Even though I was bearish, I stated in that article "This could be the beginning of a greatest investment opportunity if you look in the right place. I suggest you begin accumulating shares but with caution!"

The good news is that some time in the future, this curve will turn negative again. We'll be more excited when that happens. The bad news is, we just don't know when this will happen. Until then, do your research on the Coppock Curve to see if this indicator can be of any benefit to your investment strategy. We will keep an updated chart on the curve and update you when an opportune time arrives.

Click here for more explanation on the Coppock Curve and here for the calculation method. - Art

Quote of the day:

"To know values is to know the meaning of the market. And values, when applied to stocks, are determined in the end by the dividend yield." Charles H. Dow.
Email our team here.

What Impact Will Apple’s iPhone be on AT&T and Verizon Stock? Technically Speaking, Not Much.

The purpose of this article is to point out the lack of impact the Apple (AAPL) iPhone will have on the share price of both AT&T and Verizon. This article makes no attempt to argue the finer points of the financial gains and loses that are made to each company in terms of revenue, profit margins, net income, etc., etc... As Dow Theorists, we believe that the change in the stock price reflects all current and foreseeable information. For this reason, when we invest, we’re primarily concerned with how all the good and bad news about a company is translated into the movement of the stock price. After all, it is the consistency of the dividend and the appreciation of the stock price that we’re seeking.
In the charts below, I have compared the price performance of AT&T (red line) and Verizon (blue line) and determined what, if any, difference in the change of price occurred before and after the introduction of Apple’s iPhone.
By some accounts, we could say that the rise in AT&T’s stock price before the iPhone was due to the anticipation of the iPhone becoming a part of the stable of products that was being offered (buy the rumor, sell the news). However, the rumor mill really started churning in late 2006, at a time when AT&T had already gained a 22% difference in stock price from the October 2005 low for both (T) and (VZ).
Historically, (T) has typically been the stock to rise and fall by a greater magnitude than (VZ). This means that as the decline from October 2007 took place, it was expected that the decline would greater in (T) and smaller in (VZ). Because the stocks have similar movement in price pattern at approximately the same time, you can do a comparison with any major peak or trough to come to the same conclusion (try it here.)
The take away from this piece should be that if you’re nervous about large moves down, then you should start researching (VZ) to see if it is the right investment for you. On the other hand, if you don’t mind wide swings down with greater potential for larger gains, as compared to Verizon, then AT&T might be the better choice. However, in terms of the impact that the iPhone might have on the prospects of either company, there isn’t much of a difference.
Email our team here.

Nasdaq 100 Watch List

Below are the Nasdaq 100 companies that are within 20% of the 52-week low.

Symbol Name Price P/E EPS (ttm) Yield P/B % from Yr Low
GILD Gilead Sciences 45.34 16.1 2.82 0 6.5 9.76%
GENZ Genzyme Corp. 53 34.4 1.54 0 1.8 12.55%
APOL Apollo Group 61.28 14.7 4.16 0 6.7 16.08%
QCOM QUALCOMM 41.83 33.6 1.246 1.60% 3.3 17.96%
FSLR First Solar, Inc. 116.5 15.5 7.53 0 3.6 18.02%
SRCL Stericycle, Inc. 54.5 26.9 2.03 0 5.5 18.58%

This list is strictly for the purpose of researching whether or not the companies have viable business models or are about to go out of business. These companies are deemed highly speculative unless otherwise noted.

Email our team here.

It Isn’t Easy Being Green

One person that I think small investors of today can learn a lot from is Hetty Green. Mrs. Green, born Henrietta Howland Robinson in 1834, increased her investment holdings from $6 million in 1865 to $100 million, in cash, by 1900. And while the average investor doesn’t have six million dollars to start with, the lesson to be learned is far greater than the amount an individual has to invest.

The goal for this “infamous” investor was “to make and keep 6% every year.” How was this accomplished? Hetty Green never aimed for the “big hit” or large gains in the stock market. Instead, she sought reasonable gains which were secured and then rolled over to “real estate mortgages, government and municipal bonds, and other safe, income-oriented investments.” The money was moved out of the safe investments when the stock market was at extreme panic lows.

There are two points about the preceding paragraph that I feel are important. First, seek reasonable gains or “fair” profits. Never set out to beat the stock market. The market will fail to perform at some point, either individually or as a whole, and that is the opportunity to buy the stocks that you want. As you’ll see in the section About This Site, We only seek to exceed the rate of return on “guaranteed” money while all stock purchases are done after the price has reached an extreme on the downside. Seeking “fair” profits implies that an investor considers selling a stock after achieving the goal of exceeding the return of “guaranteed” money rates.

The second point is that without panics or crashes small investors have little chance of succeeding in the stock market, especially through the use of mutual funds and ETFs. Real wealth in stocks is built on understanding values and then seizing those values, en mass, whenever possible. Most great “speculators” have secured their wealth by investing during panics and with the selection of very few companies, typically 3 or 4. With the government constantly trying to smooth out the business cycle, what ends up happening is a concerted effort to keep the wealth of our nation in the same powerful hands with the guise of protecting the average citizen.

Unfortunately, there was a tremendous price for Hetty Green to pay in order achieve such outstanding gains. Mrs. Green was known to avoid spending money at every turn. As an example, when her son was in need of medical attention on his leg, she concocted her own remedy. Her son later had to have his leg amputated due to the lack of proper medical attention.

After getting married to Ned Green, a well known speculator, Hetty's image didn't improve. In fact, Hetty Green was known as the "Witch of Wall Street." With her black dress and hat, miserly ways along with above average financial success didn't endear Hetty to the male dominated confines of Wall Street. However, her 9.50% after-tax returns certainly couldn't be ignored.

Sources:

  • Fisher, Kenneth L. 100 Minds That Made The Market. Business Classics. 1993.
  • Lewis, Arthur H. The Day They Shook the Plum Tree. Harcourt, Brace & World. 1962.
Email our team here.

Dividend Achiever Watch List

At the end of the week, our watch list contains 27 companies. Here is the watch list which ranks Dividend Achievers that are within 20% of the 52-week low for March 26, 2010.

Symbol Name Price % Yr Low P/E EPS Div/Shr Yield Payout Ratio
XOM Exxon Mobil Corp. 66.54 4.69% 16.73 3.98 1.68 2.52% 42%
FPL FPL Group, Inc. 47.81 5.56% 12.04 3.97 2.00 4.18% 50%
MON Monsanto Company 71.10 6.80% 25.58 2.78 1.06 1.49% 38%
TMP Tompkins Financial Corp. 37.75 8.96% 14.03 2.69 1.36 3.60% 51%
BRO Brown & Brown, Inc. 17.81 9.13% 16.49 1.08 0.31 1.74% 29%
CWT California Water Service 36.81 9.91% 18.88 1.95 1.19 3.23% 61%
AWR American States Water 34.07 10.55% 21.03 1.62 1.04 3.05% 64%
WTR Aqua America, Inc. 17.20 11.76% 22.34 0.77 0.58 3.37% 75%
UMBF UMB Financial Corp. 40.69 11.97% 18.50 2.20 0.74 1.82% 34%
MLM Martin Marietta Materials, Inc. 83.37 13.00% 43.65 1.91 1.60 1.92% 84%
T AT&T Inc. 26.24 13.15% 12.39 2.12 1.68 6.40% 79%
WEYS Weyco Group, Inc. 23.60 13.35% 21.26 1.11 0.60 2.54% 54%
SYBT S.Y. Bancorp, Inc. 22.65 14.39% 16.29 1.39 0.68 3.00% 49%
SFNC Simmons First National Corp. 27.36 14.48% 15.72 1.74 0.76 2.78% 44%
LLY Eli Lilly and Co. 35.42 14.59% 8.99 3.94 1.96 5.53% 50%
LKFN Lakeland Financial Corp. 18.80 14.98% 14.92 1.26 0.62 3.30% 49%
FFIN First Financial Bankshares 51.99 16.05% 20.15 2.58 1.36 2.62% 53%
SHEN Shenandoah Telecom. 18.72 16.27% 29.25 0.64 0.32 1.71% 50%
THFF First Financial Corp. 29.55 16.66% 17.08 1.73 0.90 3.05% 52%
NWN Northwest Natural Gas 46.42 17.28% 16.40 2.83 1.66 3.58% 59%
MGEE MGE Energy Inc. 34.51 17.30% 15.62 2.21 1.47 4.26% 67%
PGN Progress Energy Inc. 39.31 17.34% 14.51 2.71 2.48 6.31% 92%
UGI UGI Corp. 26.08 17.96% 11.80 2.21 0.80 3.07% 36%
NTRS Northern Trust Corp. 55.35 18.47% 17.52 3.16 1.12 2.02% 35%
OTTR Otter Tail Corp. 22.12 18.73% 31.15 0.71 1.19 5.38% 168%
PBI Pitney Bowes Inc. 24.28 19.14% 11.90 2.04 1.46 6.01% 72%
WGL WGL Holdings Inc. 34.50 20.67% 15.33 2.25 1.51 4.38% 67%
27 Companies

Watch List Summary 

The best performing stock from last week's list, is Simmons First National (SFNC) which rose 1.2%. The worst performing stock is Martin Marietta Materials (MLM) which fell 4.6%. Overall, the Dividend Achiever watch list lost 1.2% versus the Dow gained of 1%.
Our team added two companies to our portfolio this week. AT&T (T) and Monsanto (MON) have ex-dividend dates approaching and we feel comfortable enough owning them at this level. In addition to those two, we currently have long position in Exxon (XOM) and California Water (CWT). - Art

Email our team here.

Upcoming Ex-Dividend Dates for Watch List Companies

Below are the approximate ex-dividend dates for companies that appeared on our Dividend Achiever and Nasdaq 100 Watch Lists for the prior week. If you happen to be researching these companies for potential investment, it would be advisable to consider the ex-dividend date prior to possible purchases. Owning the shares of the company that you're interested in before the ex-dividend date entitles you to the upcoming dividend payment. Owning the shares on or after the ex-dividend date means that you would have to wait at least three months before receipt of the next dividend payment.
Please verify the ex-dividend date and payout ratio before committing funds to these stocks. Additionally, do not base your next long or short-term purchase on the dividend payment or yield. Instead, get as much research in as you possibly can before the ex-dividend date "just in case" you're actually interested in buying the stock. 

Of particular note on the list, with an upcoming ex-dividend date, is AT&T (T) with a dividend yield of 6.30% and 13.67% from the 52-week low.  It pains me to say it but the one quarterly dividend payment from AT&T beats most savings and money market accounts.  With (T) selling at 1995 prices and with solid earnings and dividends, this becomes an obvious choice for investment research.  The only consideration is that you've got to accept that (T) might trade in a range for a long while.  AT&T is going ex-dividend in the first week of April.

Name Symbol Pct from Yr Low Ex-Dividend Date
Comcast Corporation CMCSA 41.26% 4/4/2010
Monsanto Company MON 7.44% 4/6/2010
AT&T Inc. T 13.67% 4/6/2010
WGL Holdings Inc WGL 20.60% 4/6/2010
Progress Energy Inc PGN 17.64% 4/7/2010
Lakeland Financial LKFN 16.15% 4/21/2010
Nor'west Natural  NWN 17.94% 4/27/2010
Paychex, Inc. PAYX 32.08% 4/28/2010
Brown & Brown, Inc. BRO 9.93% 5/1/2010
Intel Corporation INTC 54.97% 5/3/2010
Tompkins Financial TMP 9.68% 5/3/2010
California Water Service CWT 9.47% 5/4/2010
Xilinx, Inc. XLNX 41.08% 5/8/2010
Exxon Mobil Corporation XOM 4.92% 5/8/2010
Linear Technology LLTC 38.45% 5/10/2010
American States Water AWR 10.74% 5/10/2010
Eli Lilly and Company LLY 15.85% 5/10/2010
Otter Tail Corporation OTTR 19.43% 5/10/2010
KLA-Tencor Corporation KLAC 59.69% 5/11/2010
Aqua America, Inc. WTR 11.50% 5/11/2010
Microchip Technology MCHP 45.67% 5/16/2010
Maxim Integrated Pro. MXIM 50.81% 5/17/2010
Pitney Bowes Inc. PBI 19.82% 5/17/2010
Activision Blizzard, Inc ATVI 21.83% 5/18/2010
Applied Materials, Inc. AMAT 29.10% 5/22/2010
FPL Group, Inc. FPL 5.70% 5/24/2010
QUALCOMM QCOM 19.04% 5/24/2010
Weyco Group, Inc. WEYS 12.87% 5/25/2010
Martin Marietta Materials MLM 13.89% 5/25/2010
MGE Energy Inc. MGEE 17.78% 5/25/2010
Northern Trust NTRS 19.18% 6/8/2010
UMB Financial UMBF 13.70% 6/9/2010
ADP ADP 33.07% 6/10/2010
Pharmaceutical Product PPDI 27.10% 6/11/2010
Simmons First National SFNC 12.47% 6/11/2010
S.Y. Bancorp, Inc. SYBT 12.68% 6/11/2010
UGI Corporation UGI 17.59% 6/11/2010
Email our team here.

Qualcomm (QCOM) Boosts Forecast

Qualcomm (QCOM) rose as high as 8% today after boosting their forecast. The strangest thing is that it wasn't long ago (1/27/10) that they reaffirmed guidance that was below the street expectation which tanked the stock by 14% on the following day. Then on 2/26/10, our team point to the obvious fact that QCOM and MON should be on your radar after appearing on our daily watch list. Five days after (3/1/10), the company announced a dividend increase of 12% plus a $3 billion stock repurchase program. The stock was at $36.
We reiterated QCOM in the Research Request section of the site. Although the stock is still within 20% of the 52-week low, we'd rather not chase it at this point.

Email our team here.

Dow Theory

On October 16, 2009, I wrote an article on SeekingAlpha.com titled “Stock Market Projections,” where I attempted to predict the next low point for the Dow Industrials. In that article I said:
After I ran the numbers, the cycle analysis method indicates that from January 24, 2010 to February 15, 2010 is the next expected low.”
Eerily, the Dow Jones Industrial Average has managed to hit a major low on February 8, 2010. This is almost exactly in the middle of the range where, based on cycle analysis, the Industrials were expected to go. At the time it was my assertion that after hitting the low in February 2010 we could expect that the next move upwards would be to the 12,000 level.
The case for the move upward has been bolstered by the fact that, according to Dow Theory, the Industrials and the Transports have exceeded their January 2010 highs based on the closing price of March 18, 2010. However, as the Industrials have exceeded their March 18th closing price the Transports have not followed through so far.  This type of divergence between the two indexes is generally considered to be a non-confirmation.
The great Dow Theorist Richard Russell (Dow Theory Letters) has spoken at length about non-confirmations in the indexes and how to interpret the trend of the market in this context. According to Russell:
"It is a reasonable practice in areas of non-confirmation or divergence to give precedence to the primary direction. Thus, after a rally in a bear market, when one Average refuses to confirm the other on the upside, the strong presumption is that the next direction of the market will be down. More positive proof is provided if the two Averages then retreat below previous minor decline lows. The converse of this is true in a bull market, and many impressive advances have been “tipped-off” in areas where one Average refused to follow (confirm) the other through an important low point."
Richard Russell, Dow Theory Letters, Issue 102, May 2, 1960, page 2. www.dowtheoryletters.com
We would not be totally satisfied with the bull market indication (within a secular bear market) until the Transportation Index is able to go above 4422.50. However, until that time, we would consider this a bull market that is waiting for a confirmation rather than a potential bear market in the making. While we’re still sticking to a projected Dow Industrials of 12,000, the market has seemed to run out of the explosive bursts on the upside that it once had. Despite this concern, we wouldn’t be surprised of the market truly melted up from the current level.
  • The article on Seeking Alpha titled “Stock Market Projections” is here.
  • For better viewing, the chart in the article is here

Email our team here.

Research Request: Applied Materials (AMAT)

A research request is a response to our reader's question regarding Applied Materials: "Do you like AMAT? They just raised their dividend and seem close to an average low." Our team wrote a brief response with the article titled "Applied Material and the Chip Sector Should Be on Your Radar" but we'd like to take that analysis a little bit further.
This isn't the first time we've mentioned a company within the chip sector. Our original Speculative Observation on Mattson (MTSN) yielded more than 50% in less than 6 months. Since that write up, MTSN returned 65% while AMAT went nowhere and returned less than 1%.
In pursuit of "seeking fair profits" and being a rather conservative bunch, we had to issue a Sell Recommendation on MTSN at $3.32 on January 6, 2010. Part of our strategy is to constantly search for alternative investment opportunity with a lower risk profile and higher reward potential. With that in mind, you can see that MTSN has outperformed AMAT and the overall market by a wide margin, thus it is fair to say that risk/reward profile is now more favorable for AMAT than MTSN. So let's take a deeper look at AMAT.
Applied Materials (AMAT) is the largest supplier of semiconductor, flat panel display (LCD), and solar equipment according to VLSI Research. The company leveraged their knowledge in LCD market into the solar market in late 2008. There are many growth drivers for this company and the sector. On the chip side, you have China continuing to consume more and more electronics pushing demand for greater chips. LCD driver is coming from conversion from CRT TV to LCD. Solar may get a boost from Obama push for "greener" economy. Though sound bullish in arguments, these factors may already be in the price so we must look at the  fundamental.
As of this writing, AMAT is trading roughly around $13.25. This is up considerably (100%+) from AMAT's December 2008 low of $6.24. The company began distributing cash dividends back in 2005 for the amount of $0.09. The current 2010 dividend payout is $0.28 which amounts to a 25% annual increase in dividend. It is expected the that growth rate of the dividend can't be sustain forever but we've taken this is as a positive sign of management's commitment to the shareholders. We at New Low Observer thinks true profits are obtained when a company shows cash rather than paper profits. The current yield of AMAT sits a little above 2% and is quite high on a historical basis. Average yield should be at 1.5%. Take that average yield and you arrive at a share price of $17.35. My proprietary model, which takes into consideration cash flow, earnings, book value, and yield, shows the following price targets:
  • Dirt cheap - $6.75 (we saw AMAT at $6.24 and rocketed up)
  • Buy - $13.26 (we are in that range)
  • Fair - $17.35
  • Over Value - $26.18
*my model changes over time so don't take these prices as static.
For technical analysis on AMAT, please refer back to the article "Applied Material and the Chip Sector Should Be on Your Radar".
So what would we do?
First, we look for other alternatives and stick to our rule of buying low (within 20% of the 52 week low). Because AMAT is 28% above the low, we will not chase it. Alternative investments may be in names like Qualcomm (QCOM) which is 15% above the low. If and when the price retraces on the downside, we'll re-evaluate the situation and may be compelled to buy more.
For anyone who believes that this is an opportunity that can't be missed, I recommend allocating 15% of your portfolio into this name. On top of that, do a two part purchase. First buy 7.5% now and if the shares fall another 20% buy the remaining 7.5% later. This way, the cost basis of the stock would require only a 10% rise to break even.  Again, it is not likely that we'll buy AMAT since the alternatives provide exceptional opportunity with less downside risk.
For Research Request of companies on our most recent Watch Lists (only Dividend Achiever or Nasdaq 100), email our team here.  We'll post only one research request each week.

Chipmaker Intersil Pays Cash for Semi maker Techwell

No sooner than we published our Nasdaq 100 Watch List on Saturday March 20th outlining a preliminary case for chip manufactures than integrated circuit manufacturer Intersil Corporation (ISIL) announces today that it will pay cash for semiconductor manufacturer Techwell (TWLL).  Although it was luck that our suggestion to examine the chip sector came just before the acquisition of Techwell (TWLL), the fact that the purchase was done with cash is a testament to the fact that the chip manufacturers have abundant cash or are under priced and undervalued.  Techwell (TWLL) rose 47.75% during regular trading hours as Intersil (ISIL) will pay a premium of 48.71%. 
For all intents and purposes, the chip sector lite up like a Christmas tree on the announcement of the acquisition of Techwell (TWLL) today.  Our previous Speculative Recommendation of Mattson Technology (MTSN), another wafer equipment manufacturer, is now about to breach the old high of $4.22 if the industry continues to heat up with activity.
We have said it many times before and will continue to iterate the point that when a whole sector or industry starts to appear at or near a new low then it typically indicates that the companies within that industry are undervalued.  It only takes a cursory look to verify if this assumption is correct.  Once it can be verified that companies in a specific industry are undervalued, you can rest assured that the mergers and acquisitions will begin. The fact that cash is being used to buy up companies is the final nail in the coffin on the theory of an undervalued sector.
Since we started the New Low Observer, we have been able to identify the water sector, the biotech/pharma sector and the medical device sector as undervalued before acquisitions or substantial price gains occurred.  It should be noted that we don't have any special skills,  just the willingness to carefully observe and sometimes buy companies that have fallen to a new low.  Get the research going for the companies that are part of the chip sector, and never chase a stock that has a rising price.
-Touc
Email our team here.

Applied Materials and the Chip Sector Should Be on Your Radar

Based on our most recent Nasdaq 100 Watch List, the following question was asked regarding Applied Materials (AMAT): "Do you like AMAT? They just raised their dividend and seem close to an average low."  Based on this question, We took a closer look at the chip related companies on our watch list and noticed that all of the companies started aggressive dividend increasing policies starting around 2002.  This alone is a compelling reason to investigate these companies.
In our cursory review of data on Applied Material (AMAT) from Morningstar.com, we found that Applied Material (AMAT) is selling below the average Price-to-Book ratio over the last 10 years by 14%. Over same period of time, AMAT is selling 22% below the price-to-sales ratio. Finally, AMAT is selling 44% below the price-to-cash flow ratio.
All of these factors indicated that the stock should return to the mean at some point in the future. A glaring negative is the fact that there hasn't been the earnings to justify the stock price and dividend. Dow Theory also indicates that from the peak of $22 to the low of $7.80, AMAT is fairly valued at $14.90. So far the decline in the price from the $15 dollar level has confirmed the Dow Theory view.
However, the last time that AMAT had negative earnings was in 2003. The low in 2003 at $11.50 took the stock to the high of $25 in the same year.   Additionally, AMAT didn't fall below $15 until the market decline in 2008, which seems natural given the state of the economy during that period of time (it might not be over yet.) This means that in any given year from 2003 to 2008, AMAT would have returned as much as 46% if based on the average low price of $15 and the average high price of $22. 
An important point to consider about the technical pattern of AMAT is the double bottom that was achieved in late 2002 to early 2003.  If AMAT were to replicate the same rally on a relative basis then AMAT could rise as high as $18.43, an increase of 43% from the current level.  Already, investors are being compensated for 2% of the downside risk through the dividend if the stock were held for a year.  As long as investors are willing to stomach the potential of going to the old low of $7.80 in November 2008 then there may be opportunity for this stock.
Our opinion is that the chip sector is ripe for mergers and acquisitions. In terms of AMAT, there are few downside risks if you're willing to accept the volatility and the losses that go along with such an investment. The aggressive dividend policy may pay off in the case of AMAT.  However, for the time being, we would review the other chip-related companies with a dividend that has earnings before diving into AMAT.

Because this was a cursory review of AMAT in response to a question, we recommend that you verify all data before taking a position either long or short.  We are considering a full review of the chip sector to be posted on this site in the future. 

-Touc

Nasdaq 100 Watch List

Below are the Nasdaq 100 companies that are within 20% of the 52-week low.

Symbol Name Price P/E EPS Yield P/B % from Low
QCOM QUALCOMM 40.05 32.14 1.25 1.70% 3.17
12.94%
FSLR First Solar, Inc. 113.3 15.05 7.53 N/A 3.65
14.78%
GILD Gilead Sciences, Inc. 47.87 16.96 2.82 N/A 6.7
15.88%
ERTS Electronic Arts Inc. 18.42 N/A -2.31 N/A 2.33
17.32%
ATVI Activision Blizzard, Inc 11.82 139.06 0.09 1.30% 1.39
20.00%
This list is strictly for the purpose of researching whether or not the companies have viable business models or are about to go out of business. These companies are deemed highly speculative unless otherwise noted.

Nasdaq 100 Watch List Summary

This week, the top performing stock from last week's watch list was Genzyme Corp. (GENZ) which was up 4.36%.  The worst performing Nasdaq 100 stock from last week was First Solar (FSLR) which fell -1.93%.

Below is the list of the highest yielding stocks that are components of the Nasdaq 100.  This isn't an endorsement of the companies on the list.  However, it is noted that the majority of the companies that pay a dividend are related to the chip sector.  Clustering of companies in a specific industry may indicate that the entire sector is undervalued.  If the companies have high dividend yields on a relative basis (compared to their historical high yields), then these companies may be worth considering despite the fact that they are not within 20% of the new low.    Linear Technology (LLTC), ADP (ADP), and Paychex (PAYX) are Dividend Achievers as well as members of the Nasdaq 100 index. 

Before pursuing any of these companies, be sure to verify the dividend history as well as the earnings capacity to pay the dividend (more commonly known as payout ratio).


Symbol Company Price P/E EPS Yield P/B % from low
MCHP Microchip Technology 28.25 31.6 0.89 4.80% 3.53 43.69%
MXIM Maxim Integrated Prod. 19.14 71.69 0.27 4.20% 2.31 48.49%
PAYX Paychex, Inc. 32.17 23.52 1.37 3.90% 8.43 39.87%
LLTC Linear Technology 28.36 24.22 1.17 3.20% N/A 39.98%
ADP ADP 44.6 16.57 2.69 3.00% 3.91 34.10%
INTC Intel Corporation 21.99 28.41 0.77 2.90% 2.94 53.26%
PPDI Pharma Prod. Dev. 22.71 16.94 1.34 2.60% 1.98 26.38%
XLNX Xilinx, Inc. 26.6 24.43 1.09 2.40% 3.68 46.48%
AMAT Applied Materials, Inc. 12.49 N/A -0.07 2.20% 2.37 23.91%
CMCSA Comcast Corp. 17.53 13.9 1.26 2.20% 1.17 40.35%
KLAC KLA-Tencor Corp. 28.79 N/A -0.39 2.10% 2.25 49.25%
Email our team here.

Dividend Achiever Watch List

At the end of the week, our watch list contains 25 companies. Here is the watch list which ranks Dividend Achievers that are within 20% of the 52-week low for March 19, 2010.

Symbol Name Price % Yr Low P/E EPS Div/Shr Yield Payout Ratio
XOM Exxon Mobil Corp 67.04 5.48% 16.84 3.98 1.68 2.51% 42%
FPL FPL Group, Inc. 48.16 6.34% 12.13 3.97 2.00 4.15% 50%
MON Monsanto Company 72.20 8.46% 25.97 2.78 1.06 1.47% 38%
BRO Brown & Brown, Inc. 17.98 10.17% 16.13 1.12 0.31 1.72% 28%
CWT California Water Service 37.07 10.69% 19.01 1.95 1.19 3.21% 61%
TMP Tompkins Financial Corp. 38.37 10.75% 14.26 2.69 1.36 3.54% 51%
AWR American States Water 34.17 10.87% 21.09 1.62 1.04 3.04% 64%
T AT&T Inc. 26.24 13.15% 12.38 2.12 1.68 6.40% 79%
UMBF UMB Financial Corp. 41.18 13.32% 18.72 2.20 0.74 1.80% 34%
WEYS Weyco Group, Inc. 23.62 13.45% 21.28 1.11 0.60 2.54% 54%
LKFN Lakeland Financial Corp. 18.62 13.88% 14.78 1.26 0.62 3.33% 49%
WTR Aqua America, Inc. 17.53 13.91% 22.86 0.77 0.58 3.31% 76%
LLY Eli Lilly and Company 36.17 17.02% 9.18 3.94 1.96 5.42% 50%
OTTR Otter Tail Corp. 21.92 17.66% 30.87 0.71 1.19 5.43% 168%
SFNC Simmons First National Corp. 27.04 17.82% 15.54 1.74 0.76 2.81% 44%
SYBT S.Y. Bancorp, Inc. 23.34 17.88% 16.79 1.39 0.68 2.91% 49%
THFF First Financial Corp. 29.87 17.92% 17.27 1.73 0.90 3.01% 52%
NWN Northwest Natural Gas 46.79 18.22% 16.19 2.89 1.66 3.55% 57%
MLM Martin Marietta Materials, Inc. 87.41 18.49% 45.76 1.91 1.60 1.83% 84%
NTRS Northern Trust Corp. 55.45 18.69% 17.55 3.16 1.12 2.02% 35%
PGN Progress Energy Inc. 39.84 18.93% 14.49 2.75 2.48 6.22% 90%
UGI UGI Corp. 26.52 19.95% 12.01 2.21 0.80 3.02% 36%
PBI Pitney Bowes Inc. 24.52 20.31% 12.01 2.04 1.46 5.95% 71%
MGEE MGE Energy Inc. 35.40 20.33% 16.02 2.21 1.47 4.15% 67%
WGL WGL Holdings Inc. 34.44 20.46% 15.31 2.25 1.51 4.38% 67%
25 Companies


Watch List Summary 

The best performing stock from last week's list, once again, is 1st Source Corp. (SRCE) which rose 8.4% this week and 20% in three weeks. The stock is now 30% above the 52-week low and off our list. The worst performing stock is Weyco Group (WEYS) which fell 1.4%. Overall, the Dividend Achiever watch list gained +2.7% versus the Dow's +1.11% and the S&P 500's  +0.98%.

Several new companies are appearing on our list for the first time due to the dramatic increase in the share price from the March 9, 2009 low. Names such as Eli Lilly (LLY), Otter Tail (OTTR), and Simmons First National (SFNC) have joined the list of companies that are within 20% of the 52-week low.

Exxon (XOM) remains a great bargain in our view. Exxon has been within the 10% range for 9 consecutive weeks. Monsanto's (MON) technical pattern remains intact for another week. The upside down head-and-shoulder is holding the stock above the $71 level. The team at New Low Observer have long positions in XOM and MON. - Art

Sell Electronic Arts (ERTS) at the Market

It is now time to recommend that Electronic Arts (ERTS) be sold at the market. The stock has performed moderately since the Speculative Observation was issued on January 11, 2010 as it now trades at $18.51.  Since our Speculative Observation, ERTS has increased 10.69%. In the pursuit of "seeking fair profits" the returns that Electronic Arts (ERTS) has provided within the last 67 days say that it is necessary to consider alternative opportunities. The key to investment success and a key principle of economics is to seek the best alternatives.

From a technical standpoint, Electronic Arts (ERTS) appears to be trying to go above the $18.66 resistance level.  If the stock can break above $18.66 and remain at that level, the stock should make an assault on the $21 price range.  However, with an annualized return on this position of nearly 58%, we are content taking 10% and letting everyone else enjoy the remaining upside prospects.
As we have indicated in the purposes and function of this site, our goal is to:
  • maximize the annual yield of each trade.
  • reduce time between buying and selling of each stock.
  • exceed the annual yield of government guaranteed alternatives in each trade.
Investment and Speculative Observations are intended to be a starting point for investigating a quality company at a reasonable price. It is hoped that after doing the background research you can buy the stock at a lower price. Ideally the stock should be held in a tax deferred account and should not consist of less than 20% of your holdings. Personally, we prefer holding only 2-3 stocks at a time.
Sell recommendations are intended to deal with the short term reality of the market. The tracking of the Sell recommendations are the worst case scenario if you happen to have bought a stock at the time the Speculative Observation was made (please avoid making this mistake.) We aim for mediocrity in our returns, therefore we are happy with 9-12% annual gains. However, since codifying this approach to investing in 2005, we have had annual returns of 20% and above every year since.
It is always recommended that when selling a stock, one should not place stop orders, limit orders or orders after hours. This leaves the seller in the position of being vulnerable to the whims of the market makers. Instead, place your sell orders only as a market order during market hours. Some would complain that a market order during market hours might leave some profits on the table. However, we would rather leave some money on the table rather than have it taken away from us by the trades that are placed by institutions and market makers.
-Touc

Gaining More by Limiting Our Gains

One of the biggest challenges to buying and holding a stock for the long term is the wait through thick and thin for the expectations of a particular stock to materialize. In a process of elimination, the New Low Observer team has narrowed down the steps to determining quality stocks by relegating it to those that have increased their dividend every year for at least 10 years in a row. Furthermore, we only seek out those high quality dividend paying stocks, as well as Nasdaq 100 index constituents, when the companies are within 20% of the 1-year low. Having these requirements allows us to select quality companies at (potentially) ideal times to invest.
However, once we have decided on the company that we're interested in investing and we've committed money to, we are still at the whims of "Mr. Market." Although it might seem surprising to some, we are incredibly risk averse and always try to avoid losses whenever we can. We are so risk averse that we have a general rule that if the investment in a particular stock exceeds the gains of the market over the last 100, 50, 25, or 10 years on an annual basis (after expenses) then we tend to sell that stock to seek alternative investment opportunities. If nothing else, we secure the exceptional gains and bide our time until the next "undervalued" opportunity arrives.While the buy-and-hold crowd cries foul at the thought that we're speculating rather than investing when buying and selling high quality stocks at arguably undervalued prices, we have noticed a pattern that keeps emerging from our strategy that sets apart our approach from merely speculating. One of the best recent examples of the value in our investment philosophy is the case of Meridian Biosciences (VIVO).
On March 17, 2010, as the Dow Industrials and Dow Transportation Average were confirming the Dow Theory trend to the upside, Meridian Biosciences (VIVO) was dropping like a rock on news that the future earnings would have to be revised lower. In one fell swoop, Meridian Biosciences (VIVO) erased 9 months of hard earned gains in the stock price. I say 9 months because after our recommendation to sell VIVO, the stock increased in value an additional 27% in 3 months at the peak in September 2009.
At the time of our sell recommendation, Meridian Biosciences had risen 11.75% from our Research Recommendation on March 26, 2009. We were content in our gains and smug at being so smart at selling while the going was good. However, we watched, in almost horror, as the stock continued to climb higher going from our sell point of $20.35 all the way up to $26. We began to wonder if selling a company that we were convinced was of the highest quality was the best choice. After all, Meridian Biosciences (VIVO) is one of the only Dividend Achievers to match the gains of Google (GOOG) on a percentage basis from the date of Google's (GOOG) IPO to the peak in late 2007/early 2008.
With a tinge of regret we moved on hoping that our next investment would make up for our blunder of selling VIVO at such a cheap price. In the nine months since our sell recommendation of Meridian Biosciences (VIVO) we've made eight Investment Observations that were followed by Sell Recommendations. Below are the stocks we mentioned and the percentage gains that were secured since our sell recommendation of VIVO on June 12, 2009:
  • Cardinal Health (CAH) +23%
  • Abbott Labs (ABT) +16.80%
  • SuperValu (SVU) +11.87%
  • Nor'wst Nat (NWN) +10.53%
  • AquaAmer. (WTR) +10%
  • Cephalon (CEPH) +13.41%
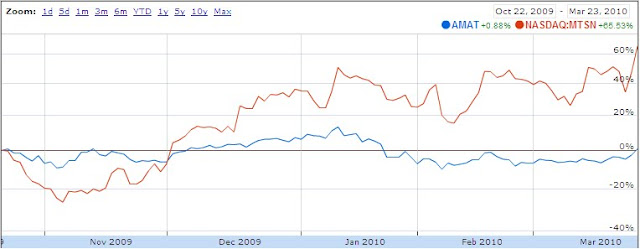
  • Mattson (MTSN) +24%
  • Monsanto (MON) +22%
With the reduction of earnings estimates and the subsequent collapse of Meridian Biosciences (VIVO), the stock has fallen below the level of the original sell recommendation that was given on June 12, 2009. In addition, we've highlighted eight companies that have provided double digit returns in a complete buy and sell cycle all within a nine month period. The chart below illustrates the recommendation dates in green and the sell dates in red with the post-collapse price in yellow.
Today the New Low Observer team breathes a sigh of relief, not in the lose that has afflicted current Meridian Biosciences shareholders but based on the fact that we stayed the course with our investment philosophy which provided gains that, to this point, have gone beyond our expectations by actually limiting how much we are willing to accept on the upside.The lesson that should be learned about Meridian Biosciences is that although the price is nearly the same as a year ago doesn't mean that there was no movement or activity. In fact, the stock went up as much as 44% in 5 months. This is the hard lesson that most buy-and-hold investors should have learned about where the major indexes have gone over the last 10 years. Within all the drama that occured since 2000, many opportunies presented themselves but may have never been realized if holding for the long-term was the only investment strategy. For most investors, the real challenge becomes whether or not to sell a stock after exceptional gains.
Our Current Take on Meridian Biosciences
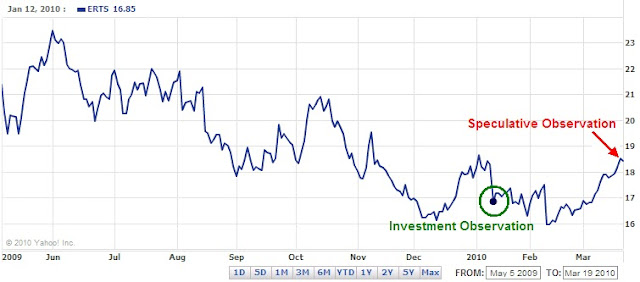
In our sell recommendation of Meridian Biosciences at the $20.35 level, we said that VIVO would easily go to the $23.33. Since the peak in the price at $26.20 in September 2009 and the recent decline to $19.60, Dow Theory indicates that for this stock, the upside move should take the price at least to the $23 level before going back to the old high of $26.20 or back down to the $19 range. Our expectation that a reaction of 11% to 13% upside move would not be unusual.For those who are interested in justifications of Meridian Biosciences (VIVO) as an investment candidate (since the negative news is already out), there are several compelling factors to watch for.
First and foremost is the recent confirmation of the bullish move of the stock market according to Dow’s Theory. This gives the investor that chance to make mistakes without paying a hefty price. More specific to Meridian Biosciences (VIVO) is the fact that the company is selling 16% below the 8-year average price-to-earnings ratio according to Morningstar.com. VIVO is also selling 3% below the average price-to-cash flow ratio over the last 10 years. Bolstering the case for VIVO is the fact that the company carries little or no debt. We will be watching Meridian Biosciences (VIVO) closely for any indication that the stock will decline from the current level. Our hope, as it always is, is to buy the stock at a much lower price and take reasonable gains in the shortest period of time possible. It is our hope that others can see the value of our approach of taking gains that exceed the historical average annual return and seeking alternative investment opportunities whether it is in cash or another quality stock that is at or near a new low.
  • Don't know the historical average annual gains for 100, 50 or 10 years. Go to Moneychimp.com's CAGR of the Stock Market Calculator. Pick just about any time frame and see what you've been missing (even on an inflation adjusted basis).
  • Want more info about the strategy mentioned above, then go to our article title "When Timing Meets Opportunity" on SeekingAlpha.com. The article was posted in July of 2009 and has more relevancy than ever before.
  • Our article titled "Seeking Fair Profits" outlines Charles H. Dow's philosophy of fair expectations when investing in the stock market. Charles Dow was the co-founder of the Wall Street Journal and the Dow Jones Indexes.
Tell a friend about us. Thank you.