Author Archives: NLObserver Team

Nasdaq 100 Watch List

Below are the Nasdaq 100 companies that are within 21% of the 52-week low.

Symbol Name Price P/E EPS Yield P/B % from Low
GILD Gilead Sciences 41.67 14.77 2.82 0 5.74 4.44%
QCOM QUALCOMM 38.25 30.7 1.25 1.90% 3.08 7.87%
GENZ Genzyme Corporation 53.93 35 1.54 0 1.85 14.53%
ATVI Activision Blizzard 11.6 136.47 0.09 1.30% 1.35 16.82%
RYAAY Ryanair Holdings 29.19 N/A - 0 0 17.61%
APOL Apollo Group, Inc. 63.53 15.89 4 0 7.34 20.34%

This list is strictly for the purpose of researching whether or not the companies have viable business models or are about to go out of business. These companies are deemed highly speculative unless otherwise noted.

Email our team here.

Dividend Achiever Watch List

At the end of the week, our watch list contains 21 companies. Here is the watch list which ranks current and former Dividend Achievers that are within 20% of the 52-week low for April 23, 2010. Instead, they are the starting point for doing your research and determining the best company to buy.  Ideally, a stock that is purchased from this list is done after a considerable decline in the price and extensive due diligence.

Symbol Name Price % Yr Low P/E EPS Div/Shr Yield Payout Ratio
MON Monsanto Co. 65.66 3.00% 27.36 2.40 1.06 1.61% 44%
XOM Exxon Mobil Corp. 69.24 8.94% 17.40 3.98 1.68 2.43% 42%
LLY Eli Lilly and Co. 35.46 10.71% 9.00 3.94 1.96 5.53% 50%
SHEN Shenandoah Telecom 18.00 11.80% 28.13 0.64 0.32 1.78% 50%
T AT&T Inc. 26.25 13.20% 12.38 2.12 1.68 6.40% 79%
FPL FPL Group, Inc. 51.30 13.27% 12.92 3.97 2.00 3.90% 50%
FRS Frisch's Restaurants, Inc. 22.70 14.01% 11.46 1.98 0.52 2.29% 26%
DNB Dun & Bradstreet Corp. 78.82 14.07% 13.14 6.00 1.40 1.78% 23%
WMT Wal-Mart Stores, Inc. 54.53 15.16% 14.74 3.70 1.21 2.22% 33%
CWT California Water Service 38.90 16.15% 19.95 1.95 1.19 3.06% 61%
TMP Tompkins Financial Corp. 40.44 16.73% 13.66 2.96 1.36 3.36% 46%
UHT Universal Health Realty 34.25 17.74% 21.96 1.56 2.40 7.01% 154%
FFIN First Financial Bankshares 54.82 17.99% 21.25 2.58 1.36 2.48% 53%
PGN Progress Energy Inc. 39.59 18.18% 14.61 2.71 2.48 6.26% 92%
THFF First Financial Corp. 30.14 18.99% 17.42 1.73 0.90 2.99% 52%
HCC HCC Insurance Holdings 27.43 19.16% 8.82 3.11 0.54 1.97% 17%
WEYS Weyco Group, Inc. 24.94 19.79% 22.47 1.11 0.60 2.41% 54%
FII Federated Investors, Inc. 25.90 19.91% 13.49 1.92 0.96 3.71% 50%
WTR Aqua America, Inc. 18.47 20.01% 23.99 0.77 0.58 3.14% 75%
SFNC Simmons First National 28.74 20.25% 17.52 1.64 0.76 2.64% 46%
NTRS Northern Trust Corp. 56.31 20.53% 17.82 3.16 1.12 1.99% 35%
21 Companies


Watch List Summary

The best performing stock from last week's list was Brown & Brown (BRO) which rose 7.7%. The worst performing stock was Eli Lilly (LLY) which fell 3%. Overall, the Dividend Achiever watch list gained 2.8% versus the Dow which was up 1.7%.
I revisited our watch list again from three months ago (January 22, 2010) to see what result these companies produced. The average gain for the list was 11.5% compared to the Dow's gain of 7.8%. The three biggest gainers were Republic Bancorp (RBCAA), Family Dollar (FDO), and Hershey (HSY). All rose more than 30%. The worse and only non-performer was Monsanto (MON) which fell 15% and remains on our list.

The key to this list isn't to provide a winner but collectively, we hope that it can be a starting point for you to research these companies and hopefully provide lower volatility, margin of safety and  provide marginally higher return than the general market.

Related Links:

Email our team here.

Sell Weyco Group (WEYS) at the Market

It is now time to recommend that Weyco Group (WEYS) be sold at the market. The stock has performed moderately since the investment observation was issued on July 6, 2009. Based on the Research Recommendation that was given, the price we quoted was within 7% of the lowest closing price for the last 4 years. Although Weyco Group (WEYS) seemed to have traded in a range in the last year, the stock has continuously climbed higher since our recommendation.

Although the price of WEYS has drifted higher, the pursuit of "seeking fair profits" requires that we consider alternative opportunities. The key to investment success and a key principle of economics is to seek the best alternatives.
WEYS was recommended when it was trading at $22.26. As of April 22, 2010, WEYS was quoted at $24.89. Based on the closing price of $24.89, WEYS has gained a total return (price appreciation plus 3 dividend payments) of 14.02%. The annualized return on this position would be 17.58%. Selling this stock now generates a return of 5.21x greater than the amount of the dividend yield if held for a full year. Additionally, the 14.02% gain exceeds the return on a 30-year treasury purchased on July 6, 2009 by 3.22x.
Those not interested in following through with our sell recommendation can feel comfortable knowing that WEYS is a great long-term holding with a 14.02% downside cushion since our investment observation.  An additional insight on WEYS is the fact that the stock is approaching a technical breakout on the upside.  The prospects are that the stock could revisit $27, $32 and $35. 
As we have indicated in the purposes and function of this site, our goal is to:
  • maximize the annual yield of each trade.
  • reduce time between buying and selling of each stock.
  • exceed the annual yield of government guaranteed alternatives in each trade.
Investment observations are intended to be a starting point for investigating a quality company at a reasonable price. It is hoped that after doing the background research you can buy the stock at a lower price. Ideally the stock should be held in a tax-deferred account and should not consist of less than 20% of your holdings. Personally, we prefer holding only 2-3 stocks at a time.
Sell recommendations are intended to deal with the short-term reality of the market. The tracking of the Sell recommendations are the worst case scenario if you happen to have bought a stock at the time the Investment Observation was made (please avoid making this mistake.) We aim for mediocrity in our returns, therefore we are happy with 9-12% annual gains.
It is always recommended that when selling a stock, one should not place stop orders, limit orders or orders after hours. This leaves the seller in the position of being vulnerable to the whims of the market makers. Instead, place your sell orders only as a market order during market hours. Some would complain that a market order during market hours might leave some profits on the table. However, we would rather leave some money on the table rather than have it taken away from us by the trades that are placed by institutions and market makers.

-Touc

Email our team here.

Qualcomm (QCOM) Dropped After Earnings

Qualcomm (QCOM) tanked 7% today after the company announced their fiscal 2Q earning. The "reason" for the move, despite beating analyst expectations, is because of lower than estimated guidance for the upcoming quarter.
 
Let's take a look at the actual figures to see if we can make sense of this situation. Net income for 2Q10 came in at $0.59 vs. consensus of $0.56. That's 5% above consensus view. Guidance for 3Q10 is between $0.51-0.55, take the average and that is $0.53. The Wall Street expected $0.55. Given the company beat expectations by 5% and offered guidance that is 3% lower than expected ($0.53 vs. $0.55), QCOM shares fell 7%. That doesn't make sense to me.
 
In light of all this, we spoke about Qualcomm in late March 2010, which was only a month back. The action for this stock has been very volatile. With shares dropping 14% after reaffirming guidance to rising 8% after boosting forecast. Volatility, in my view, is great for value-oriented investors who are looking to acquire shares at a discount.
At the end of our March 25th posting, we said "we'd rather not chase it at this point" and we did just that, we stayed on the sideline. But now that Qualcomm is back within 20% of the 52-week low (at little less than $40), we are excited about the shares once again. Our initial model shows a good price to enter at $39 and a bargain price of $25.
 
We believe that you can start researching Qualcomm's viability as a company. With the recent announcement of a dividend increase of 12% and a $3 billion stock buyback program, we like the prospects of this company. – Art


Related:

Email our team here.

Nasdaq 100 Watch List

Below are the Nasdaq 100 companies that are within 20% of the 52-week low. Instead, they are the starting point for doing your research and determining the best company to buy.  Ideally, a stock that is purchased from this list is done after a considerable decline in the price and extensive due diligence.

Symbol Name Price P/E EPS Yield P/B % from Low
GILD Gilead 45.7 16.19 2.82 0 6.4 10.63%
GENZ Genzyme 53.64 34.81 1.54 0 1.82 13.91%
RYAAY Ryanair 29.23 0 0 0 0 17.77%
ATVI Activision 11.79 138.71 0.09 1.30% 1.36 19.33%
SYMC Symantec 16.68 43.32 0.39 0 3.1 19.40%

This list is strictly for the purpose of researching whether or not the companies have viable business models or are about to go out of business. These companies are deemed highly speculative unless otherwise noted.

Email our team here.

Quote of the Day

The following quote is drawn from the SEC Inspector General's (IG) finding in the "alleged" $7 billion ponzi scheme committed by Allen Stanford. To add insult to injury, the report ascribes the finding to the Fort Worth, Texas office, as if there was a remote and isolated instance of disregard on the enforcement  teams part in that office.  The full report can be found in PDF format HERE.

"The OIG investigation found, however, that the Enforcement staff [of the SEC] completely disregarded the investment adviser examiners’ concerns in deciding to close the Stanford MUI, and there was no evidence that the Enforcement staff even read the investment advisers’ 1998 examination report. Notwithstanding this lack of Enforcement action, by the summer of 1998, it was clear that both the investment adviser and broker-dealer examiners 'knew that [Stanford] was a fraud.'"

SEC Office of Inspector General, "Investigation of the SEC’s Response to Concerns Regarding Robert Allen Stanford’s Alleged Ponzi Scheme," Case Number OIG-526, page 27, March 31, 2010. accessed online April 16, 2010.

The fact that the findings of this report was issued 3 hours after the charging of Goldman Sachs (GS) of fraud brings into question the legitimacy of the SEC's willingness to take these matters seriously.  To be blunt, I think the Goldman charges are a PR ploy to draw attention away from the Stanford failure.

Useful Resources:

Email our team here.

Dividend Achiever Watch List

At the end of the week, our watch list contains 23 companies. Here is the watch list which ranks current and former Dividend Achievers that are within 20% of the 52-week low for April 16, 2010.

Symbol Name Price % Yr Low P/E EPS Div/Shr Yield Payout Ratio
MON Monsanto Co. 64.73 -0.69% 26.97 2.40 1.06 1.64% 44%
XOM Exxon Mobil Corp. 67.93 6.88% 17.08 3.98 1.68 2.47% 42%
FPL FPL Group, Inc. 48.43 6.93% 12.21 3.97 2.00 4.13% 50%
TMP Tompkins Financial Corp. 37.74 8.93% 12.75 2.96 1.36 3.60% 46%
DNB Dun & Bradstreet Corp. 76.31 10.43% 12.72 6.00 1.40 1.83% 23%
T AT&T Inc. 25.93 11.82% 12.24 2.12 1.68 6.48% 79%
FRS Frisch's Restaurants, Inc. 22.35 12.26% 9.93 2.25 0.52 2.33% 23%
FFIN First Financial Bankshares 52.61 13.24% 20.39 2.58 1.36 2.59% 53%
BRO Brown & Brown, Inc. 18.59 13.91% 17.23 1.08 0.31 1.67% 29%
LLY Eli Lilly and Co. 36.54 14.08% 9.27 3.94 1.96 5.36% 50%
THFF First Financial Corp. 28.94 14.25% 16.73 1.73 0.90 3.11% 52%
WMT Wal-Mart Stores, Inc. 54.11 14.28% 14.62 3.70 1.21 2.24% 33%
PGN Progress Energy Inc. 38.70 15.52% 14.29 2.71 2.48 6.41% 92%
CWT California Water Service 38.73 15.65% 19.86 1.95 1.19 3.07% 61%
UMBF UMB Financial Corp. 42.09 15.82% 19.13 2.20 0.74 1.76% 34%
WEYS Weyco Group, Inc. 24.14 15.95% 21.75 1.11 0.60 2.49% 54%
SFNC Simmons First National Corp. 27.79 16.28% 15.97 1.74 0.76 2.73% 44%
HCC HCC Insurance Holdings, Inc. 26.93 16.99% 8.65 3.11 0.54 2.01% 17%
WTR Aqua America, Inc. 18.08 17.48% 23.57 0.77 0.58 3.21% 76%
AROW Arrow Financial Corp. 27.33 19.18% 13.73 1.99 1.00 3.66% 50%
NWN Northwest Natural Gas Co. 47.40 19.76% 16.75 2.83 1.66 3.50% 59%
SYBT S.Y. Bancorp, Inc. 23.73 19.85% 19.94 1.19 0.68 2.87% 57%
OTTR Otter Tail Corp. 22.34 19.91% 31.46 0.71 1.19 5.33% 168%
23 Companies

Watch List Summary
The best performing stock from last week's list was Shenandoah Telecom (SHEN) which rose 4.8%. The worst performing stock, once again, was Monsanto (MON) which fell another 6% (it fell 2.8% last week). Overall, the Dividend Achiever watch list gained 0.2% versus the Dow which was flat.

I revisited our watch list from three months ago (January 15, 2010) to see what result these companies produced. The average gain for the list was 13% compared to the Dow's gain of 3%. The biggest gainer was Southwest Bancorp (OKSB) which rose 92%. The worse performer was Exxon (XOM) which fell 1.7% and remains on our list. Although OKSB appeared to be speculative because of regional banking sector, we mentioned that we will include regional banks that have payout ratios of less than 50%. OKSB's payout ratio was 16%.
The key to this list isn't to provide a winner but collectively, we hope that it can be a starting point for you to research these companies and hopefully provide lower volatility, margin of safety and  provide marginally higher return than the general market.
Related Links:

Email our team here.

Dow Theory Q & A

Reader SD asks:
 
"If the Dow appears to hit a peak and begins dropping (Dow Theory bear market indication), is the indicated action to sell your stocks and put your investments into cash until the Coppock curve or other indicators show the market has hit a bottom?"
 
Touc's Reply:
 
There are several approaches to the use of Dow Theory when determining the best time to sell stocks. The first could be to sell all stocks when a Dow Theory bear market is signaled. The second could be to ignore the gyrations of the market and only sell a stock when it is "clearly" overvalued. The final method is the one that I use which involves changing my allocation of stocks.
 
In the first scenario, we will take the perspective of the great Dow Theorists Richard Russell on the application of Dow Theory towards the portfolio when a bear market is signaled. Upon reflection of the market declines from October 2007 to March 2009, Richard Russell said, "...Let's say you are compounding your assets (reinvesting your dividends and interest) beautifully until a full-fledged primary bear market comes along (1973-74 and again in 2008). Within a year or two your assets are cut in half, and all your compounding has gone to waste." By this commentary, Russell seems to imply that an investor should sell all of their stocks at the onset of a Dow Theory bear market indication or risk wiping out tremendous gains that might have been accrued in the process.
 
On November 12, 2007 Richard Russell call the bear market top in the weekly financial publication Barron's. According to Russell, it makes no sense to trifle with the bear market which can plumb depths unimaginable in a period of time that is far shorter than it takes to rise in a bull market. So why risk wasting the power of compounding to a bear market, especially when you "know" it is coming. In this respect, Russell says sell all of your stocks and wait until the next bull market indication to arrive.
 
The second Dow Theory approach to selling a stock is the most commonly misapplied. This approach is supposed to be grounded on the belief that market participants understand values. The misapplication that often occurs is when overvaluation is ignored and a stock isn't sold based on this fact. All Dow Theorists can point to the buying and selling of stocks as being based in the understanding of values. The claim of an understanding of values applies to stocks that are undervalued as well as overvalued. An undervalued stock should be bought while an overvalued stock should be sold, regardless of market condition. Once an undervalued stock has been purchased it could take weeks, months, or years before the stock is overvalued. A stock that has become overvalued should be sold at the earliest opportunity and is often at a new high.
 
In answer to the question of when to sell a stock based on values, the renowned Dow Theorist Robert Rhea had the following to say:
 

"Investors may ask how they can determine the point when stocks are selling far above value and probable earnings. That, indeed, is a hard question to answer because no two men appraise values on the same basis. I can only say that sometime before the peak was reached in 1929, American Telephone and Telegraph [AT&T] (T) was selling around $300 per share. It had a book value of about $128, and its best recorded earnings were in 1929 when the reported net for common was $12.67 per share. Now in 1926 the stock had sold for $151 when its book value was $126, with earnings of $11.95. With its dividend at $9.00, a comparatively small amount was carried to surplus each year. At the price first noted above, the advance in the quoted value of this stock had obviously discounted earnings for many years in the future; moreover, it was selling far above its intrinsic value."

The last method for buying and selling is one that I have combined and modified based on the methods described above which involves taking the Dow Theory signal and allocating more or less money to a given stock. During periods when there is a Dow Theory bull market indication, I invest a minimum of 25% of my capital in a single stock that is at or near a new low. After obtaining what I believe to be "fair profits," I rotate the money into the next "undervalued" Dividend Achiever or Nasdaq 100 stocks. As long as the bull market indication is in effect, I continue to overweight my stock positions in solid companies with proven track records. I'm very flexible in the amount of time that it takes to accomplish the goal of exceeding "guaranteed" money alternatives like treasuries, CDs, money market and savings accounts on an annualized basis.
 
As soon as a bear market signal is given, based on Dow Theory, I shorten the amount of time that I'm willing to wait for an undervalued stock to generate "fair profits." In addition, I cut my minimum position in an individual stock down from 25% to 12% (generally speaking). Basically, I reduce the amount of risk that I'm willing to take in a stock under conditions that might not be as favorable for gains. However, I do not sell stocks outright in anticipation of market declines based on Dow Theory bear market indications. Keep in mind that, under certain circumstances, a bull market can still be in effect after a decline of 20% to 30%. This leaves a lot of room for miscalculation if you automatically sell based on a decline of 10% or more.A review of my 2008 and 2009 transaction histories should demonstrate the value of the approach described above. Follow-up commentary regarding the 2008 transaction history is worth reading as it provides additional insight to the methods now used by the New Low Observer team. It is important to note that, although there was a bear market indication since November 2007, activity in the market did not cease.
 
Again, keep in mind that bear markets are no guarantee of losses in your portfolio. Charles H. Dow, founder of the Wall Street Journal, has said that:
 

"Even in a bear market, this method of trading will usually be found safe, although the profits taken should be less because of the liability of weak spots breaking out and checking the general rise."

I feel that the strategy that we employ is very close to what Charles H. Dow had written about in regards to buying and selling stocks in both bull and bear markets.
 
Art's Reply:
 
Even when a bull market indication is given or the Coppock Curve turned positive, we have to be rational about deploying our capital. A Dow Theory buy indication doesn't signal "all-in" or imply that we can buy stocks blindly. Some stocks performed wonderfully and some lag the market. The same can be said about bear markets.
 
Touc and I bought Altria (MO) in early December 2008 when the company yielded 8%. This transaction occurred during the bear market and took place months before the market reached a bottom. Our sell recommendation netted 13% in less than 2 months.
 
If you'd like to prepare yourself for the coming bear market, I suggest that you pick up a book by Harry Schultz, Bear Market Investing Strategies.
 
Useful References:

Dow Theory

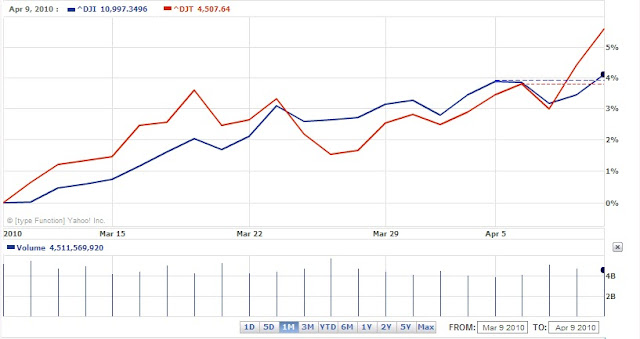
On Friday April 9, 2010, the Dow Jones Industrials and the Dow Jones Transportation Averages both moved to new highs at the same time. According to Dow Theory, this confirmation by both averages would indicate that the market has more room to go on the upside before a change of direction is to take place.
The path to this bull market confirmation (within a secular bear market) has been a battle with many casualties. The last week had many examples to demonstrate this point. On April 5th, the Industrials broke to a new closing high however the Transports did not confirm. On April 6th, the Transports broke to a new high but the Industrials did not confirm. On April 8th, the Transports broke above the high that was established on April 6th however the Industrials could not exceed the previous high of 10,973.55 set on April 5th.  April 9th finally cleared the air on the much needed confirmation of the market's trend.
The factors that are in favor of the continuation of the bull market are that the Industrials and Transports are 50% above their respective 2007 to 2009 declines. Additionally, prior declines within secular bear markets like 1906 to 1924 or 1966 to 1982 have had many retrenchments of 80% to 100% before falling back to the old lows. So far, the Industrials have recouped 58.42% of the previous decline. If the Industrials were to retrace a classic Dow Theory 2/3 of the previous decline, the index could go to 11,574.59 with no problem.
However, the tepid nature of the gains that led to the new highs along with the lackluster volume that has accompanied the move up from the March 9, 2009 low doesn’t seem to encourage confidence in the direction. More alarming is the fact that we are not near historical levels of under-valuation in the market in general. The Dow Industrials currently has a dividend yield of 2.48% when the long-term average high yield is around 6%. Also of concern is that the Dow Fair Value is at 6.92 times the dividend yield. This is contrasted with the 1.52x that is normally associated with great buying opportunities.
The former editor of the Wall Street Journal and Dow Theorist William Peter Hamilton once said, “the wish must never be allowed to father the thought.” For this reason, we will take a wait and see approach to the market going forward.  However, until proven otherwise, we are on a march back to Dow 14,164.53, which was set on October 9, 2007. In anticipation of the rise to the old market high, we have illustrated, in the chart below, three upside scenarios for the Dow Industrials.
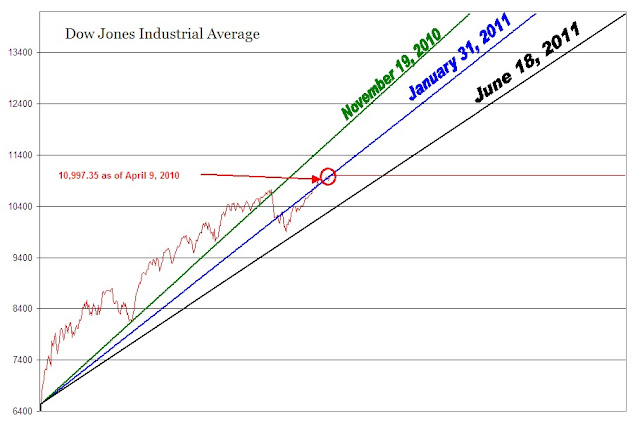
The first projection (green line) assumes that the Industrials will continue the torrid pace set from March 9, 2009 to January 19, 2010. The likelihood of the index continuing at such a pace is not expected. However, in the book Charles H. Dow: Economist by George W. Bishop, Jr., it is noted that, according to Charles Dow, there are two stages to a bull market in stocks and that the second stage is more bullish than the first stage. This contrasts sharply with Robert Rhea and William Peter Hamilton’s assertion that there are three stages to every bull and bear market. If we are in the transition to the “second and final” stage of this bull run then it is possible for the market to continue on, and possibly exceed, the first trajectory that was previously set. The projected date that the Dow would reach 14,164.53 is November 19, 2010.
The second projection (blue line) is based on the March 9, 2009 to April 9, 2010 action on the Dow Jones Industrials. This pace seems more realistic than the first projection since it assumes a less dramatic increase in the index. To think that the market could continue moving higher as it had in the past would be quite unrealistic. Based on the current trajectory the Dow would reach the old high by January 31, 2011.
Finally, the third projection (black line) is based on the current trend being the mean and the first projection being the high end of the range. The third projection is a mirror of the first. The third trajectory would reach the old high by June 18, 2011.
Although we have a clear bull market confirmation (within the context of a secular bear market) it is necessary to determine where the downside targets should be. According to Dow’s Theory the following are the targets for a subsequent decline:
  • 9513.92
  • 8030.49

In addition to the normal downside targets, there is the prospect that if the Dow falls below the imaginary third projection level (black line), then all bets are off.  From the current Dow Theory confirmation, if the index cannot retains the level of 10,997.53 beyond July 15, 2010, then the market should have a major correction shortly thereafter.
Reaching the old high is all within the context of a normal secular bear market. The tendency is for the market to get to the old high and then quickly wipe out the notion that a new secular bull market is about to begin. This is the nature of a secular bear market.
Useful References: 

Email our team here.

Nasdaq 100 Watch List

Below are the Nasdaq 100 companies that are within 20% of the 52-week low. Instead, they are the starting point for doing your research and determining the best company to buy.  Ideally, a stock that is purchased from this list is done after a considerable decline in the price and extensive due diligence.

Symbol Name Trade P/E EPS (ttm) Yield P/B % from Low
GILD Gilead 45.7975 16.2 2.822 0 6.48 10.86%
GENZ Genzyme 52.8 34.3 1.54 0 1.81 12.13%
SRCL Stericycle 54.58 27 2.03 0 5.44 18.76%
QCOM QUALCOMM 42.17 33.8 1.25 1.60% 3.32 18.92%
APOL Apollo Group 63.14 15.8 4 0 7.13 19.61%
RYAAY Ryanair 29.75 N/A - 0 N/A 19.86%
This list is strictly for the purpose of researching whether or not the companies have viable business models or are about to go out of business. These companies are deemed highly speculative unless otherwise noted.
Email our team here.

Dividend Achiever Watch List

At the end of the week, our watch list contains 26 companies. Here is the watch list which ranks current and former Dividend Achievers that are within 20% of the 52-week low for April 9, 2010.

Symbol Name Price % Yr Low P/E EPS Div/Shr Yield Payout Ratio
MON Monsanto Co. 68.85 3.42% 24.78 2.78 1.06 1.54% 38%
DNB Dun & Bradstreet Corp. 74.49 7.80% 12.42 6.00 1.40 1.88% 23%
XOM Exxon Mobil Corp. 68.76 8.18% 17.28 3.98 1.68 2.44% 42%
TMP Tompkins Financial Corp. 37.55 8.38% 12.69 2.96 1.36 3.62% 46%
FPL FPL Group, Inc. 49.71 9.76% 12.53 3.97 2.00 4.02% 50%
WEYS Weyco Group, Inc. 23.31 11.96% 21.00 1.11 0.60 2.57% 54%
BRO Brown & Brown, Inc. 18.30 12.13% 16.94 1.08 0.31 1.69% 29%
FFIN First Financial Bankshares 52.82 13.69% 20.47 2.58 1.36 2.57% 53%
CWT California Water Service 38.08 13.71% 19.53 1.95 1.19 3.13% 61%
T AT&T Inc. 26.44 14.01% 12.48 2.12 1.68 6.35% 79%
LLY Eli Lilly and Co. 36.84 15.20% 9.35 3.94 1.96 5.32% 50%
SHEN Shenandoah Telecom 18.56 15.28% 29.00 0.64 0.32 1.72% 50%
THFF First Financial Corp. 29.24 15.44% 16.90 1.73 0.90 3.08% 52%
UMBF UMB Financial Corp. 42.15 15.99% 19.16 2.20 0.74 1.76% 34%
SFNC Simmons First National 27.74 16.07% 15.94 1.74 0.76 2.74% 44%
WMT Wal-Mart Stores, Inc. 55.07 16.30% 14.88 3.70 1.21 2.20% 33%
WTR Aqua America, Inc. 17.92 16.44% 23.27 0.77 0.58 3.24% 75%
AROW Arrow Financial Corp. 26.77 16.74% 13.45 1.99 1.00 3.74% 50%
PGN Progress Energy Inc. 39.17 16.93% 14.45 2.71 2.48 6.33% 92%
SYBT S.Y. Bancorp, Inc. 23.16 16.97% 19.46 1.19 0.68 2.94% 57%
OTTR Otter Tail Corp. 21.87 17.39% 30.80 0.71 1.19 5.44% 168%
NWN Northwest Natural Gas Co. 46.88 18.44% 16.57 2.83 1.66 3.54% 59%
MLM Martin Marietta Materials 87.51 18.61% 45.82 1.91 1.60 1.83% 84%
HCC HCC Insurance Holdings 27.31 18.64% 8.78 3.11 0.54 1.98% 17%
CTWS Connecticut Water Service 23.18 20.04% 19.48 1.19 0.91 3.93% 76%
SBSI Southside Bancshares, Inc. 20.99 20.70% 7.44 2.82 0.65 3.10% 23%
26 Companies

Watch List Summary 
The best performing stock from last week's list is American State Water (AWR) which rose 7.4%. The worst performing stock is Monsanto (MON) which fell 2.8%. Overall, the Dividend Achiever watch list gained 1% versus the Dow gained of 0.63%.


You may have noticed that this list is full of utility (Electricity, Gas, and Water) companies. Recently, a reader asked for our opinion on FPL Group (FPL). We replied under Research Request and urged anyone interested in investing in utilities carefully examine the sector. Although we are long California Water (CWT), we are not too excited about this sector due to the eventual rise in interest rates. Many people, myself included, may not remember the 70's (I wasn't even born yet) but our studies have shown that undervalue utilities became a bigger bargain when interest rate rose. Companies with dividend yields of 5% quickly became 10% as the price collapsed. The excerpt below was taken from my commentary on Seeking Alpha
Utilities got CRUSHED in the 70's when actual inflation came. Take a look at ED which traded at $5 at the end of 1974. Once year later the stock was just north of $2. It didn't reach $5 until end of 1977.AEP is another example. It closed 1974 at $26. It hit a low of $14 toward the end of 1975 and later closed the year at $18. It didn't get truly above $26 level until 1986.CNP is another name that got clobbered in 1973 to 1975.FPL didn't start trading until 1983 which saw the beginning of rate decline. The Fed Fund rate shot up to 12.9 in July 1974, came down and went back up to 14.94 in April 1982.Anyone interested in investing in Utilities, should study what really happen to cost of borrowing for these companies when rate rose.
- Art
Email our team here.

Embracing the Economic "New Normal"

According to the Tax Foundation, Americans paid their portion of the Federal tax bill, as measured in number of days out of 365, on April 9th. This was one day later than in 2009. The reason for the reduction in the number of days needed to pay our portion of taxes since 2007 is because of all the stimulus and bailouts that have occurred since the onset of the financial "crisis."
  
If we review the chart on the number of days Americans achieved their "Tax Freedom Day," we find that during years with economic growth we take longer to obtain our freedom. The government sticks it to us when we're making more money. Notice also that our federal budget deficit has gone parabolic for the very same reason that our annual tax bill has gone down.

I've always maintained that this bear market resembles the secular bear period from 1966 to 1982. The chart shows a shocking resemblance between the two periods. In 1968, Tax Freedom Day took place later than the date for the deficit. Likewise, in 1999, freedom occurred after the date for the deficit. After the crossover took place in 1968, our economy hit the high inflation skids thereafter.

For good reason, the 2009 parabolic move in the deficit scares me plenty. If the past is any indication of the future then we're gonna get rampant inflation like never before seen. The irony of this is that after getting slammed in stocks and real estate, most people are seeking safety above all else. The most obvious target for safety is a bank with deposit insurance. Unfortunately, the reformed saver (formerly known as an investor) will get crushed in the coming inflation.
"Markets have risk. So does a savings bank when inflation runs rampant."
Richard Russell. Dow Theory Letters. October 7, 1958. page 2.
What is likely to occur is that the same people who got beaten down in real estate and stocks will get nothing less than clobbered when they are locked in a 6-month certificate of deposit at a local bank. Those with the cash will be reluctant to buy real estate or the "right" stocks. Utility stocks will be the favored choice for "safety" but the unsuspecting will wish they never heard of utility companies as a "safe" investment. Even my favorite Dividend Achievers will be taking it on the chin during high inflation.

My solution to the coming inflation is to embrace it. One way to do this is to read Is Inflation Ending? Are You Ready? This book was written in 1982 by Gary Schilling and Kiril Sokoloff (published in 1983) explaining why the days of double digit inflation were over. This is important because everything that happened after 1983 can easily be verified. In the book, we get insight as to what happens in a deflationary environment which precedes breakneck inflation. In order to understand where we're going we need to know where we came from, the book by Schilling and Sokoloff covers 60% of the high/low inflation equation.

Next, read the book Crisis Investing by Douglas Casey. Casey's book covers all ends of the investment spectrum with a bias towards high inflation environments. While you might not need half of the strategies that are mentioned, Crisis Investing will come in handy when you need a quick reference.

Research Request: FPL Group (FPL)

The research request that we've received is from Brian out of Austin, Texas who asks what our thoughts on FPL Group (FPL) might be.  According to Value Line Investment Survey, "FPL Group, Inc. is a holding company for Florida Power & Light (FPL), a utility engaged in the generation, transmission, distribution, and sale of electricity to 4.5 mill. customers in a 27,650-sq.-mi. area in eastern & southern Florida. NextEra Energy Resources is a nonregulated power generator with nuclear, gas, & wind ownership."
At the forefront of the concerns for FPL Group (FPL)  is the recent rejection by state regulators for a rate increase.  On January 14, 2010, FPL Group (FPL) was turned down for the requested rate increase of $1 billion in 2010 and $250 million in 2011.  As bad as this seems for FPL Group (FPL) the decline in the stock price seemed to have anticipated the outcome with the peak of the price on December 11, 2009 at $56.25.  After December 11th, the stock of FPL Group (FPL) fell to $51.50 the day before the rate decision came due.  In my estimation, any decline in the price of FPL after the decision was simply reactionary on the part of speculators who were caught on the wrong side of the trade.  FPL fell to its lowest point at $45.57 and has risen steadily since.
According to Dow Theory, FPL has the following upside targets (based on the peak of $72.56 on December 5, 2007 and the decline to $37.08 on October 10, 2008.):
  • $48.90
  • $60.73
  • $72.56
FPL has the following downside targets (based on the February 2, 2000 low at $18.41 to the peak of $72.56):
  • $45.48
  • $36.43
  • $27.42
  • $18.41
Of particular concern to me is the fact that we are in the 5th year of an inflationary cycle.  As noted in the right hand column of our website, inflation seems to have a 50-year full cycle which according to Dewey and Dakin's book Cycles: The Science of Prediction, would have begun in 2005/2006.  It is important to note that Dewey and Dakin's book was published in 1947 and indicated the subsequent peaks and troughs in the inflation rates since.   The impact of this thesis is quite relevant to FPL Group (FPL) and all utility companies since they rely almost exclusively on borrowing to fund their current and future operations.  The higher their borrowing costs the more the impact to the company's earnings.

With the aforementioned interest rate issues in mind, I would like to reference Investment Quality Trends view that FPL Group (FPL) is considered undervalued when the stock has a dividend yield of 9%.   With the current annual dividend of $2, FPL Group (FPL) would be selling for $22.22 if yielding 9%.  If we were to assume that FPL Group (FPL) were to fall between the current yield of 4.10% and 9%, the FPL Group (FPL) would fall to the level of $30 when yielding 6.5%.  These estimates to the downside should be paramount to the consideration of the investment in utilities.  What concerns me the most with utilities is the prospect of a decline similar to the period from 1965 to 1974.  In that period, the yield on the Dow Jones Utility Index went from 3% all the way up to 12% (Source: Weiss, Geraldine, Dividends Don't Lie, Longman, 1988).
 
According to Value Line Investment Survey, FPL normally trades around 1.34 times the per share dividend divided by the "interest rate" (1.34x $2/interest rate). Valueline doesn't tell us by which interest rate we should apply to the company, so I have decided to apply the 30, 20, and 10 year U.S. Treasury rate. The following are the mean prices that FPL would trade at for each interest rate scenario:

  • 30-year rate- $55.71
  • 20-year rate- $57.63
  • 10-year rate- $67.68

Based on the 30 year rate, FPL is selling 14.84% below the historical mean value. I chose the $55.71 value since it was the most conservative figure.

Considering all the issues that are present in an increasing interest rate environment going forward, we're going to take a look backwards and examine the fundamentals of FPL Group (FPL).  According to Morningstar.com, FPL is selling 28.5% below the average P/E over the last 10 years.  In terms of the price-to-book ratio, FPL is selling 29.33% below the 10-year average.  The extremes based on the 10-year average for FPL are that the stock is selling 14% below the average based on a price-to-sales ratio and 57% below the average on a price to cashflow basis over the same period.

Again, my concern with the fundamental data on utilities since 1980 is that it is based on a falling interest rate environment which is highly favorable to borrowers.  The opposite should be true in what I believe lies ahead for interest rates.  If I were to invest in this stock, I would buy, as my limit, only half of my normal position and no more.
Email our team here.

Dividend Achiever Watch List

At the end of the week, our watch list contains 26 companies. Here is the watch list which ranks current and former Dividend Achievers that are within 20% of the 52-week low for April 1, 2010.
 
Symbol Name Price % Yr Low P/E EPS Div/Shr Yield Payout Ratio
TMP Tompkins Financial Corp. 36.52 5.41% 12.34 2.96 1.36 3.72% 46%
XOM Exxon Mobil Corp. 67.61 6.37% 16.99 3.98 1.68 2.48% 42%
MON Monsanto Company 70.83 6.40% 25.48 2.78 1.06 1.50% 38%
DNB Dun & Bradstreet Corp. 74.38 7.64% 12.40 6.00 1.40 1.88% 23%
FPL FPL Group, Inc. 48.84 7.84% 12.30 3.97 2.00 4.10% 50%
BRO Brown & Brown, Inc. 17.73 8.64% 16.42 1.08 0.31 1.75% 29%
UMBF UMB Financial Corp. 40.41 11.20% 18.37 2.20 0.74 1.83% 34%
T AT&T Inc. 26.11 12.59% 12.32 2.12 1.68 6.43% 79%
WEYS Weyco Group, Inc. 23.55 13.11% 21.22 1.11 0.60 2.55% 54%
FFIN First Financial Bankshares, Inc 51.93 13.16% 20.13 2.58 1.36 2.62% 53%
AWR American States Water 35.20 14.21% 21.73 1.62 1.04 2.95% 64%
CWT California Water Service 38.32 14.42% 19.65 1.95 1.19 3.11% 61%
WTR Aqua America, Inc. 17.63 14.55% 22.90 0.77 0.58 3.29% 75%
THFF First Financial Corp. 29.12 14.96% 16.83 1.73 0.90 3.09% 52%
SHEN Shenandoah Telecom 18.59 15.47% 29.05 0.64 0.32 1.72% 50%
SFNC Simmons First National Corp. 27.60 15.48% 15.86 1.74 0.76 2.75% 44%
SYBT S.Y. Bancorp, Inc. 22.88 15.56% 19.23 1.19 0.68 2.97% 57%
LLY Eli Lilly and Company 36.15 16.95% 9.18 3.94 1.96 5.42% 50%
MLM Martin Marietta Materials, Inc. 86.50 17.24% 45.29 1.91 1.60 1.85% 84%
LKFN Lakeland Financial Corp. 19.18 17.31% 15.22 1.26 0.62 3.23% 49%
PGN Progress Energy Inc. 39.74 18.63% 14.66 2.71 2.48 6.24% 92%
NWN Northwest Natural Gas 46.98 18.70% 16.60 2.83 1.66 3.53% 59%
OTTR Otter Tail Corp. 22.18 19.06% 31.24 0.71 1.19 5.37% 168%
PBI Pitney Bowes Inc. 24.45 19.97% 11.99 2.04 1.46 5.97% 72%
MGEE MGE Energy Inc. 35.45 20.50% 16.04 2.21 1.47 4.15% 67%
UGI UGI Corp. 26.72 20.85% 12.09 2.21 0.80 2.99% 36%
26 Companies


Watch List Summary 

The best performing stock from last week's list, is California Water Service (CWT) which rose 4.1%. The worst performing stock is Tompkins Financial Corp. (TMP) which fell 3.3%. Overall, the Dividend Achiever watch list gained 1.2% versus the Dow gained of 0.7%.

New addition to this list is Dun & Bradstreet (DNB) which is a former Dividend Achiever. DNB was removed from this list in 2000 after stopping the dividend payment. They reinstated dividend in March 2007 at $0.25 per share and have been raising that over the past three years. Current payout is at $0.35 which equate to annual increase of 12%.
- Art

Email our team here.

Coppock Curve Q & A

A reader asks:
"Isn't it possible to determine good times to sell stocks using the Coppock Curve?"
Touc's reply:
My understanding of the Coppock Curve is that it is strictly for the purpose of giving buy signals. Sell signals are purely coincidental if they occur at all.
Drawing from Mr. Coppock's own words in Barron's October 15, 1962 article, Mr. Coppock states that,"It [Coppock Curve] gives a so-called buy signal."(page 5) Mr. Coppock goes even further to state that, "Because well-timed buying is far more difficult for the nonprofessional investor than timely selling, it is best to think of the curve as a very long-term buying guide. Its formula was devised for that type of use." (page 5,16)

In James Dines' book Technical Analysis (page 377, 1972), there is no mention of the Coppock Curve as being able to provide a sell signal or eminent market slumps. Any mention of the Coppock Curve was with the ability of the Curve to "pinpoint the start of new trends and enable investors to select future market leaders." (page 378)
There seems to be no evidence that would suggest that the Coppock Curve should be used to determine potential declines. Instead, the Curve should only be tested on its ability to accurately call the bottom in a given stock or index.
Best regards.
Email our team here.