Gold and gold stocks had a lot of movement this past week but little to show for it.
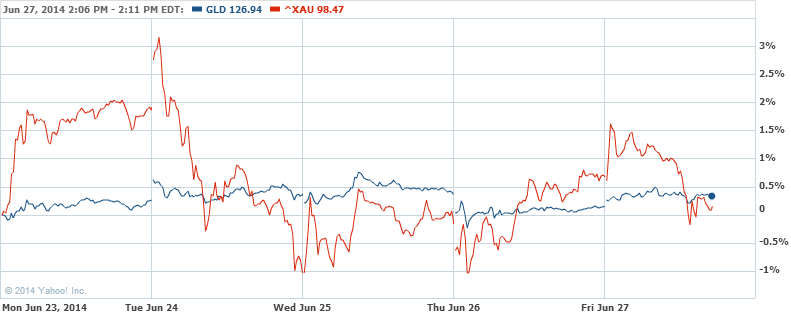

Gold and gold stocks had a lot of movement this past week but little to show for it.
“A good analyst is wrong one-third of the time. An average one is wrong half the time. A poor analyst is worse than a coin toss.”
source: Chase, C. David. Mugged on Wall Street. Simon and Schuster, New York. page 233.
North West Company (NWC.TO)
Below is the performance of the twelve stocks from our June 21, 2013 Nasdaq 100 watch list (found here) compared to the Nasdaq 100 Index gain of +32.13% over the last year.
| Symbol | Name | 2013 | 2014 | % change |
| FFIV | F5 Networks, Inc. | 70.92 | 108.81 | 53.43% |
| NUAN | Nuance Communications | 18.5 | 19.47 | 5.24% |
| GOLD | Randgold Resources Limited | 66.712 | 82.25 | 23.29% |
| INTU | Intuit Inc. | 57.86 | 79.5 | 37.40% |
| TEVA | Teva Pharmaceutical | 38.74 | 52.97 | 36.73% |
| CTXS | Citrix Systems, Inc. | 59.988 | 64.93 | 8.24% |
| GRMN | Garmin Ltd. | 34.69 | 60.05 | 73.10% |
| AAPL | Apple Inc. | 59.07 | 90.91 | 53.90% |
| CHRW | CH Robinson Worldwide | 54.79 | 63.92 | 16.66% |
| ALTR | Altera Corp. | 31.99 | 35.04 | 9.53% |
| ALXN | Alexion Pharmaceuticals | 88.492 | 165.46 | 86.98% |
| EXPD | Expeditors Int’l of WA | 37.05 | 44.49 | 20.08% |
| Average | 35.38% |
Standout performers were Alexion Pharmaceuticals, Garmin, Apple and F5 Networks. The stocks that underperformed were Nuance Communications, Citrix Systems and Altera Corp. The top 5 stocks on the list gained as average of only +31.22% in the last year which is less that the benchmark Nasdaq 100 Index.
Nasdaq 100 Watch List: June 20, 2014
Below is the latest watch and estimated targets.
Gold and gold stock continued to climb higher in the last week. The gold ETF (GLD) rose +2.90% in the last five days while the gold stock index (XAU) rose +6%.

The Gold Stock Indicator for the same period shows the critical levels that need to be exceeded on the upside.
Posted in Barron's Gold Mining Index, gold, gold bugs, Gold Stock Indicator, XAU
Tagged members
Contributor C. Cheng asks:
“Interesting that you should mention scarcity of water creating an upside cap on the company’s profitability. Now that California is dealing with drought conditions, how do you think this will factor into CWT’s performance?”
Our response:
On January 3, 2010 (found here), we posted an Investment Observation on California Water Service (CWT). At that time we said that CWT has a 6-year pattern of trading in a range before breaking out to the upside, price is driven by the dividend with an upside target of $24.145 ($48.29).
Regarding the 6-year cycle, we said the following:
“CWT has had a pattern of trading in a range for approximately 6 years at a time before breaking out to a new and higher trading level. The following are the range in years that CWT traded before obtaining a new high:
Our expectation was that at some point in 2011, CWT would ideally be bought for the pending breakout of the stock price.

The reality of the situation with CWT is that the stock finally broke out of the trading range in January 2013. Again, the 6-year trading range was only the average. However, while investors waited for the stock price to increase there was a sizable dividend being offered at the time. Coincidentally, the price of CWT has peaked at $48.28 on a closing basis as recently as March 25, 2014. This closing price is within $0.01 of our projected high set in 2010.
Our view is that only in hindsight will we know for sure the impact of water scarcity on CWT. However, below is the trend of quarterly earnings since our 2010 posting and it seems to reflect the fact that instead of being able to see higher earnings in the face of scarcity (the rational economic view) we’re seeing pre-drought earnings.
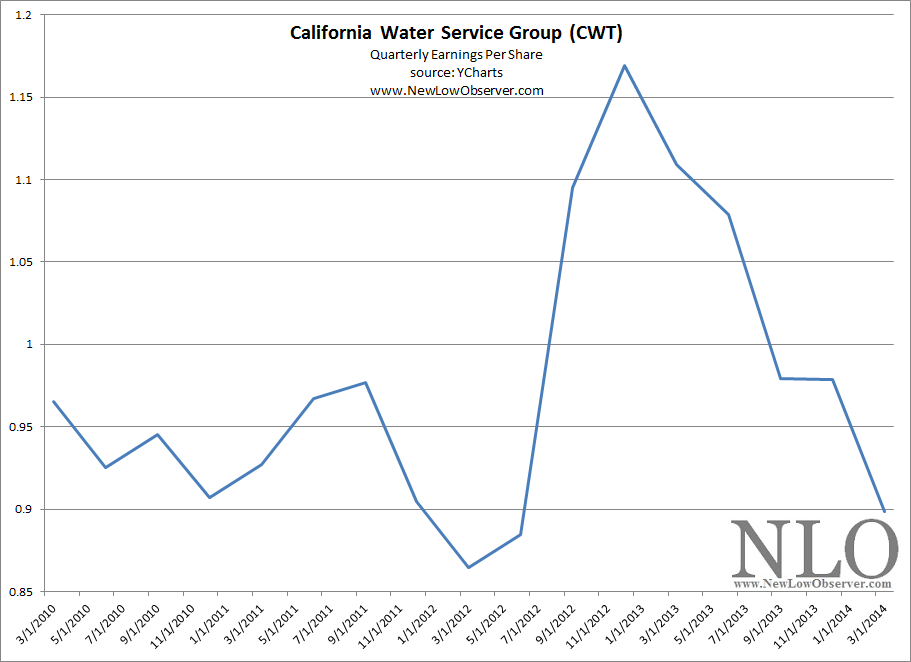
What we do know is that the price performance of the CWT has a lot to do with the price paid. Given that CWT currently trades at 25.8x earnings and yields “only” 2.8% (low for a utility), the odds of the stock outperforming in the long-run are slim.
In addition, utility companies generally issue bonds to fund their operations. With interest rates on the rise, their cost of funding will put more pressure on the future earnings. As such, our view on the risk/reward isn’t as rosy for CWT.
Posted in California Water Service, CWT, water utilities
Performance Review
Below is the 1-year performance of the Canadian dividend stocks from our June 2013 watch list (found here):
| Symbol | Name | 2013 | 2014 | % change |
| IMO.TO | Imperial Oil Ltd. | 39.51 | 55.76 | 41.13% |
| FTT.TO | Finning International Inc. | 22.01 | 28.88 | 31.21% |
| CPG.TO | Crescent Point Energy Corp. | 35.9 | 46.96 | 30.81% |
| CM.TO | Canadian Imperial Bank of Commerce | 77.18 | 97.1 | 25.81% |
| TD | The Toronto-Dominion Bank | 39.95 | 49.92 | 24.96% |
| NA.TO | National Bank Canadian Equity SP | 37.75 | 46.12 | 22.17% |
| IFC.TO | Intact Financial Corporation | 60.62 | 73.48 | 21.21% |
| BDT.TO | BIRD CONSTR INC | 12.08 | 13.6 | 12.58% |
| LB.TO | Laurentian Bank of Canada | 44.1 | 49.23 | 11.63% |
| BEI-UN.TO | Boardwalk Real Estate Investment Trust | 59.12 | 65.09 | 10.10% |
| CJR-B.TO | Corus Entertainment Inc. | 23.8 | 25.25 | 6.09% |
| CWT-UN.TO | Calloway REIT | 25.55 | 26.62 | 4.19% |
| REI-UN.TO | Riocan Real Estate Investment Trust | 26.21 | 26.86 | 2.48% |
| AX-UN.TO | Artis Real Estate Investment Trust | 15.33 | 15.38 | 0.33% |
| TLM.TO | Talisman Energy Inc. | 11.63 | 11.52 | -0.95% |
| CAR-UN.TO | Canadian Apartment Properties REIT | 22.94 | 22.64 | -1.31% |
| FCR.TO | First Capital Realty Inc. | 18.43 | 18.17 | -1.41% |
| EMA.TO | Emera Inc. | 34.29 | 33.76 | -1.55% |
| FTS.TO | Fortis Inc. | 33 | 31.75 | -3.79% |
| TA.TO | TransAlta Corp. | 13.64 | 12.93 | -5.21% |
| TMXXF | TMX Group Limited | 53.0417 | 48.5 | -8.56% |
| CUF-UN.TO | Cominar REIT | 21.39 | 18.65 | -12.81% |
| D-UN.TO | Dundee REIT | 33.15 | 28.9 | -12.82% |
| Average | 8.54% |
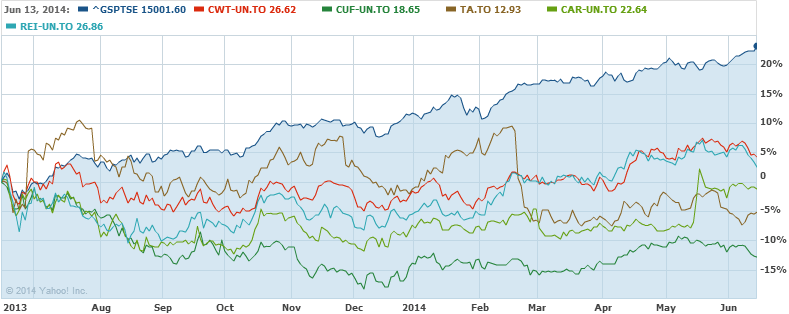
As described in our June 2013 watch list, the REIT sector was expected to underperform (highlighted in red above). We said the following:
“What is most alarming about the most recent decline in these REITs is the fact that, unlike the large decline of 2011, the current decline has broken through the 2012 lows which is a huge technical failure. In 2011, as the Canadian REIT industry was experiencing a hiccup, the price of the stocks did not decline below the 2010 support level (approximately October/November 2010). In addition, as 2011 prices did not fall below 2010 lows, the REITs climbed above the 2011 peak (approximately April/May 2011). Unfortunately, the most recent rise from the October/November 2012 low could not exceed the July 2012 peak. These are classic Dow Theory indications of a sector that has further to go on the downside.”
Below is the performance of the five stocks that topped our list last year as compared to the Toronto Stock Exchange:
Canadian Dividend Watch List: June 13, 2014
Below is the June 2014 watch list of stocks that we think are worth your consideration and due diligence.
A big week for gold and gold stocks.
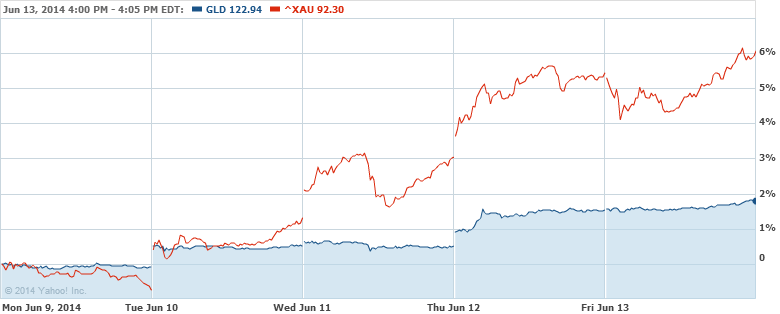
The gold ETF, under the symbol GLD, increased +1.79% while the Philadelphia Gold and Silver Stock Index increased +6%. As a measure of the extreme in performance of gold stocks, Allied Nevada Gold (ANV) increased +22.41% in the last five days. However, the real test of the current market in gold and gold stocks is revealed in the Gold Stock Indicator below.
In an article titled “3 reason the Dow doesn’t deserve to be at 17,000” (found here), author David Weidner outlines why “…the bull market in stocks is running for all the wrong reasons.” The three reason that Mr. Weidner gives are lack of public participation, corporate earnings are flat and few alternatives investments for savers.
We actually believe the opposite is true, the Dow is short of the mark in terms of where it could or should be based on historical precedence. On the topic of public participation, although Mr. Weidner is correct that the public isn’t as active in direct ownership of stocks, an alternative view could be that when and if the public does get involved, usually the late stage in a bull market, the Dow could easily over-shoot on the upside by a wide margin.
In our March 13, 2013 article (found here), we pointed out that the average trading volume has been in a declining trend since June 2, 2009. Our concern was that with the decline in trading volume, indicating a lack of participation by the public, there may be a point at which stocks could not sustain their climb higher. We said the following:
“When the increase in volume arrives, the question then becomes, will there be a dramatic increase or decrease in stock market price? Will the general public’s lack of participation be the catalyst that charges the market to move higher? This situation has to be resolved at some point.”
As time has passed, we’re starting to believe that if the public finally does begin to participate, even on a marginal scale, the stock market could effectively skyrocket.
Contributor C. Cheng Asks:
“What are your concerns regarding the housing bubble forming in Canada and it’s potentially adverse effects on BMO?”
Our Response:
The timeliness of this comment regarding Bank of Montreal (BMO) is critical. On June 7, 2012 (found here), we posted an Investment Observation on Bank of Montreal which was one of our leading considerations as an investment opportunity. Keep in mind that our interest in BMO came after a 14-month declining trend in the stock’s price.
At that time we said the following of BMO:
“We are reticent to recommend any kind of banking institution due to the many unexpected risks that occur outside of the purview of regulators and accountants. However, Bank of Montreal is a reasonable banking investment if bought at the right price. We believe that the right price begins at $51.80 and below.”
Unfortunately, BMO never fell below $51.80. In fact, the day that were did our write up on BMO it only fell below the $53.57 price on the five subsequent trading days immediately afterwards, with the lowest price being $52.15 on June 11, 2012.
At the moment, BMO’s stock price has retested the previous high set in November 2013.
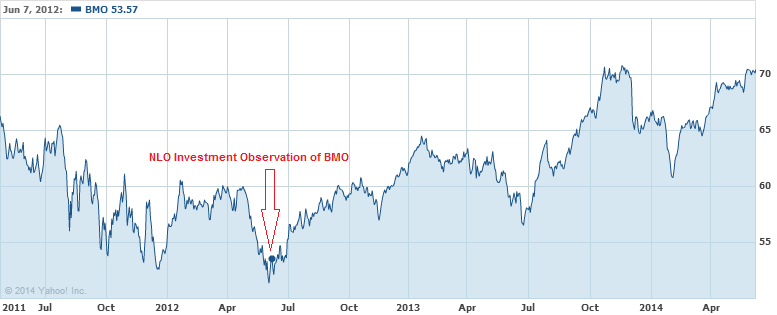
If there is a concern that Canadian real estate is in a bubble then it would be wise to sell only the principal in BMO while leaving the profits to compound. This would eliminate the guesswork associated with determining if there is a bubble. The remaining funds would be allowed to compound at a 5.50% rate until BMO has sustain a similar decline in price from April 2011 to June 2012.
Ask any market participate for their estimated long-term rate of return from equity market and majority of the time they will say 9%-10%. That's a fact most of us know. What market participants may not know is that the average is obtained through big volatility and market never return 10% year in and year out. The nature of the market is to overshoot on the upside as well as the downside.
Let's take a look at the market return of the S&P 500 from the start of its inception in 1957 through 2013. The average return for this time frame is 9% per year. Interestingly, we rarely see returns in the range of 9% plus or minus 3% deviation. Out of 64 years, we saw only 7 instances (11% of the time) when the market registered a return between 6% to 12% (a 3% standard deviation). We'd have to widen the range to 11.2% standard deviation to achieve a 50/50 split. This mean that out of 64 years, the market had a gain/loss between -2% and 20% in 32 years.

What does all of this mean? Simply put, don't expect an average gain, of +10%, from the equity market in the short-term. As the chart shows, market return are nearly random with gains as high as 44% and losses as big as -38%.
Posted in S&P 500, Uncategorized
Contributor C.Cheng says:
“According to Morningstar, ‘increased competition from rivals such as Wal-Mart, Costco, and Amazon is an ongoing threat to Target's share of domestic retail sales.’ Furthermore, Target's expansion into Canada proved to be bumpier than predicted and they will probably not meet their projected targets. What are your concerns regarding these developments?
“Over the course of the past year, Target has reached its 52-week low and is currently hovering near it. Do you think this is a temporary development or an indication of a fundamental issue with the company? (found here)”
Our Response:
The primary concern seems to be how long Target can suffer from bad execution or will the company continue to spiral down. The mention of Wal-Mart (WMT) reminds us of a previous review we did of the stock. On June 8, 2009 (found here), we had the following to say of Wal-Mart:
“The price pattern [not increasing in value] on Wal-Mart reflects a concern by investors, starting in 2000, that the consumer economy was going to be in trouble. If the price goes above $70 or goes below $45 then we'll have some advanced warning about what may be around the corner for the U.S. and Chinese economy. Seems that this company is a leading or more reliable indicator (for the time being).
“In general, Wal-Mart's stock is not being recognized for the simple fact that the company can generate positive earnings. Although WMT's debt really bothers me, company management may be clever like a fox by amassing huge amounts of debt now to be paid off later with inflated dollars.”
Many investors were disappointed about the fact that for nearly 10 years, from 1999 to 2009, Wal-Mart’s stock price traded in a range from $40 to $65. This is an example of the risk that a retailer like Target (TGT) might face, trading in a range for an extended period of time.
However, the premise of the 2009 Wal-Mart article was that if, over an extended period of time, the company can continue to maintain earnings, increase or retain margins, borrow prudently and decrease shares outstanding there is a good chance that value of the company will increase. Not long after the 2009 Wal-Mart article, with the stock trading at $49.84, the shares of WMT broke out of the $65 resistance level and increased to the most recent high of $81.37, an increase of +63%.
Our purpose of tracking stocks that have a history of dividend increases, like Wal-Mart and Target, is to determine values and the competency of management. The decision to increase dividends cannot be sustained over an extended period of time if management is incompetent, perpetuating fraud or willful negligence. When we acquire a stock like Target at depressed levels, we’re indicating that the problems faced by the company, although a current drag on the stock price, will be resolved in due time. Keep in mind that downside risks should always be a consideration.
A secondary concern that is worth addressing is the source of analyst reviews and the quality of such reviews. For example, Deutsche Bank Markets Research provided this analysis of an investment downgrade of Target on July 12, 2013, within 2 weeks of the top ($73.50) in the stock price on July 24, 2013.
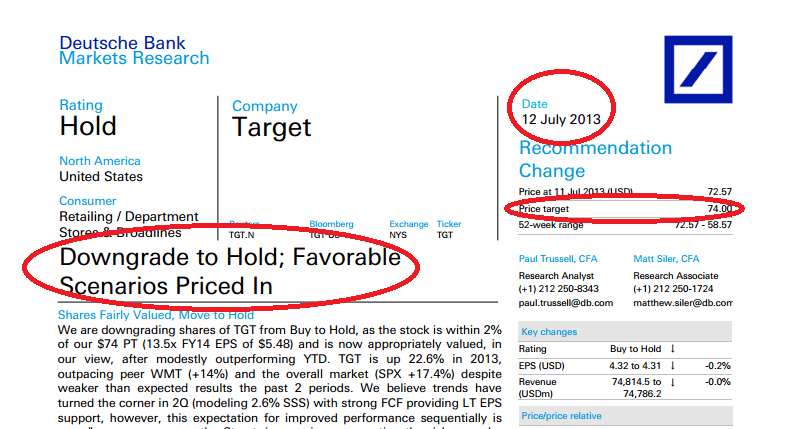
Although DB was not in the position to offer a pure sell recommendation, a failing of most research shops, the downgrade with an upside target that was spot-on indicates the high quality of the research that was done. We recommend you get a copy of this report to see what the risks were, according to DB, in advance of the subsequent decline that had ensued.
Contrast the Deutsche Bank downgrade on July 12, 2013 with the Piper Jaffray review on July 9, 2013 which gave Target the highest rating possible of Overweight, essentially a buy recommendation two weeks before the peak.
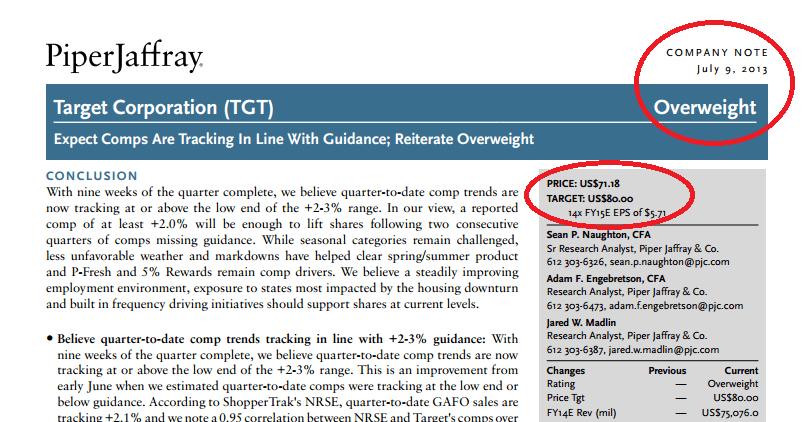
Piper Jaffray essentially gave a buy recommendation of the Target within 4% of the high. Additionally, the stock was expected to increase to $80. This is a report that is worth contrasting to the DB report. We’d eliminate the points that are similar and focus on the differences as the defining piece to the quality of the analysis, in favor of DB.
A challenge with Morningstar reports is that they have a cookie cutter approach that is easy to identify the weaknesses. Below is an excerpt from the Morningstar Report dated July 8, 2011 when Target was trading at what was later to be revealed the low in the stock price from the January 3, 2011 peak.
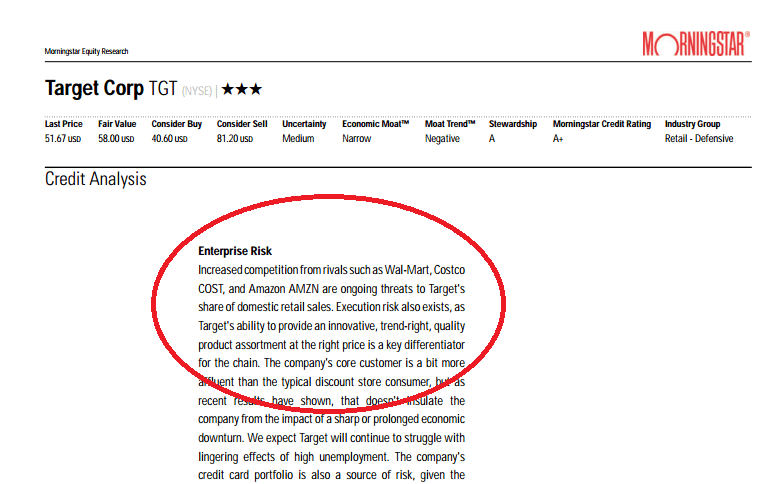
Just to highlight what was said by Morningstar, at the time:
“Increased competition from rivals such as Wal-Mart, Costco, and Amazon are ongoing threats to Target's share of domestic retail sales.”
It appears that Morningstar’s overall risk analysis does not change whether at a low in the price or at a high. Because this was a general risk assessment we wouldn’t put much emphasis on this particular warning on the stock. However, the most informative assessment of risk within a Morningstar report is usually the section titled “Bulls Say” and “Bears Say”.
Although normally a good summary of both sides of the matter, the case for and against Target, as made in the Morningstar report dated May 27, 2014 are essentially offsetting points as the “Bull Says” section indicates, “PFresh and REDcard should help to drive store traffic, delivering enough expense leverage to offset the negative impact on gross margins from those initiatives.” While the “Bear Says” section suggests, “Target's ROICs have declined since the PFresh initiative transitioned a larger portion of assets to lower-return food business.” Usually, this section is better at outlining the risks and potential benefits of ownership of the stock. For Target it wasn’t particularly enlightening.
Our own recommendation of Target on June 24, 2011 (found here), at the low, was as follows:
“Target (TGT) landed in the third spot after Fitch cut its debt rating. They’ve taken the rating down from A to A- on claims that Target is aggressively buying back its own shares and remodeling stores in Canada. We’ve said it before that shares of Target look attractive at a 2% yield but it’s even more attractive at a 2.59% yield. This yield boost was because the company raised its dividend by 20%, from $0.25 to $0.30 per share. Once again, IQTrend has estimated that Target is a good buy when it reaches a 1% yield.”
We believe that understanding the downside risks are vital to the success of any investment that is ever made. Additionally, the quality and consistency of such assessments should line up a majority of the time. In the particular case of Target, the risks are still out there, however, we believe that the history of the company’s management team ensures that the problems are being addressed which may include taking the losses by closing the Canadian stores and cutting or leaving the dividend unchanged.
Top Five Watch List Performance Review
In our ongoing review of the NLO Dividend Watch List, we have taken the top five stocks on our list from June 7, 2013 and have checked the performance one year later. The top five companies on that list can be seen in the table below.
| Symbol | Name | 2013 Price | 2014 Price | % change |
| CTWS | Connecticut Water Service | 28.36 | 32.52 | 14.7% |
| NWN | Northwest Natural Gas | 43.13 | 45.93 | 6.5% |
| SO | Southern Company | 44.44 | 43.89 | -1.2% |
| ED | Consolidated Edison | 57.43 | 55.23 | -3.8% |
| PPL | PP&L Corporation | 29.29 | 34.66 | 18.3% |
| Average | 6.9% | |||
| DJI | Dow Jones Industrial | 15,248.12 | 16,924.28 | 11.0% |
| SPX | S&P 500 | 1,643.38 | 1,949.44 | 18.6% |
All of the top five companies are utility companies and we kept pounding the table on the fact that they are likely to underperform in the rising rate environment. However, we did point out one company that standout in our view which was Caterpillar (CAT). We stated the following last year:
Caterpillar’s (CAT) target price was lowered by Goldman Sachs from $100 to $97. The analyst cut sales forecast by -7% in 2013-2015 because of mixed outlook in the mining machinery market. Valueline Investment Survey estimates that Caterpillar trades at 8x cash flow while the company expects their cash flow per share to be $10.90 in 2013. This means the company might be fairly valued at the current price. Our valuation model, however, placed CAT fair value at $100 which implies a +20% upside.
The stock last traded at $108 which equate to 27.8% gain based on the price from the list.
U.S. Dividend Watch List: June 6, 2014
The S&P 500 is only 2.5% shy of the 2,000 mark. At the current run rate, we might achieve that by the end of the coming week. Below are 30 companies on our list. Continue reading
Gold Stock Indicator Review
On June 7, 2013 (found here), we said the following of gold and gold stocks:
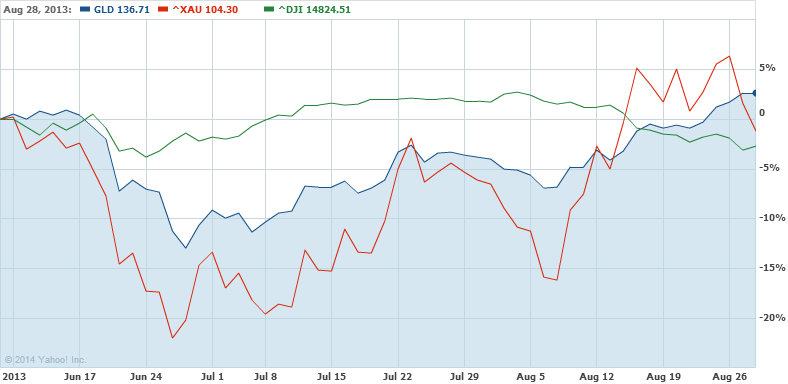
“…the pattern has typically been that when the stock market swoons, so does gold stocks and to a greater degree. If the Dow Jones Industrial Average cannot maintain the current level gold stocks will decline massively.”
For a brief moment, from June 7, 2013 to June 24, 2013, the Dow Jones Industrial Average declined approximately –3.5%. In the same period of time, the price of gold declined –13% while the XAU gold stock index declined –22%.
On the whole, precious metals investors need to etch the following comments from Charles H. Dow into their mind:
“For the past 25 years the commodity market and the stock market have moved almost exactly together. The index number representing many commodities rose from 88 in 1878 to 120 in 1881. It dropped back to 90 in 1885, rose to 95 in 1891, dropped back to 73 in 1896, and recovered to 90 in 1900. Furthermore, index numbers kept in Europe and applied to quite different commodities had almost exactly the same movement in the same time. It is not necessary to say to anyone familiar with the course of the stock market that this has been exactly the course of stocks in the same period ( source: Dow, Charles. Review and Outlook. Wall Street Journal.February 21, 1901.)”
When Charles Dow speaks of commodities, gold and silver should be included in the category. Accepting this reasoning will provide precious metal investors with the necessary risk planning thought process, hopefully before investing in the sector. Even if the decline in the Dow Industrials does not lead to the decline in gold stocks in every instance, it is better to be prepared for an outcome that occurs a majority of the time.
At the time, our Gold Stock Indicator had the following trend:

Our GSI was at the “stage 3 buy” level and it looked like the upside resistance was to the “stage 2 buy” level. However, we did hold out the possibility that the “stage 4 buy” signal was still on the horizon. The “stage 4 buy” level was indicated on June 26, 2013 in our posting titled “Gold Stock Indicator: Now Is the Time” (found here).
Gold Stock Indicator: June 6, 2014
The Coppock Curve is one of the technical indicators that we focus on for long-term buy signals for the stock market. The Coppock Curve is only useful as a BUY indicator when the chart goes from positive territory to the negative territory then turns decidedly upward. As previously indicated, the Coppock Curve does not provide SELL signals in any way.
Once the signal turns upward (while in the negative territory), investors should consider buying stocks at the beginning of the month. Our last “buy” indication came at the end of April 2009. Anyone who purchased the Dow Jones Industrial ETF (DIA) on the first trading day of May 2009, they would have gained +104% in the process (based on the closing price of May 2014).
Top Five Watch List Performance Review
In our ongoing review of the NLO Dividend Watch List, we have taken the top five stocks on our list from May 31, 2013 and have checked the performance one year later. The top five companies on that list can be seen in the table below.
| Symbol | Name | 2013 Price | 2014 Price | % change |
| CTWS | Connecticut Water Service | 28.37 | 32.07 | 13.0% |
| NWN | Northwest Natural Gas | 42.73 | 45.27 | 5.9% |
| SO | Southern Company | 43.90 | 43.78 | -0.3% |
| FRS | Frisch's Restaurants, Inc | 16.73 | 23.31 | 39.3% |
| ED | Consolidated Edison | 57.07 | 55.01 | -3.6% |
| Average | 10.9% | |||
| DJI | Dow Jones Industrial | 15,115.57 | 16,717.17 | 10.6% |
| SPX | S&P 500 | 1,630.74 | 1,923.57 | 18.0% |
Four of the top five companies on the last year’s list are utility companies. We believe strongly that under the rising interest rate environment, these companies will face tremendous headwind. Last year, we stated the following:
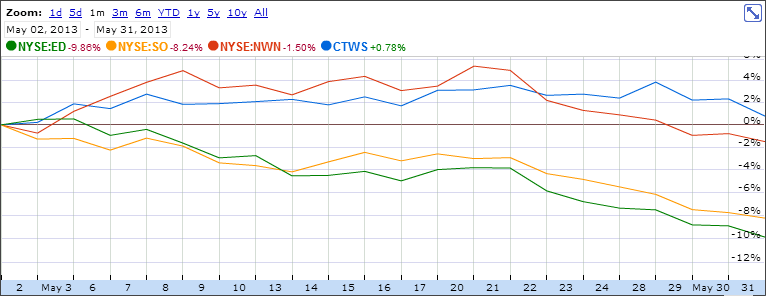
Last week we wrote a short commentary (here) on utility companies and low interest rate environments. Four of the top five companies on our list are utilities. Connecticut Water (CTWS), Northwest Natural Gas (NWN), Southern Company (SO), and Consolidated Edison (ED) should be assessed with the view that if interest rate rise, their margins can shrink dramatically. Since the beginning of May, we’ve seen 10-year yields rise by 50 basis points (from 1.66% to 2.16%). Below is the performance of these four companies in May. We can’t draw to many conclusions or direct correlations that interest rate are the reason that caused the stocks to underperformed…yet.
The best performing company on our list was Carbo Ceramics (CRR). which gained 108%. Ironically, the company was of heavy interest to us because of our position in the stock. Below are our commentary about Carbo Ceramics.
Another company we’d like to highlight is Carbo Ceramics (CRR). The stock has experienced tremendous move rising from $64, when we took position late last year (here), to peak out at $97. It took the stock 8 months to rise 49% but less than 2 months to give it all back. The stock now trades at $65.90. It is worth noting that we wrote a follow up commentary on our action of buying and selling the stock (here). Our risk averse and conservative approached was the reason we avoided such a collapse in price and may be looking to accumulate shares again at the current level.
U.S. Dividend Watch List: May 30, 2014
The market (S&P 500) has achieved its all-time high on Friday. Despite such strong action in the market, companies in our database continue to lag the market. By the end of the week, there are 49 companies on our list. Continue reading