Author Archives: nlo-admin

U.S. Dividend Watch List: January 10, 2014

Watch List Performance Review

In our ongoing review of the NLO Dividend Watch List, we have taken the top five stocks on our list from January 11, 2013 (found here) and have checked their performance one year later. The top five companies on that list can be seen in the table below.

Symbol Name 2013 Price 2014 Price % change
MSFT Microsoft Corporation 26.83 36.04 34.3%
NJR New Jersey Resources Corp. 39.53 45.97 16.3%
WEYS Weyco Group 22.76 28.63 25.8%
FDS FactSet Research Systems 88.87 106.81 20.2%
ED Consolidated Edison 55.91 54.33 -2.8%
      Average 18.8%
         
DJI Dow Jones Industrial 13,488.40 16,437.05 21.9%
SPX S&P 500 1,472.05 1,842.37 25.2%

01-10-2014

Our top five performed well considering the lagging utility sector.  However, we did anticipate that this would occur since rates started to rise last year with the following commentary:

"Utility companies have been the lagging industry and this week is no exception.  Two companies remained in the top five, New Jersey Resources (NJR) and Consolidated Edison (ED).  Both companies yield exceed 4% but payout ratio is somewhat elevated at more than 60%.  A surge in interest rates could significantly affect the short-term prospects of companies in the utility sector."

Microsoft (MSFT) performed as anticipated when we gave the following analysis:

"Technically, MSFT has been range bound between $26.50 to $27.50 since November.  The bottoming process has begun in our view and as noted in the Nasdaq watch list commentary, we recommend buying in two stages."

What we said about Microsoft (MSFT) turned out to be fair analysis as the stock outperformed the market by a decent margin.

U.S. Dividend Watch List: January 10, 2014

Below are the 27 companies on our U.S. Dividend Watch List that are on our radar.

Continue reading

Nasdaq 100 Watch List: January 10, 2014

Performance Review

Below is the performance of the eight stocks from the January 11, 2013 Nasdaq 100 watch list (found here) compared to the performance of the Nasdaq 100 Index.

Symbol
Name 2013 2014 % change
MSFT Microsoft Corp 26.83 36.04 34.33%
DLTR Dollar Tree, Inc. 38.12 55.89 46.62%
BBBY Bed Bath & Beyond 56.27 69.94 24.29%
TEVA Teva Pharmaceutical 38.06 41.87 10.01%
VOD Vodafone Group  26.59 38.69 45.51%
PAYX Paychex, Inc. 31.78 44.37 39.62%
NVDA NVIDIA Corporation 12.21 15.73 28.83%
CA CA Technologies 23.34 34.02 45.76%
34.37%
^NDX NASDAQ-100 2,748.26 3565.08 29.72%

image

On average, the watch list from last year gained +34.37%.  This is contrasted with the Nasdaq 100 gaining an average of +29.37%.  Of the top five stocks on our list, only Teva Pharmaceutical (TEVA) did not exceed the performance of the Nasdaq 100 throughout the year.  Additionally, Bed Bath and Beyond (BBBY) outpaced the Nasdaq 100 until recently.  Dollar Tree (DLTR) registered the best performance for the entire list even though the stock is down –7.35% from the November peak.

January 10, 2014 Nasdaq 100 Watch List

Below are the six Nasdaq 100 companies that are on our radar with the analyst estimates of downside risk for the coming year.

Gold Stock Indicator: January 10, 2014

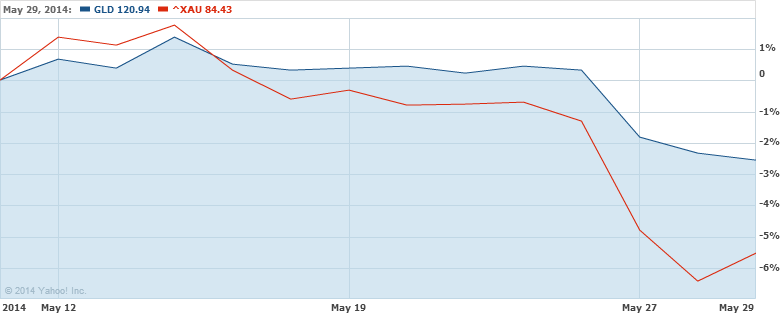
Gold and gold stocks, based on the Philadelphia Gold & Silver Index, was unchanged for the week.

Continue reading

Transaction Alert

On January 8, 2014, we carried out the following transaction(s):

Transaction Alert

On January 7, 2014, we carried out the following transaction(s):

Continue reading

U.S. Dividend Watch List: January 3, 2014

Below are the 23 companies on our U.S. Dividend Watch List that are on our radar. Stocks that appear on our watch lists are not recommendations to buy. Instead, they are the starting point for doing your research and determining the best company to buy. Ideally, a stock that is purchased from this list is done after a considerable decline in the price and rigorous due diligence.

Continue reading

Gold Stock Indicator: January 3, 2014

This week, gold increased +1.70% while gold stocks, as represented by the Philadelphia Gold and Silver Index (XAU), increased +3.61%. Our Gold Stock Indicator (GSI), is indicated in the chart below:

Continue reading

Transaction Alert

On January 2, 2014, we carried out the following three transactions:

2013 Performance Review

Below is a chart of how our investment portfolio performed against the S&P 500 index and the 30-year Treasury based on the January 3, 2013 rate (found here).

image

Our portfolio exceeded the guaranteed rate (30-yr treasury) by almost six times.  However, the S&P 500 exceeded our 2013 return by nearly double.

Below is the cumulative performance of our investment strategy since 2006 when we codified our investment approach in the last quarter of 2005.  We have compared our performance to the indexes indicated, based on $10,000 invested over the subsequent period of time.

Year
Dow Indu. $10,000.00 S&P 500 $10,000.00 Nasdaq $10,000.00 NLO $10,000.00
2006 16.29% $11,629.00 15.74% $11,574.00 9.52% $10,952.00 18.30% $11,830.00
2007 6.43% $12,376.74 5.46% $12,205.94 9.81% $12,026.39 19.80% $14,172.34
2008 -33.84% $8,188.45 -37.22% $7,662.89 -40.54% $7,150.89 14.35% $16,206.07
2009 18.82% $9,729.52 27.11% 9,740.30  43.89% $10,289.42 36.65% $22,145.60
2010 11.02% $10,801.71 14.32% $11,135.11 16.91% $12,029.36 7.14% $23,726.79
2011 5.53% $11,399.05 0.00% $11,135.11 -1.80% $11,812.83 6.20% $25,197.85
2012 7.26% $12,226.62 16.20% $12,939.00 15.91% $13,692.25 7.80% $27,163.28

2013 26.50% $15,466.67 31.90% $17,066.54 38.30% $18,936.38 19.00% $32,324.30

Gold Stock Indicator: December 29, 2013

This week, gold increased +1.54% while gold stocks, as represented by the Philadelphia Gold and Silver Index (XAU), increased +4.56%. Our Gold Stock Indicator (GSI), is indicated in the chart below:

Continue reading

U.S. Dividend Watch List: December 27, 2013

Below are the 18 companies on our U.S. Dividend Watch List that are on our radar. Stocks that appear on our watch lists are not recommendations to buy. Instead, they are the starting point for doing your research and determining the best company to buy. Ideally, a stock that is purchased from this list is done after a considerable decline in the price and rigorous due diligence.

Continue reading

Canadian Dividend Watch List: December 27, 2013

This is a list of Canadian dividend stocks that are currently on our radar. For those wishing to find the most complete fundamental information on these companies, we recommend visiting one of Canada’s leading financial websites, the Financial Post (found here). However, Yahoo!Finance probably has the better long-term charts and historical dividend data.

Continue reading

U.S. Dividend Watch List: December 20, 2013

Below are the 21 companies on our U.S. Dividend Watch List that are on our radar. Stocks that appear on our watch lists are not recommendations to buy. Instead, they are the starting point for doing your research and determining the best company to buy. Ideally, a stock that is purchased from this list is done after a considerable decline in the price and rigorous due diligence.

Continue reading

Gold Stock Indicator: December 20, 2013

Bitcoin: Downside and Upside Targets

On November 19, 2013, we provided our best estimates of what the downside and upside targets were for Bitcoin (found here).  In our assessment, we said the following:

“Our conservative downside target for Bitcoin, based on the peak closing price of $785.50 is $384.83.  The extreme downside target is $261.83.  The worst case scenario is for Bitcoin to fall as low as $152.83 as indicated by the red line on the chart.

As we’ve written many pieces on the topic of Edson Gould’s Speed Resistance Line, we’ve made some observations that we think should be highlighted at this time.  For the first time, we’re going to provide what we believe might be an upside target.  In the case of Bitcoin, the next conservative upside target is $1,154.49 if the most recent peak of $785.50 is exceeded.  This is a tentative estimate based on observations of the many successful downside SRLs that we have run in the past.  We’ll be on the lookout for what may come next.”

The most updated Bitcoin chart demonstrates the value of Edson Gould’s Speed Resistance Lines’ ability to give informed estimates of upside and downside targets.  In the case of Bitcoin, The upside target was achieved and exceeded by 7.23%.  After achieving the upside target, Bitcoin has declined from the recent peak of $1237.96 down to the conservative downside target of $535.65.  The conservative downside target is based on the updated peak in the price for Bitcoin using the guidelines for Gould’s Speed Resistance Lines.

image

With the conservative downside target being achieved, the extreme downside target of $412.65 and the worst case level of $152.83 are all that remains.  However, in the last 24 hours, Bitcoin has declined as low as $455.  This suggests there there could be a significant appreciation from the current level as the conservative downside target has been achieved.  Our revised upside target is now $1,606.95.

Those willing accept the extreme volatility and political risk should seriously consider Bitcoin at or below the $412.65 ascending line with a willingness to see a decline of –62.96%.