There aren’t many who are convinced that the recession ended in June 2009 and that the jobs numbers are real, as opposed to contrived. Most investors believe that the economy is still in a recession, which has been masked by Federal Reserve stimulus and that positive jobs data is strictly a ploy by politicians to hold on to whatever perceived powers that they have.
Our take on these topics is most accurately reflected in several articles that we wrote in real time with unflinching candor and little care for conspiracy theories. On the matter of Federal Reserve stimulus being the reason the stock market rose, we have said the following:
“…those that claim ‘this time is different’ aren’t trying hard enough to prove their claim false. A cursory review of market data during the periods from 1860 to 1914 makes it clear that declines of nearly -50% or more are likely to retrace +66% to +100% of prior declines. This pattern has been easily demonstrated in the periods after 1914. However, we’re only trying to illustrate that the acceptance of the Federal Reserve’s role as the leading cause of the current +69% retracement of the prior decline (2007-2009) is false (January 19, 2011).”
The above point was reiterated in our more detailed revision to the same article on February 17, 2014. On the topic of the recession and its end, we have not minced words about the prospects. Additionally, we have steered away from the belief that the economy, if in recovery, should exhibit a low unemployment rate similar that of the booming economy of 2006/2007, which was built on excess in many sectors.
On August 21, 2009 (found here), we said the following about the recession:
“Implicit in my discussion of the IPI is that we are at a turning point for the economy. Based on the combination of the Dow Theory confirmation of July 23, 2009 and the IPI turning up from the June low, I will have to guess that the National Bureau of Economic Research (NBER) is going to proclaim June 2009 as the official end to the recession. The end to this recession will be lackluster and questioned from all corners. Additionally, the stock market will only follow the pattern of a cyclical bull market (bear market rally) within a secular (long term) bear market.
“I doubt that the general public will agree that the recession is over since jobs will not be as plentiful as the past. However, from the standpoint of an economist the recession is over provided the IPI June low is sustained over an extended period of time.”
We were 13 months ahead of the National Bureau of Economic Research (NBER) on our call that June 2009 would be considered the end of the recession, based on what the NBER looks at (NBER announces end to recession on September 20, 2010).
What is the connection between calling an end to the recession in real time and our work on the topic of the unemployment rate? First, we are using data reported by the government that is frequently revised. Second, we apply Dow Theory to arrive at what we believe to be reasonable estimates of future trends. Do we always fall for our voodoo economics? We hope not, however, Robert Rhea’s book Dow Theory Applied to Business and Banking suggests that Dow Theory has a broader application than simply stock indexes.
On July 26, 3013 (found here), we said the following of the Unemployment rate:
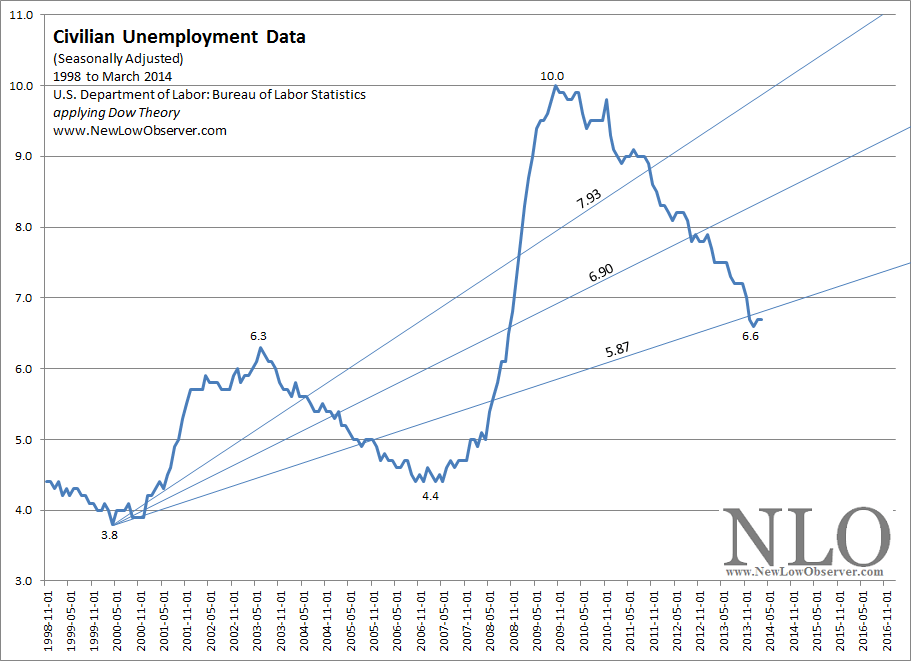
“According to Dow Theory, expectations of how low unemployment should go are far more reasonable without the requirement of a economic boom that is followed by a bust. According to the chart of unemployment below, the most realistic scenario for how low the unemployment rate could go is 6.9%.
“Applying Dow Theory’s 50% principle suggests that the best we could expect for the unemployment rate, on the downside, is for 6.9%. It is important to understand that the 10% and 3.8% unemployment rates are undesirable scenarios. The 10% unemployment rate is in the depths of a “recession” and the 3.8% unemployment rate at the height of a overextend economic boom.”
What has transpired in the unemployment rate since our July 26th article? Our downside target of a 6.9% unemployment rate has been achieved. Again, we understand the conspiracy talk of the numbers being made up for the purpose of some politician to rally for more votes come election time. However, such arguments are a waste of time. Our view is that we need a detached perspective in order to come up with reasonable estimates.

So what do we make of the above chart? In general, since all downside targets have been met, our next line of reasoning is basically a guess, at best. However, we believe that our prior line of reasoning with a detached view might serve us well in what might come.
One item that stands out is the 2006 to 2007 low of 4.40% unemployment. This was approximately 12% below the ascending Dow Theory downside target of 5.87%. As the current level of unemployment is at or near the same ascending 5.87% level, we have looked at the point where the unemployment first touched the 5.87% line and then calculated 12% below that level as a worst case scenario. Based on this line of reasoning, the next downside target should be 5.90%.
Given our prior experience with Dow Theory and downside projections, any decline in the unemployment rate below 5.87%-5.90% would be exceptional with only the 4.40% and 3.80% levels as mere reflections of an overextended economic boom which should be followed by an equally impressive bust.