A simple flag or pennant formation seems easy to identify. Now it is time to see if the direction of the index will do a retest of the late January 2016 low.


A simple flag or pennant formation seems easy to identify. Now it is time to see if the direction of the index will do a retest of the late January 2016 low.
Posted in Shanghai Composite Index
It was another good week for the bulls as the S&P 500 rose more than +1%. As such, the year-to-date gain on the index sits slightly below +6%. This bull market continues to drag along and the only thing left is to break the all-time high back in August 2016. For investors looking for quality companies and a good margin of safety, please review our watch list below. Continue reading
Posted in Dividend Achiever Watch List, Dividend Achievers, Dividend Watch List
Tagged members
For anyone following the Shanghai Composite Index, we appear to be on the cusp of a significant change in the Index. Below is what we believe to be a “flag” or “pennant” formation that is about to come to a conclusion. First, let’s address what a “flag” or “pennant” formation is from the most credible source on technical analysis.
“A Flag looks like a flag on the chart. That is, it does if it appears in an up trend; the picture is naturally turned upside down in a down trend. It might be described as a small, compact parallelogram of price fluctuations, or tilted rectangle, which slopes back moderately against the prevailing trend (Robert Edwards & John Magee. Technical Analysis of Stock Trends. International Technical Analysis Publishers, Boston. 1991 edition. page 202).”
Additionally, Edwards and Magee said the following of this consolidation pattern:
“These pretty little patterns of consolidation are justly regarded as among the most dependable of chart formations, both as to directional and measuring indications. They do fail occasionally but almost never without giving warning before the pattern itself is completed (Robert Edwards & John Magee. Technical Analysis of Stock Trends. International Technical Analysis Publishers, Boston. 1991 edition. page 211)."
Posted in Shanghai Composite Index
Below are the downside targets for the Hanover Insurance Group (THG) and the recommended levels to start your research and possible acquisition of the stock.
Below are the downside targets for Just Energy (JE.TO).
Bird Construction (BDT.TO) has the following downside targets:
Enghouse Systems (ESL.TO) has the following downside targets:
Performance Review
Below are the actual returns compared to the analyst estimates for the stocks from our Canadian Dividend Watch List dated September 2015.
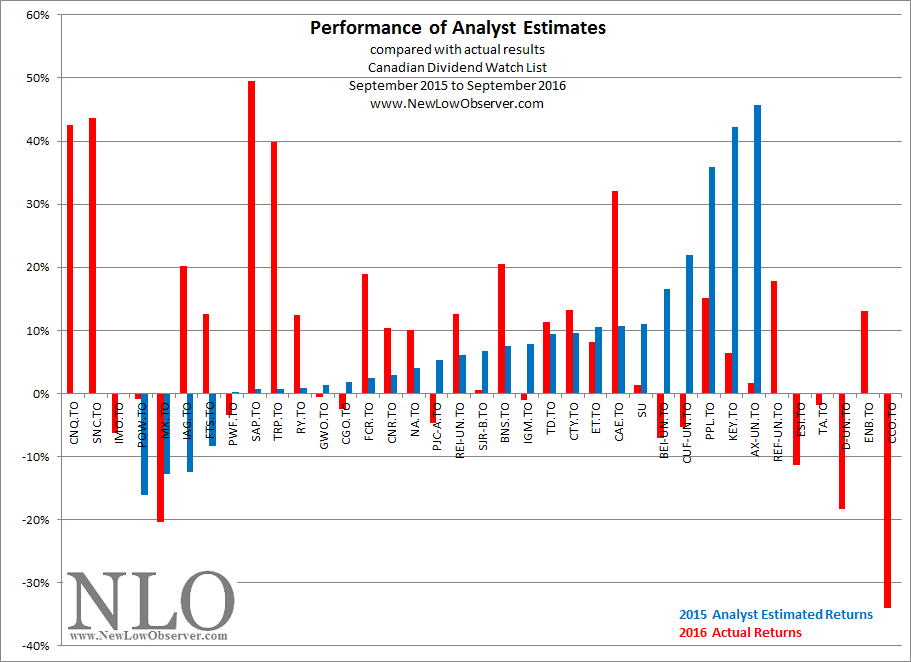
At the time, We said the following of the stocks on the list:
“CNQ.TO, SNC.TO and IMO.TO are expected by the analysts to suffer greatly in the coming year. We think that the opposite will be true. Analyst expectations for companies on the far right side of the above table will not come near the triple digit and above estimates.”
Based on the performance one year later, CNQ.TO, SNC.TO and IMO.TO averaged a gain of +26.60%. The stocks slated to gain triple digits averaged a loss of –5.75%. In the last year, the Toronto Stock Exchange has increased +5.84%.
Below is our watch list and analyst projections.
Stock markets have a way of doing their own thing. One of those “things” is fighting the forces of manipulation in the long run. Once such example is the Shanghai Composite Index. Last year it was claimed by many analysts that the Shanghai index would be propped because the government is too highly vested to allow a significant decline. On July 8, 2015, we said the following of the downside risks to the Shanghai Index:
“There is more downside risk if there continues to be restrictions on selling. SSE's next downside target is 2,867. Should see a bounce around that level.”
“Only two downside targets left 2,867 and 1,722. With all the rules killing liquidity, the greater the chance for falling to these levels.”
Since that time, the Shanghai Index declined to the anticipated 2,867 level then rebounded and then declined further. Below is the updated SRL for the Shanghai Composite Index and our recommendation for the upcoming targets.
On September 16, 1970, Richard Russell had the following to say about Elliot Wave Theory:
"Last week I received a letter from a gentleman at a large New York Bank, and the letter raises on important question which deserves answering here. He writes:
'I have been particularly interested in your comments to the effect that we now have seen two of the three major declines that mark a primary bear market. Referring to the chart on Page 4 of your Letter No. 469, two major slides are quite noticeable (one in 1966 and the other in 1969-70). However, there is a third slide (in late 1967 and early 1968) that is very clear in the Transportation Average but not so noticeable in the other two averages. From your letters, it is clear that you do not regard this as one of the three major phases of the primary bear market; however, I would like to hear some more of your reasoning as to why it does not qualify.'
"Now I believe this gentlemen is expressing a common misconception, a misconception which stems from a confusion between Dow Theory and the Elliot Wave Theory. Let me attempt to clarify. Elliot (writing in the 1930’s) believed that bull movements occurred in a five-step series of upward zig-zags, three rising waves and two declining wave-corrections. He believed that bear movements occurred in a three-step downward zig-zag, two declining waves separated by a single corrective rising wave.
"The fact is that Elliot’s observations regarding the wave theory have been born out so many times in actual practice that they must be taken seriously. The problem is that most amateurs do not know how to break the waves down correctly. Each Elliot wave may break down into many sub-waves, and a mere glance at a chart and a cursory dividing of a structure into three-wave and five-wave patterns is usually so far from a true Elliot analysis as to be more deceptive than useful.
"Hamilton Bolton (founder of the Bank Credit Analyst) did some remarkable work on Elliot, and Bolton’s research and interpretations have been carried on by the present editor, Donald Storey. Storey believes that the first wave of the current bear market started for the Dow Industrials in February, 1966. The first wave ended at the October, 1966 lows The second wave (and this was the major corrective wave) carried to either the December, 1968 peak or possibly the May, 1969 peak. From there the third leg (which was again a downward leg) began, and Storey believes we are continuing in that leg now. He feels that this leg will ultimately approach or break the 1970 lows, going perhaps as low as the 1962 Dow low (535) or the 1956 and 1957 peaks (520)[Russell, Richard. Dow Theory Letters. September 16, 1970. Letter 473 page 3.]."
The price action of the Dow Jones Industrial Average from September 1970 and the following years is potentially instructive and presented below.
Posted in Elliott Wave, wave theory
On December 9, 2010, we wrote an article titled “Real Estate: The Verdict Is In”. At the time, we said the following:
“As we come to the close of 2010, it appears that based on the narrow scope of sources that we’ve selected, the bottom in real estate has come and gone.”
Since that time, the real estate market has experienced what we’d consider to be a recovery. This is a follow-up on the indicators from that 2010 article to see how far along we have come in the current recovery and where we might expect the market to go from here.
Posted in cycle analysis, real estate, Wenzlick
The Dow Jones Industrial Average Altimeter from 1920 to the present is posted below.
Below are the price projections based on analyst earnings estimates for our recent U.S. Dividend Watch List dated September 9, 2016. These estimates project the price change for the respective stocks over the next 12 months and the risk profiles associated with the estimates.
The S&P 500 lost nearly -2% for the week. While the drop on Friday appears to be dramatic (at -2.43%), the market is only about 3% off the all-time high. This is a great opportunity, in our view, to start building your personal watch list. Below are 17 companies on our dividend watch list. Continue reading
Posted in Dividend Achiever Watch List, Dividend Achievers, Dividend Watch List
Tagged members
Below are the downside targets for the Dow Jones Industrial Average applying Dow’s Theory and the Dow Jones Transportation Average applying Edson Gould’s Speed Resistance Lines.
Posted in 50% principle, Dow Fair Value, Dow Industrials, Dow Transports, downside
Tagged members