Author Archives: nlo-admin

U.S. Dividend Watch List: May 27, 2016

Previous Year Performance Review

In our ongoing review of the NLO Dividend Watch List, we have taken the top five stocks on our list from May 29, 2015 and have checked the performance one year later. The top five companies on that list can be seen in the table below.

Symbol Name 2013 Price 2014 Price % change
NSC Norfolk Southern Corporation 92.00 84.00 -8.7%
HOG Harley-Davidson Inc 53.49 45.53 -14.9%
PG Procter & Gamble 78.39 81.43 3.9%
UBA Urstadt Biddle Properties Inc 20.12 21.00 4.4%
MGRC McGrath RentCorp. 30.44 28.41 -6.7%
      Average -4.4%
         
DJI Dow Jones Industrial 18,126.12 17,873.22 -1.4%
SPX S&P 500 2,120.79 2,099.06 -1.0%

The average loss for the top five companies was -4.4%. The largest loss came from Harley-Davidson (HOG) while the biggest gain was Urstadt Biddle Properties (UBA). It is interesting to revisit our watch list and see that Harley-Davidson was part of the 10 companies added to Goldman Sachs basket of dividend paying companies. With shares down nearly -15% accompanied by a dividend hike of 13%, Goldman should really load up on Harley-Davidson. The current dividend at 3.1% with low payout ratio of 37% is rather compelling. Shares are also trading at 12x which is a deep discount to the market.

One company we touched on briefly that did relatively well was Procter & Gamble (PG). This blue-chip company managed to rise +4% excluding dividends for the year. We said that the stock is always worth considering at or near the yearly low. Not surprisingly, PG hiked its dividend to maintain its Dividend Achiever and Aristocrat rank. However, the hike of 1% isn't anything income investor would necessarily cheer for. Using this as a proxy, we believe that PG may face difficult consumer market in the months ahead.

U.S. Dividend Watch List: May 27, 2016

It was a good week for the market with the S&P 500 rising more than +2%. Year-to-date, the market is up +2.7%. By the end of the week, there are 18 companies on our dividend watch list. Continue reading

Insurance Watch List: May 2016

Performance Review

Below is the performance of the stocks listed on our watch list dated May 2015:

symbol Name 2015 2016 % chg
GLRE Greenlight Capital Re, Ltd. 30.24 20.40 -32.54%
PNX The Phoenix Companies Inc. 33.30 36.93 10.90%
CRD-B Crawford & Company 8.25 8.23 -0.24%
ACE ACE Limited 107.63 137.79 28.02%
RNR RenaissanceRe Holdings Ltd. 103.09 114.93 11.49%
BRO Brown & Brown Inc. 31.85 35.74 12.21%
      Average 4.97%

Ace Limited gains are estimates based on the stock price change since the acquisition of Chubb Limited (CB).  Ace Limited changed its name to Chubb and assumed the same stock symbol.

Market Outlook

On our watch list summary dated May 1, 2015, we said the following:

“Is the U.S. insurance sector running out of gas?  By the looks of the chart below, all indications are that the glorious run from the 2009 low may be over.  The iShares US Insurance ETF (IAK) seems to be running out of steam just as it approaches the previous high set in 2007.  A breakout to the upside is possible but not before taking a break to the downside.”

Since May 2015, the iShares US Insurance ETF (IAK) has traded in a range with some downside action and very little upside movement.

image

American insurers are making a nice recovery higher from the lows set in mid-February 2016.  However, looming ahead is the double top indicated at points A and B on the chart.  Failure to exceed these points could result in a decline below the February 2016 low.  Alternatively, a breakout to the upside could be especially profitable for investors. 

What is an investor to do under these circumstances?  It is worth noting that last year we said there was considerable risk of decline in the insurance sector, however, we also bought a couple of American insurance stocks.  both of those stock did exceptionally well relative to IAK, garnering gains of more that +20% each, relative to the IAK gain of +5%.

Continue reading

Transaction Alert

The NLO team executed the following transaction(s):

Continue reading

Canadian Dividend Watch List: May 2016

Performance Review

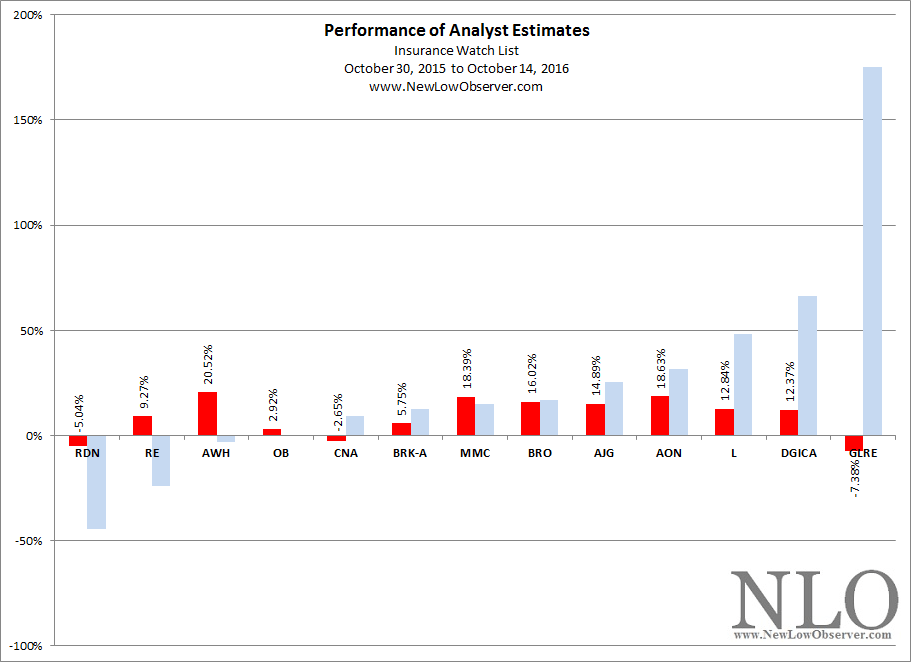
Below is the performance of the stocks found on our watch list from last year compared to what analysts projected the stocks would do.

image

analyst estimate in red, actual performance in blue

The first five stocks found on the watch list lost an average of –4.38% compared to the entire list which averaged a decline of –2.44%.  The performance of the list is contrasted with the –7.73% change with Toronto Stock Exchange.

Continue reading

Herb Greenberg Review: Gems in Frothy Market

On this date in 1996, Herb Greenberg, financial writer for the San Francisco Chronicle, talked about how to find potentially undervalued small-cap stocks in an overvalued stock market.  Greenberg advised investors to review 13-D filings of small-cap stocks where an investor has recently accumulated a position greater than 5%.  This increase in ownership implies that the shares are undervalued.  Naturally, a review of the company fundamentals is necessary before any action can be taken.

The one and only company mentioned by Greenberg in regards to a 13-D filing of 5% or more was Merit Medical Systems (MMSI).  Merit, a maker of disposable products for heart catheterization procedures, has not disappointed since mid-May 1996.  As seen in the chart below, MMSI has outpaced the S&P 500 by 3 times.  It is no small feat to beat the S&P 500 when you consider that MMSI also exceeded Berkshire Hathaway, Intel and IBM in the same period of time.

image

Of course, this is an example that only confirms survivor bias & single sample data, not the most robust assessment.  However, the point remains, in a market that appears overvalued there are still ways to sort small-cap stocks for those who must be in the game.

U.S. Dividend Watch List: May 13, 2016

Performance Review

In our ongoing review of the NLO Dividend Watch List, we have taken the top five stocks on our list from May 15, 2015 and have checked the performance one year later. The top five companies on that list can be seen in the table below.

Symbol Name 2013 Price 2014 Price % change
NSC Norfolk Southern Corporation 97.56 85.97 -11.9%
OTTR Otter Tail Corp. 26.97 29.73 10.2%
CTBI Community Trust BanCorp. 32.18 34.82 8.2%
BKH Black Hills Corp. 47.69 60.44 26.7%
GRC Gorman-Rupp Company 27.04 26.93 -0.4%
      Average 6.6%
         
DJI Dow Jones Industrial 18,272.56 17,535.32 -4.0%
SPX S&P 500 2,122.73 2,046.61 -3.6%

Watch List Review

The average gain from the top five companies was satisfactory. The average gain of 6.6% far exceed the decline in the Dow Jones Industrial and S&P 500. Black Hills (BKH) was the biggest contributor to the success. The South Dakota utility company earning was virtually flat for the year. We are not quite sure what driver pushed the stock higher by more than 25%. The only thing we can think of is the search for yield. Similarly, Otter Tail (OTTR), experienced similar rise in share price. As negative yield spread and the search for income continue, utility sector will be the sector which institutions turn to. This is only our thesis but one can look at Dow Jones Utility Average for confirmation. The index rose 14% while the Industrial fell 3.6%.

The biggest drag to the top five came from Norfolk Southern (NSC) which lost nearly 12% for the year. When shares were trading at $97 last year, we pointed that Value Line estimated fair value of $90 which turned out to be a wise call. Operating in rail industry can be profitable because of the oligopoly nature in the industry. However, it is capital intensive and can be very cyclical. The slow down in the energy sector has a large affect on the rail business.

Tiffany Co. (TIF) was one name we highlighted and took position. The purchase didn't pan out as well as we'd hope for. Originally when we purchased the stock in late April of 2015, shares were trading in the mid 80s. It quickly rose to $95 at the end of July before plunging to the current level. The thesis for this purchase is the brand value and double digit return on equity. Those factors remain in tact and we are evaluating whether additional position should be taken at this level.

U.S. Dividend Watch List: May 13, 2016

It was another volatile week with the S&P rose above 2,080 but closed the week below 2,050. The index lost 0.5% for the week and is virtually flat for the year. Weakness in the market is providing long term investor with more companies to comb through. Below are 24 companies on our dividend watch list for the week. Continue reading

Apple: Fallen and Almost There

On January 8, 2016, we posted the following chart:

image

That red line that says 150 was our projected downside target based on the historical average from as far back as 2004.  The update to this chart is below (Altimeter levels adjusted for dividends):

image

Apple is on the cusp of hitting that downside target.  What happens if the stock breaks through on the downside, then you’d want to consider the investment merit of the stock based on conservative fundamental data.  Keep in mind that the current P/E ratio of 10 should jump before the stock marches higher.

Do you remember that article we posted on September 23, 2012, about how adding Apple (AAPL) to the Dow Industrials would be “not so great”? Yeah, well, since being included into the index on March 19, 2015, Apple has declined –28% and the company that it replaced, AT&T (T), has increased +19%.  True to form, the inclusion of Apple into the Dow Jones Industrial Average coincides with decline in the stock price.  The adjustment period should be coming to an end.  Let’s see how this plays out.

Gold Stock Indicator: May 2016

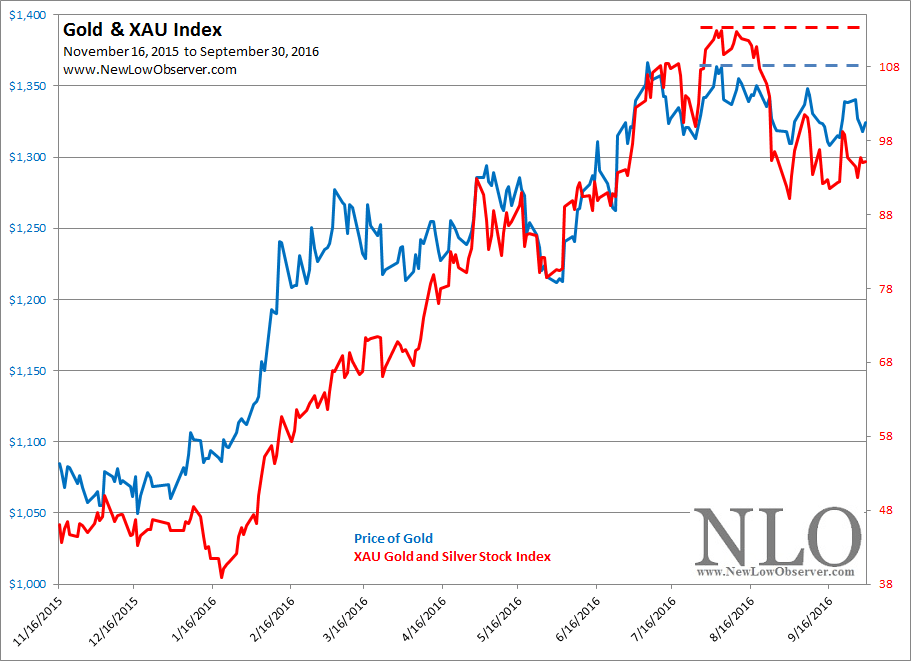
You want higher gold prices? You got higher gold prices.  However, we have to add, be careful what you ask for.  The anxiety associated with what's gonna happen next in gold and gold stocks will have investors and speculators looking over their shoulders.  This will mean many sharp declines and dramatic recoveries.

In the month since our last posting, gold has increased only +6.21% while the price of the Philadelphia Gold & Silver Stock Index (XAU) has increased +26.97% in the same period of time.

image

In our October 3, 2014 posting,  regarding the XAU Index, pointed out the following:

“In the chart above we have labeled the three potential downside targets of 75.99, 67.55 and 59.11 from the current level with the additional downside target of 41.85 as the ‘last stop’ in our downside analysis.  Anything below the ascending 76.32 level is considered undervalued and underappreciated.”

Little could we have known that the index would actually decline to 38.84, a level below the end of the last bear market that ran from 1996 to 2000.  The chart below points to where the current run up could meet significant resistance.

Coppock Curve: April 2016

The Dow Jones Industrial average rose +0.5% in April. After flashing a buy signal the previous month, the indicator turned negative which is a flash signal. We noted that the pattern was similar to the one that occurred in 2001. Although this may be a false signal, we're standing pat on our investments and would continue to allocate additional funds if and when the indicator flags another buy signal. Continue reading

Nasdaq 100 Watch List: April 29, 2016

Performance Review

Below is the performance of the Nasdaq 100 stocks from our April 24, 2015 watch list:

symbol Name 2015 2016 % chg
KLAC KLA-Tencor Corp. 58.89 69.94 18.76%
GRMN Garmin Ltd. 46.19 42.63 -7.71%
FOSL Fossil Group, Inc. 83.75 40.5 -51.64%
FAST Fastenal Co. 41.63 46.79 12.39%
WYNN Wynn Resorts Ltd. 130.09 88.3 -32.12%
SNDK SanDisk Corp. 67.92 75.13 10.62%
NTAP NetApp, Inc. 36.12 23.64 -34.55%
NWSA News Corp. 15.53 12.42 -20.03%
QCOM QUALCOMM Inc. 68.24 50.52 -25.97%

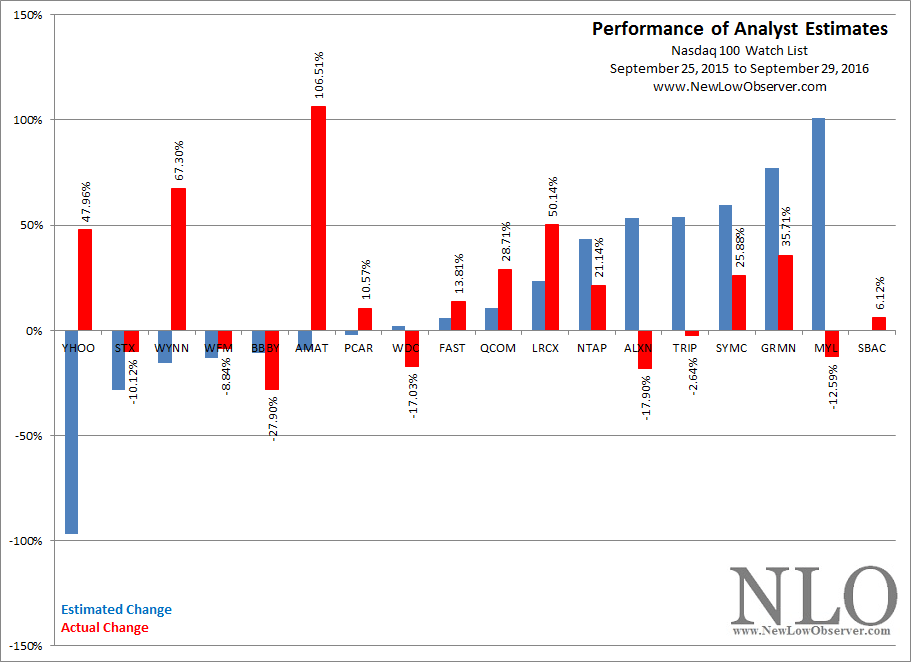
The analyst estimates of one year ago are compared to the actual performance.  As can be seen, 3 of 4 stocks expected to decline did while 2 of 5 stocks rose in price that were anticipated to rise.

image

We mentioned or discussed a few stocks of interest at the time. QCOM and FOSL bombed while SNDK and KLAC exceeded expectations. However, the one stock that stood out the most was regarding NetApp (NTAP).  At the time, we said:

“Investors should remember that with analyst estimates for a +44% gain in the coming year, there is the possibility that expectations are so high that any minor earnings or revenue miss could crater the stock.  In spite of the potential negatives, we think that NTAP could be a takeout target in the next year.”

While there was some talk of NTAP as an acquisition target, the reality was that it was just talk and not much else.  However, the most important issue at the time was proven to be correct, excessive expectations of gains by analysts were met by the most negative divergence in performance.

Nasdaq 100 Watch List

Short Sell Ends Well, Trader Lost Everything

Remember that trader who appealed to the public for assistance after his short sale turned into a -$106K loss overnight?  If you don’t then you could read the full story here

image

The trader had bet that KaloBios (KBIO) would decline in price instead of rise.  Unfortunately, the opposite occurred, putting the trader in the unlikely position of going from a cash positive brokerage account to a deficit of more than -$100,000.

Irony of all ironies, KaloBios Pharmaceuticals ends up filing bankruptcy on December 30, 2015 after Chief Executive Martin Shkreli was arrested for securities fraud.  Below is the price history of KBIO from 2014 to the present.

image

What’s the moral of the story?  Anything can happen and the chasm between entering and exiting a transaction can be wide and deep.  Always prepare for the worst.

Apple Addition to Dow: Unwise and Untimely

On September 24, 2015, we said the following:

“The outperformance of stocks dropped from an index is not as unusual as it would seem.  Typically, index managers tend to drop stocks that appear weak in price performance and going through a transition to resolve the internal issues contributing to their weakness.  At the same time, stocks that are added to an index just coming off a period of exceptional growth and are about to experience a readjustment period resulting in a decline in their stock price.  The result is stocks being added to the index will adjust lower in price while the timing of the companies dropped from the index coincides with a resurgence in earnings surprises and increased stock price.”

So far the conundrum continues as more than one year later the addition of Apple (AAPL) to the Dow Jones Industrial Average has resulted in a decline of –24%.  At the same time, the stock that Apple replaced, AT&T (T), has increased by +16%.

image

Transaction Alert*

The NLO team executed the following transaction(s):

U.S. Dividend Watch List: April 22, 2016

Performance Review

In our ongoing review of the NLO Dividend Watch List, we have taken the top five stocks on our list from April 24, 2015 and have checked the performance one year later. The top five companies on that list can be seen in the table below.

Symbol Name 2013 Price 2014 Price % change
GRC Gorman-Rupp Company 27.99 28.95 3.4%
SAFM Sanderson Farms, Inc. 76.06 87.76 15.4%
TCO Taubman Centers 73.65 69.33 -5.9%
SJI South Jersey Industries 26.85 27.51 2.5%
DCI Donaldson 37.37 33.03 -11.6%
      Average 0.8%
         
DJI Dow Jones Industrial 18,080.14 18,003.75 -0.4%
SPX S&P 500 2,117.69 2,091.58 -1.2%

Watch List Review

The biggest gain came from a company unfamiliar to us, Sanderson Farms (SAFM). A year ago we said that this is a new company which we had no exposure to prior to the watch list. This small cap producer of poultry products had net earnings fall by -42% and yet the stock gained +15%! While one may view this as a disconnect in the fundamentals, another could argue that such expectations were baked into the price. When we published the list last year, shares were trading at $76 with projected net income of $7.05 which brings forward P/E to just 10x. Such low multiple imply that any miscalculation in the analysts' estimate (to the downside) would result in a strong recovery in share price. We believe this was the case with Sanderson Farms.

We wrote a quick note on Gorman-Rupp (GRC), which etched out a modest gain of +3%. However, that gain wasn't without some volatility. When we published the list, the stock was trading at $28. The shares traded below $20 in August (hit the low of $18.14 on August 22 but closed above $22). The reversal came the same day and shares traded as high as $32. We stated that shares were worth considering at such level but didn't have complete conviction over the name. However, if one was able to pick up shares on a two part trade, one would have done quite well within one year.

U.S Dividend Watch List: April 8, 2016

It was another strong week for the market as the S&P 500 rose +0.53% pushing the YTD gain at +2.3%. Because of that, there are only 9 companies on our watch list this week. We are not inclined to put new money to work at this point. However, the financial sector is appealing at the moment and any new money needs to be able to generate relatively safe income. Continue reading

Richard Russell Review: Letter 859

On this date in 1983, Richard Russell published Issue 859 of the Dow Theory Letter [526].  At the time, the Dow Jones Industrial Average was at the 1,191.47 level and the Transportation Average was at 531.53.

image

The following Richard Russell Review details the topics of the Elliott Wave and 50% Principles as outlined by A.J. Frost, Robert Prechter and Charles H. Dow.

Continue reading