Author Archives: nlo-admin

Dover Corp.: Review

On September 10, 2015, we posted an article which reviewed the fundamentals of Dover Corp. (DOV).  Our conclusion on the stock was as follows:

“Considering that there are only two remaining downside targets, the downside risks are “contained” for the most part.  At most, we think that the next downside target is at the ascending $38.51 level.  A two stage purchase plan should be entered into at the below the ascending $46.87 and  $38.51 levels ($56 and $44, respectively).”

Since September 2015, the following is the updated Dow Theory chart that was referenced in the above quote:

image

What should stand out is the fact that once DOV declined below the ascending $46.87 downside target, losses have been contained. Subsequently, Dover has risen to the current price of $70.97.  Our best guess is that DOV is facing resistance at the ascending $59.40 line (approx. $80).

As best we can tell, the use of Dow Theory could be coincidental to what ultimately happens to the stock.  However, depending on the quality of the stock (ideally blue chip stocks), Dow Theory is an appropriate tool for consideration of downside risk.

WD-40 Co.: Downside Targets

Below are the downside targets for WD-40 Co. (WDFC) based on the work of Edson Gould’s Speed Resistance Lines (SRL).

image

The assumption by many momentum investors is that WDFC will continue to rise further.  However, prior experience suggests that a parabolic rises usually end in a breakdown in the price.  Regardless of any further rise in the price of the stock, the conservative downside target is the minimum downside target to watch for.  At this time, the conservative downside target is $72.49.  We’d become interested in reviewing the fundamentals when WDFC falls at or below the $72.49 level.

Canadian Dividend Watch List: June 2016

Performance Review

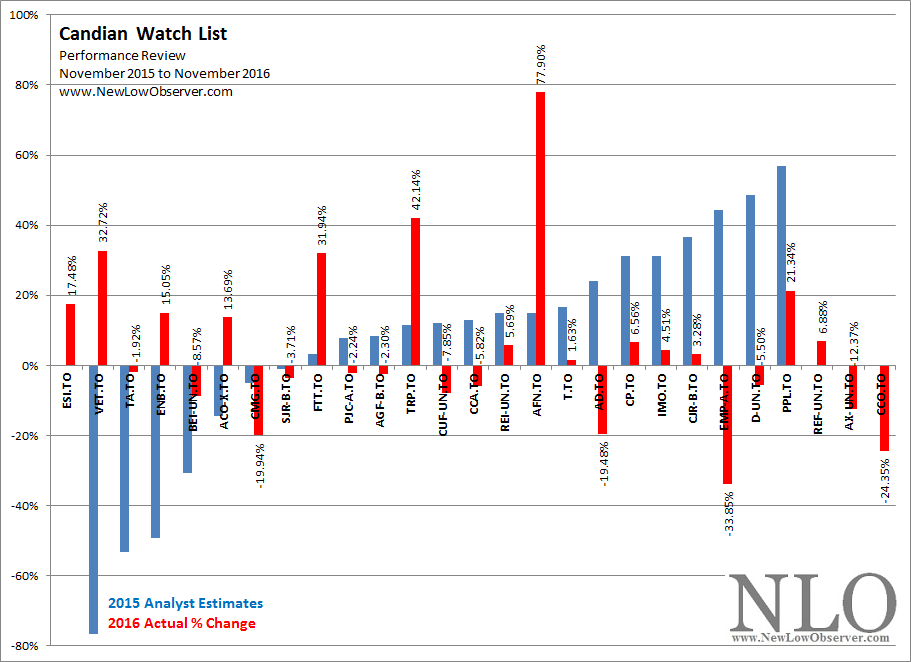
Below is the 1-year performance of the Canadian dividend stocks from our June 2014 watch list (found here):

image

The best performing stocks were Saputo (SAP.TO), Rogers Communication (RCI-B.TO) and  First Capital Realty (FCR.TO).  The worst performing stocks were TransAlta (TA.TO), Dream Office (D-UN.TO) and Home Capital Group (HGC.TO). 

Worth noting is that the stocks that were expected to have negative returns averaged a decline of –0.38% while the stocks expected to gain in price also declined but by as much as –6.32%.  The Toronto Stock Exchange declined –5.13% in the same one year period from June 19, 2015 to June 17, 2016.

Canadian Dividend Watch List

This is a list of Canadian dividend stocks that currently, or in the past, had a history of consecutive dividend increases. For those wishing to find the most complete fundamental information on these companies, we recommend visiting one of Canada’s leading financial websites, the Financial Post (found here). However, Yahoo!Finance probably has the better long-term charts and historical dividend data.

Quick Take: A Stock Worth Considering Now

Dow Theory: Did Microsoft Overpay for LinkedIn?

The question has come up about whether or not Microsoft (MSFT) has overpaid for LinkedIn (LNKD).  We’re going to apply Dow Theory to determine what would have been considered the fair value for LNKD based on the stock price. Next, we're going to see how much or how little MSFT paid for LNKD.

First, we need to establish what Dow Theory considers the fair value.  According to S.A. Nelson, fair value is determined when…

"...stocks have recovered after artificial depression and relapsed after artificial advances to the middle point which represented value as it was understood by those who bought or held as investors."

The idea of “…bought or held as investors…” is very important as it reflects individual (or institutional) money that has decided to buy a stock with the expectation of holding for an extended period of time, usually 5 years or more.

Artificial Advance and Depression

When looking at the price movement of LinkedIn, it is easy to identify the artificial advances and depressions.  However, to determine the fair value, a price which long-term holders of the stock have, on average, acquired the stock, we look to the middle point.

In order to determine the middle point (fair value), based on Dow Theory, we look at the previous major advance from the low to the high in the stock price.  The previous low was $59.07 and the previous high was $276.18.  The middle point (also know as the 50% principle) is $167.63.

image

LinkedIn Fair Value

If fair value for LinkedIn was actually $167.63 and Microsoft agrees to pay $196 per share, that would suggest a premium of 16.92%.  How does this crude methodology stack up against institutional analyst assessments of fair value for LNKD?  This from Morningstar.com:

“LinkedIn posted a better-than-expected start to 2016 as the firm beat both consensus estimates and management guidance for revenue and EBITDA, with strong performance across all three segments. We reaffirm the company's wide moat rating and our fair value estimate of $155. With shares trading just inside three-star territory in after-market trading, we would wait for a larger margin of safety before investing (source: Macker, Neil. “LinkedIn Starts 2016 By Beating Expectations, Management Remains Focused on Engagement”. Morningstar.com. 4/29/2016. accessed 6/14/2016.).”

Morningstar had $155 while Dow Theory assessed a $167.63 fair value.  Although the Dow Theory method seems arbitrary, it is based in sound reasoning which we have covered before on the topic of the 50% Principle.

So, the question becomes not “did Microsoft overpay for LinkedIn?” instead it should be viewed by “how much did Microsoft overpay for LinkedIn?”.  Based on Dow Theory, Microsoft didn’t pay much more than the company would have been worth to long term holders of the stock, in this case a premium of only 16.92%.

Transaction Alert

The NLO team executed the following transaction(s):

LinkedIn: Decline and Rebound Foretold in SRL

On June 13, 2016, Microsoft announced that it was going to acquire LinkedIn Inc. (LKND) for approximately $26 billion.

Based on our prior work, LinkedIn Inc. (LKND) has helped to make Edson Gould’s Speed Resistance Lines (SRL) one of the most interesting indicators to watch when it comes to a stock that has established a declining trend.  On April 30, 2015, we said the following of LinkedIn:

“In the prior decline, LNKD fell to slightly below the midpoint target at $133.19.  This suggests that the current slump should go below the conservative downside target of $187.68.  Going below the $187.68 level should get the stock price to the ascending midpoint target of $139.87.  Those interested in LNKD should consider the stock in stages at or below the ascending $139 level with an acceptance of a decline to the ascending $92.06 level.”

LNKD did decline below $187.68.  However, rather than decline to the $139 level as anticipated, the stock price declined directly to the ascending $92.06 level.  At the time, for anyone serious about investing in LNKD, the dramatic after-hours decline from above $187 to below the $139 level indicated that LNKD was an open target for consideration.

Below is LinkedIn’s stock price based on Edson Gould’s Speed Resistance Lines.

image

Now that Microsoft (MSFT) has decided to absorb LinkedIn, we believe this SRL has served our analysis purposes well.  We continue to maintain that Gould’s SRL, when applied to the appropriate stock, has delivered the most fascinating results.

Ritchie Brothers: Inflection Point?

We noticed an article on SeekingAlpha.com dated May 12, 2016 titled “Ritchie Bros.: Bull Thesis Playing Out Despite Continued U.S. Dollar Strength” by John Zhang.  Although the article allows only paid subscriber access, we believe that as a follow-up article to one published on December 29, 2015 titled “Ritchie Bros: Auctioneer Trading At Bottom Prices”, where the stock price increased +35.41%, there should be at least a cursory review of the stock.  After all, Mr. Zhang was spot-on with the stock price in December 2015, so there must something in what is being considered.

Continue reading

Illumina: In The Zone

Since our October 6, 2015 posting about Illumina Inc.  (ILMN), the stock has continued in an overall declining trend as outlined in the chart below.

Continue reading

Coppock Curve: May 2016

The mantra, "sell in May and go away" didn't pan out this year. The Dow Jones Industrial Average has been virtually flat since early May.

Continue reading

Transaction Alert

The NLO team executed the following transaction(s):

Gold Stock Indicator: June 2016

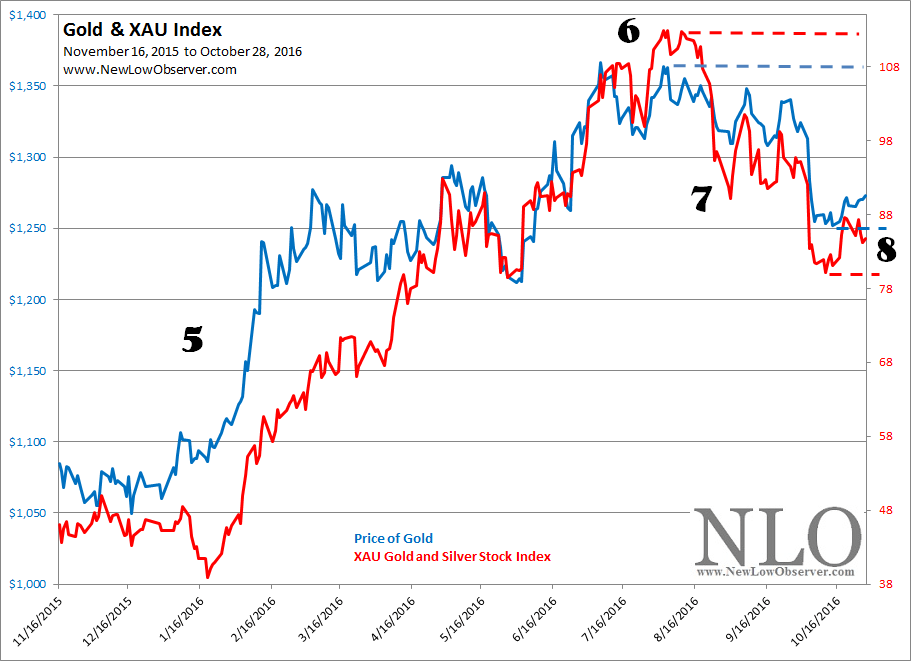
If you like a rising market then you definitely want the price of gold and gold stocks to increase above the level of $1,294 and 92.85, respectively.  Otherwise, there will be a big blowoff in the gold market and sizable downside risk.

image

Good News, Bad News

U.S Dividend Watch List: June 3, 2016

Previous Year Performance Review

In our ongoing review of the NLO Dividend Watch List, we have taken the top five stocks on our list from May 29, 2015 and have checked the performance one year later. The top five companies on that list can be seen in the table below.

Symbol Name 2013 Price 2014 Price % change
PG Procter & Gamble 77.43 82.47 6.5%
MUR Murphy Oil Corporation 42.30 30.40 -28.1%
UBA Urstadt Biddle Properties Inc 19.65 21.52 9.5%
STR Questar Corp. 21.17 24.97 17.9%
WMT Wal-Mart Stores 73.06 70.87 -3.0%
      Average 0.6%
         
DJI Dow Jones Industrial 17,849.46 17,807.06 -0.2%
SPX S&P 500 2,092.83 2,099.13 0.3%

The average gain for the top 5 companies slightly exceeded the market. The best performer was Questar (STR) and the largest decline came from Murphy Oil (MUR). We started our review with Procter & Gamble (PG) which gained +6.5% excluding the dividend. It's no secret that Procter & Gamble is a blue-chip name. Our commentary stated that downside risk was limited and research should be initiated at currently level. It's too bad that we didn't heed our own advice on this one.

Last year, Murphy Oil (MUR) was trading at its yearly low with a 3.30% dividend yield. When we wrote about Murphy last year, oil was trading around $60. However, the price tanked and hit a low at $26. The recent rebound brought the price back to $48 but remains more than -20% below where we were a year ago. Our assessment that oil price were closer to the bottom at the time was extremely wrong. One key thing to note is that Murphy didn't cut their dividend payout and as such, their current dividend yield is north of 5%. Despite the fact that Murphy can sustain their dividend, shares should be view as speculative given the negative net income outlook.

Wal-Mart (WMT) was trading just north of $73 and our team believed that if shares could hold above this level AND continue to raise thier dividend, it would be worth considering. One of the two criteria came to fruition when board of director approved a dividend hike from $0.49 to $0.50. Despite that, the company reported a dismal third quarter last year and the techinicals broke down which took the shares down as low as $56.30.

U.S. Dividend Watch List: June 3, 2016

The conventional wisdom of sell in May and go away didn't quite pan out. S&P 500 rose more than +2%. At the end of the week, our watch list contains 15 companies. Continue reading

Bitcoin Targets

On November 4, 2015 we posted a chart providing downside targets of $350.33 and $245.83 when Bitcoin was priced at $408.74.  By November 11, 2015, Bitcoin had declined to $312.58 and we thought that there would be a continuation of the decline to $245.83.  The reality was that Bitcoin never went below the November 11th low. 

We were wrong about Bitcoin declining to the mid-range target, however, with the recent ascent in the price, we now need to focus on the conservative downside target based on the high of $538.15.  Below we’ve outlined the conservative and mid-range downside targets.

image


As the price of Bitcoin increases we will have to adjust the target.  For now, we’re looking to the $388.51 level based on the work on Edson Gould.

Nasdaq 100 Watch List: May 2016

Performance Review

Below is the one year performance of the stock on our watch list from May 8, 2015:

symbol Name 2015 2016 % chg
GRMN Garmin Ltd. 45.94 42.25 -8.03%
FOSL Fossil Group, Inc. 79.62 27.83 -65.05%
KLAC KLA-Tencor Corporation 59.8 72.7 21.57%
FOXA Twenty-First Century Fox 32.79 28.85 -12.02%
NWSA News Corporation 15.14 11.93 -21.20%
AMAT Applied Materials, Inc. 19.69 24.28 23.31%
NTAP NetApp, Inc. 35.65 25.45 -28.61%
SNDK SanDisk Corp. 67.72 76.18 12.49%
MU Micron Technology, Inc. 27.18 12.63 -53.53%
FAST Fastenal Company 42.72 45.99 7.65%
ALXN Alexion Pharmaceuticals 163.02 151.12 -7.30%
WYNN Wynn Resorts Ltd. 117.84 96.81 -17.85%
DTV DIRECTV 89.38 93.55 4.67%
DISCA Discovery Communications 31.33 27.88 -11.01%

The performance of the Watch List from last year averaged a loss of –11.06% which was well below the Nasdaq 100 Index change of +1.71% over the same period of time. The stock that gained the most was Applied Material (AMAT) while the stock that declined the most was Fossil Group (FOSL) with a loss of –65.05%.

Analysts were able to accurately forecast the general direction of 71%  of the watch list stocks, a fairly high level of success not normally seen.

image