Category Archives: William X. Scheinman

The Power and Lessons of Speed Resistance Lines

We are not big fans of charting as a means to make decisions about where the price of a stock or index will go. However, when a charting strategy has a high level of consistency while taking away our own person bias, we have to dig a little deeper.  This is a general overview of the incredible forecasting power and the practical investment lessons that we’ve experienced while employing Speed Resistance Lines.

Speed Resistance Lines, as demonstrated by the writing of Edson Gould, have been of significant aid in tempering our enthusiasm for a stock or index, especially when applied to targeting downside levels.  Within the context of the current bull market since 2009, we’ve seen a large majority of the stocks achieve the conservative downside target (more SRLs we’ve run here).  This means that even when we thought we selected the right stocks to apply to the SRL, we have been wrong.

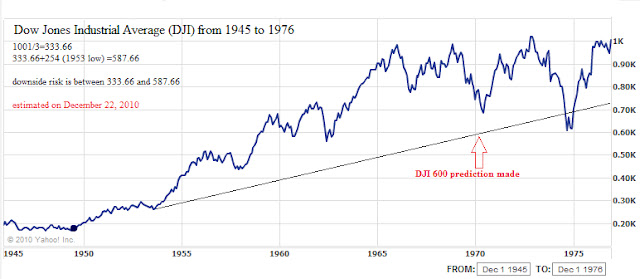
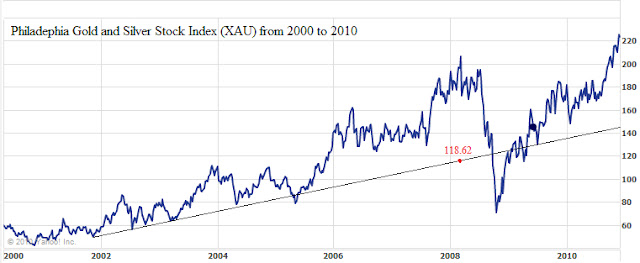
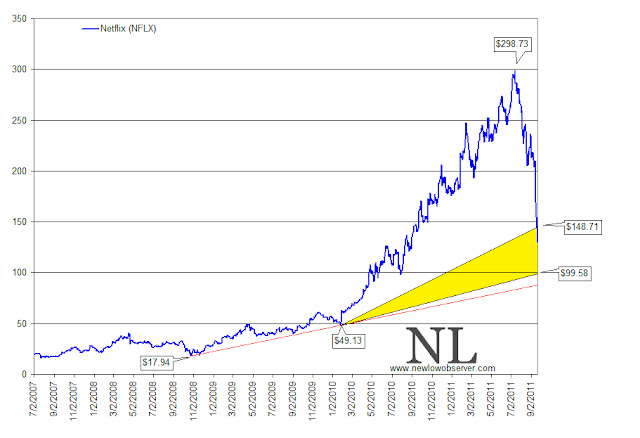
Below are the earliest three examples of Speed Resistance Lines (SRL) that we introduced with the focus on downside targets.  The first SRL we will review is the Dow Jones Industrial Average from 1949 to 1975. The second SRL is for the Philadelphia Gold and Silver Stock Index (XAU) from 1998 to 2016.  The last one is Netflix (NFLX) from 2007 to 2013.

sources:

  • Scheinman, William X. “1966 and All That: One Stock Market Analyst Sees Some Ominous Parallels Today”. Barron's. March 17, 1969. pg. 5.
  • Scheinman, William X. “600 on the Dow?” Barron's. February 9, 1970. pg. 5.
  • Scheinman, William X. “May to December: The Bear Market, Says One Analyst, Will Hit Bottom This Winter”. Barron's. August 24, 1970. pg. 5.

Review: XAU Speed Resistance Lines

In our very first attempt at understanding Edson Gould’s Speed Resistance Lines, when the Philadelphia Gold and Silver Stock Index (XAU) was within 6 trading days of the top (found here), we said the following:

“Based on the most recent high of 228.95 the downside target for the XAU index is 76.32. We recommend that whenever the XAU index falls at or below the speed resistance line drawn on the chart, between now and just before 2028, as part of the secular rising trend in interest rates/inflation, we would expect that the stocks in the index are underpriced. Confirmation of fair values should be determined for possible speculative positions at these times.”

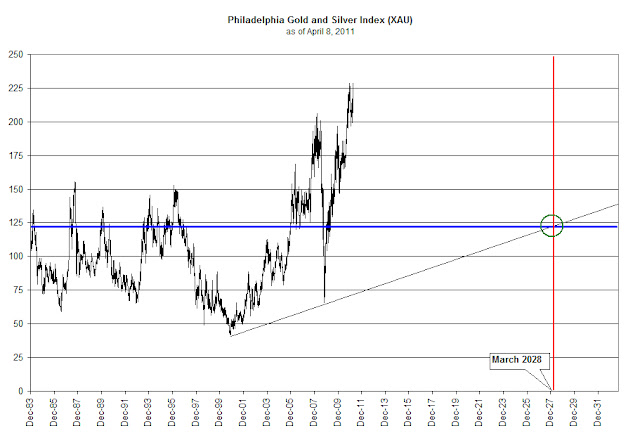
An updated chart of the Philadelphia Gold and Silver Stock Index with Speed Resistance Lines is below:

Continue reading

Apple (AAPL) and Speed Resistance Lines

As describedin our article on speed resistance lines (SRL) dated September 22, 2011 (found here), Netflix (NFLX) fell below our projecteddownside target of $99.58. Although we thought that the stock would be worthconsidering below such a level, we had to concede that, “...the difficulty may be that thesentiment that pushed the stock price to $298.73 would likely be just theopposite to push the price down.” Assuming the purchase of thestock at $99.58, an investor would have gained 21.10% based on the currentprice of $120.59.
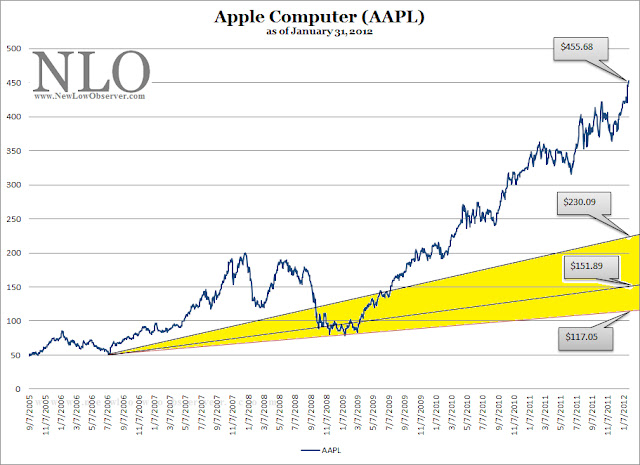
Naturally, wewondered what Edson Gould’s speed resistance lines would say about AppleComputer (AAPL). The very first thing that we look for, to determine speedresistance lines, is the most recent peak in the price.  Because AAPL is continually making new highs,we only need to use the latest price of $455.68 as our starting point.

Based onGould’s work, Apple (AAPL) has a conservative downside target of $230.09 and theextreme downside target is $151.89.  Whenwe ran the same calculations on Netflix (NFLX) in September 2011, we made aseemingly innocuous error.  We overlookedthe fact that NFLX had a lower support line (red line) at the price level of $85.  In this case, we have denoted AAPL’s supportline (also in red line), at $117.05, as a potential downside target for thestock.
As the priceof Apple increases, so too does the SRL lines based on the work ofEdson Gould.  The rampant enthusiasm for AAPLsuggests that the stock isn’t likely to decline to the indicated levels anytime soon.  However, when and if you seeAAPL start to make a swan dive, the levels indicated are reasonable downside targets.

Netflix and Speed Resistance Lines

In a February 9, 1970 Barron’s article titled “600 on the Dow?” William X. Scheinman provides an interesting chart of the Dow Industrials (DJI) that outlines what he believes to be the target level that the DJI would fall to before rebounding. This analysis included macro economic analysis that supported the reasons why the Dow was expected to go to 600.

What is most compelling in Scheinman’s analysis is the accuracy of the target level that the DJI was expected to reach. An element that leaves some unanswered questions is that Scheinman had predicted that the DJI would reach 600 within the same year that the article was written. Of course, The DJI didn’t reach 600 until 1974. This has to do with Scheinman’s cycle analysis which is separate and distinct from the topic which we will examine. Being aware of this inconsistency and leaving it aside for the time being, we’ve attempted to understand the rational and methodology of how Scheinman was able to arrive at 600 on the DJI when it was trading at 755.68.

Scheinman indicates that he obtained his method for accurately predicting the level of the DJI from Edson Gould. According to Scheinman, Gould used what is known as the 1/3 speed resistance line measurement to gauge price change and elapsed time which was purported to be two key determinants of crowd psychology in the market. Scheinman goes on to say:

“Resistance lines decline or ascend at one-third or two-thirds the rates of actual declines and advances between significant bottoms and tops. Resistance to advance or decline is frequently encountered at such trendlines; however, if the resistance line is decisively penetrated, the price-action often tends to accelerate in the direction of the penetration.”
In an example provided by Scheinman below, he plots the bull market of the DJI from 1949 to 1970. In that chart, we can see that the dashed line, the one-third speed resistance line, intersects with the 600 level on the DJI.
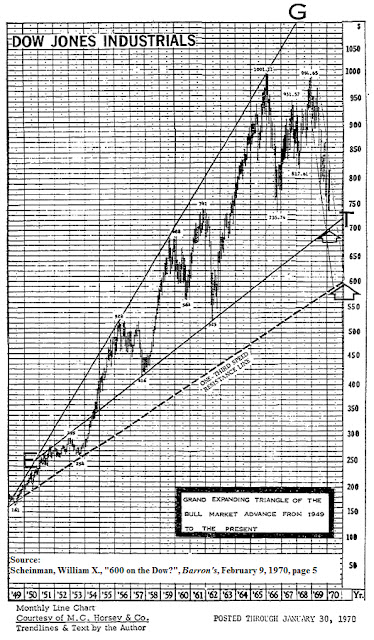
As far as we can tell, the 1/3 speed resistance line is calculated by dividing the peak of the market move by 3.  To be as conservative as possible, we’ve added the 1/3 speed resistance figure to the low of the first major decline in the bull run.  In this case, the first major low in the bull market from 1949 to 1966 was at the 1953 low of DJI 254.  The peak is indicated to be 1001 (1001/3=333.66).  Then we add 333.66 to 254 arriving at a figure of 587.66.  In order to account for the extremes, we assume that 1/3 the peak is the point at which the market finally settles.  In this case, 1/3 of the peak value is 333.66.  We feel that the conservative and extreme values help to establish a range which a market or stock that has had a near parabolic rise will finally settle at or near. 

According to our calculations for the market run from 1949 to 1966, 587.66 and 333.66 were the conservative and extreme downside targets for the market, respectively.  However, in the article, Scheinman says that the potential worst-case scenario level would be 597.61.  For the most part, Scheinman’s estimate was fairly accurate in terms of where the reversal in the market occurred.  The bottom in the stock market took place on December 9, 1974 at the 579.94 level.

In the chart of the Dow from 1945 to 1976 below, it should be noted that a large amount of “overshooting” of the 1/3 speed resistance line occurred when the low did take place in 1974 instead of 1970 as predicted by Scheinman.  In the case of the Dow, the index overshot the 1/3 speed resistance line in 1974 by 15%.  However, the price was well within the established, albeit wide, range of 587.66 to 333.66.

We decided to see how consistent the 1/3 speed resistance line would be if applied to three different situations.  First, we’ll review the bull market in the Dow Industrials (DJI) from 1982 to 2007. Next, we’ll run this model using the Philadelphia Gold and Silver Index (XAU) from the bear market bottom of 2001 to the present.  Finally, we’re going to see how this model works against Netflix (NFLX), a member of the Nasdaq 100, in a real-time example.

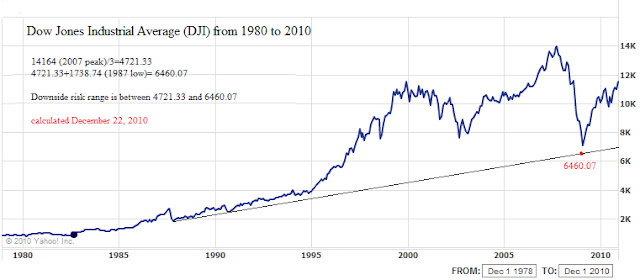
In the case of the bull market run from 1982 to 2007, we divided the peak of the market at 14,164 by 3 and arrived at 4721.33.  We then added 4721.33 to the first major low in the market after the beginning of the bull market which was in 1987 at 1738.74.  The sum of the two figures is 6460.07 for the conservative and 4721.33 for the extreme scenarios. 

When we review the actual bottom in the DJI in 2009 of 6547.05 we can see that the difference between the most conservative estimate and the 2009 low was off by 86.98 points.  There is no instance of the DJI overshooting the 1/3 speed resistance line.  Although coming within 1.5% of an estimated target seems exceptional, the real challenge becomes, would an investor commit money to an investment before the price level actually hits a projected target?  Once invested, could an investor stomach a further decline of 27% or more? [(6460.07-4721.33)/6460.07=26.92%]
In the case of the bull market run in the XAU Index, we divided the peak of the index at 206.37 in 2008 by 3 and arrived at 68.79.  We then added 68.79 to the first major low in the index after the beginning of the bull run, which was at 49.83 on November 19, 2001.  The sum of the two figures is 118.62.  When we contrast the difference between the two numbers, 118.62 and the actual low of 65.72, we see that conservative estimate was accomplished, however a further decline of 45% to below the extreme level was established instead.  Reasonably near the extreme end of the range, but who is willing to hold on after a 45% drop?
Finally, in reviewing the chart pattern of Netflix (NFLX), we have the peak of NFLX at $298.73.  The conservative estimate for the stock is that it would fall to $148 which has already taken place.  The extreme downside target would be $99.58.  Because of the nature of the rise, we believe that Netflix (NFLX) is slated to fall at least to the $99.58 level. 
If for any reason investors become interested in buying Netflix (NFLX), the ideal time to do it appears to be at a price at or below $99.58.  However, the difficulty may be that the sentiment that pushed the stock price to $298.73 would likely be just the opposite to push the price down.  Only time will tell whether Netflix is going to conform to technical patterns created by Edson Gould.
Please consider donating to the New Low Observer. Thank you.

Projecting Downside Targets for Gold and Silver Stocks

In our prior work on the topic of gold and silver, we indicated that the precious metals market had entered into a secular bull market. Our confidence in that thesis was based on the works of Edward Dewey and Edwin Dakins 1947 book titled Cycle: The Science of Prediction. In that book, Dewey and Dakins illustrated the cycles for inflation which indicated that a peak in inflation would occur in 1979 and a trough of inflation would occur around 2006. While the 1979 peak was accurate the 2006 bottom was off by a few years. However, we feel confident that being off by a few years within the context of a 50-year cycle allows for some margin of error.


As investors, the NLO team is primarily concerned with the downside risk and major downside targets. For the gold and silver market, we will use the Philadelphia Gold and Silver Stock Index (XAU) to determine where the next low might occur.


To project the downside target for the XAU, we will use speed resistance lines as pioneered by Edson Gould. William X. Scheinman wrote a piece in Barron’s titled “600 on the Dow” on February 9, 1970 that outlined exactly how Gould’s resistance lines work.


The forecast by Scheinman of a closing low for the Dow at 600 was off by 2.57% when the index closed at 584.56 on October 4, 1974. [As a sidebar, Dow Theory gave a bull market indication in January 1975 that would have investors fully invested.] Although being off by such a small amount, Scheinman also said that the low would occur approximately a year from the date that the article was written. We believe that the tactical error on the part of Scheinman was to expect that the decline would be based strictly on a set time frame rather than based on the level of the resistance line. The chart below is the original piece that was generate by Scheinman from 1970.


In our chart of the Gold and Silver Stock Index, we have drawn the XAU on a daily basis from 1983 to the present. As described by Scheinman, the counter-trend movement should revert to the speed resistance line or two-thirds of the established high. As an example, the previous peak of the XAU on March 14, 2008 was at the 206.37 level. 206.37 divided by 3 is 68.79. The reversal from the 2008 decline was 65.72 on the XAU. This was within 4.5% of the speed resistance level.


Based on the most recent high of 228.95 the downside target for the XAU index is 76.32. We recommend that whenever the XAU index falls at or below the speed resistance line drawn on the chart, between now and just before 2028, as part of the secular rising trend in interest rates/inflation, we would expect that the stocks in the index are underpriced. Confirmation of fair values should be determined for possible speculative positions at these times.


Note: A variation on this method is to divide the high by three then adding the first major low after the start of the bull market, in this case the October 27,2008 low for the XAU. An example of the usefulness of this technical approach to projecting downside targets can be found by dividing the 2007 top in the Dow Jones Industrial Average (14,164) by three and adding the 1987 low (1738.74). This provided a speed resistance line of 6460.07 which was within 2% of the actual March 9, 2009 low. The blue horizontal line, in our chart of the XAU above, represents the expected downside target when adding the October 2008 low to the speed resistance line.
Please revisit New Low Observer for edits and revisions to this post. Email us.