
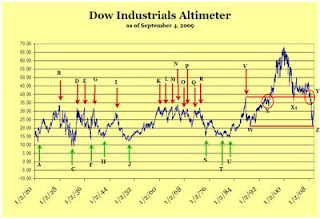
Historically, since 1871 (Cowles Commission Expectation of Individual Stocks), the altimeter has indicated that whenever the Dow Industrials went above the 30 range the market was overvalued and whenever the market was below 15 the market was undervalued. As illustrated in the chart below, since 1920 the Dow Industrials followed this pattern quite well until the breakout above 38.47 on June 13, 1995 (point X).
After the January 13, 1950 (point J) buy signal, the altimeter gave numerous sell signals from 1961 (point K) to 1972 (point R). At any point that the sell signals were given, except for 1961 (point K), you would have avoided the major market declines of the late 60's and throughout the 1970's. When the next buy signal was registered on December 13, 1974 (point S) the stock market was off to the races and never looked back.
From December 13, 1974 (point S) until the present we've been confronted with an unprecedented pattern change in the altimeter. Even though the pattern that was established no longer seems to fit previous indications, it is important to note that the indicator is giving us a massive head and shoulders technical pattern to watch for.
After the peak in the altimeter on August 25, 1987 at 38.24 (point V) and the subsequent crash that followed, the market bounced from the 1989 bottom (point W) at 21.14 to the 38.07 level in December 28, 1993. The declined that followed the 1993 peak signified that the 38 level was very important to watch for. Of course, after falling to the 1995 level of 32.88 (point X) the altimeter went to the unprecedented level of 68.13 in 1999.
Everything that has happened since 1999 has only cemented the significance of the 38 and 21 levels on a technical basis. The reversal of the decline from 1999 to 2003 at 36.06 (point X1; near 38) and the congestion, and subsequent crash, in 2007 led to the altimeter falling back down to 21 on March 9, 2009.
If we get lucky, we could see the Dow go back to the 38 level. This means that we could possibly reach the 10,901.44 on the index. After reaching the 38 level we should expect the stock market to decline at least to the 21 level again. However, the current trend is still indicating a downward trend since hitting the most recent peak of 33.53 on August 27, 2009.
Please revisit Dividend Inc. for editing and revisions to this post.