
- Japan
- Market Indicator
- Price Momentum Indicators
- Richard Russell
- Silver
- Speed Resistance Lines
- U.S. Dividend Watch List
U.S. Dividend Watch List: February 22, 2013
Below are the 19 companies on our U.S. Dividend Watch List that are within 11% of their respective 52-week lows. Stocks that appear on our watch lists are not recommendations to buy. Instead, they are the starting point for doing your research and determining the best company to buy. Ideally, a stock that is purchased from this list is done after a considerable decline in the price and rigorous due diligence.
Nasdaq 100 Watch List: February 22, 2013
Below are the Nasdaq 100 companies that are within 10% of their respective 52-week lows. Stocks that appear on our watch lists are not recommendations to buy. Instead, they are the starting point for doing your research and determining the best company to buy. Ideally, a stock that is purchased from this list is done after a considerable decline in the price and rigorous due diligence.
Investors Pay Big for Loss Protection
There is one issue that we believe undermines the fabric and credibility of the stock market and it will darken everyone's door some day. That issue is the murkiness of pre & after-hour trading and their impact on risk control tools like stop loss orders. Currently, these extra hours of trading do not trigger stop-loss orders. As a result, this creates an uneven playing field for those with the access and those without the access to pre/post market trading. The impact of an uneven playing field in after-hours will ultimately be the undoing of the market in general.
However, before going into specific details, it needs to be said that standing stop-loss orders are very simple. An investor wishing to avoid significant loss can instruct their broker to automatically place a market order to sell their stock when the stock falls to a specified price (the opposite applies to short sellers). As the stock hits the indicated level on the way down (on the way up for short sellers), the stock automatically becomes a market order and is sold at the best available price. Normally, this procedure is done automatically once the shareholder provides these instructions to their broker.
While the process seems pretty simple, any investor who thinks that having stop-loss orders is a rational way to limit losses (or protect profits) are paying through the nose for the most recent lesson from Mr. Market.
The latest lesson is with Verifone Systems (PAY). After the market closed on February 20, 2013, Verifone announced that it would miss Q1 and Q2 targets (found here). At the close of trading on February 20, 2013, PAY was at $31.89. Unfortunately, in after-hours trading, PAY declined -32.55% on trading volume of 4,783,086 shares.
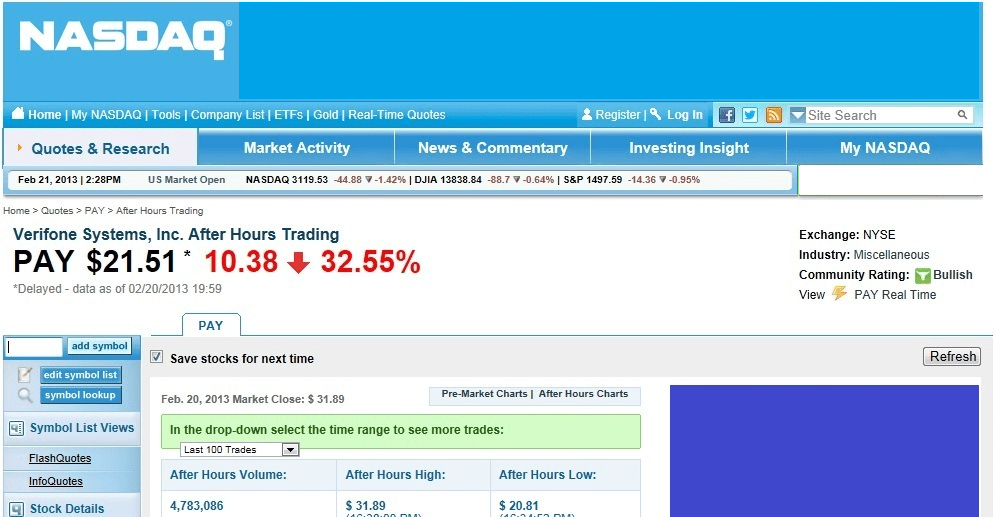
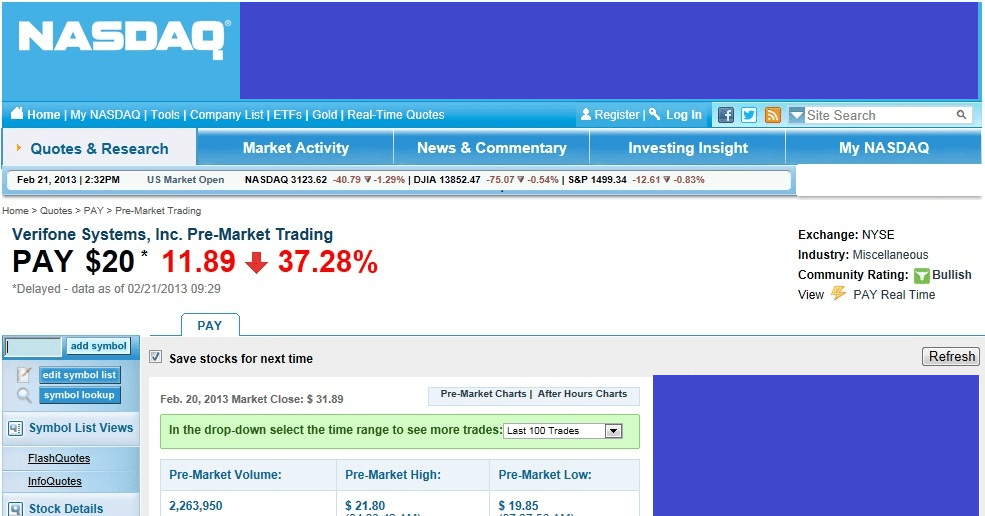
Then, in pre-market trading volume of 2,263,950 shares, PAY fell an additional -5% to the opening price of $19.97, a total decline of -37.28% from the close of market on February 20th to the open on February 21st.
A total of 7,047,036 shares were traded in the combined post/pre-market trading resulting in the decline of PAY to the tune of –37.28%. During the regular hours of trading, the total volume of shares traded was 50,411,282 as the stock closed the day at $18.24.
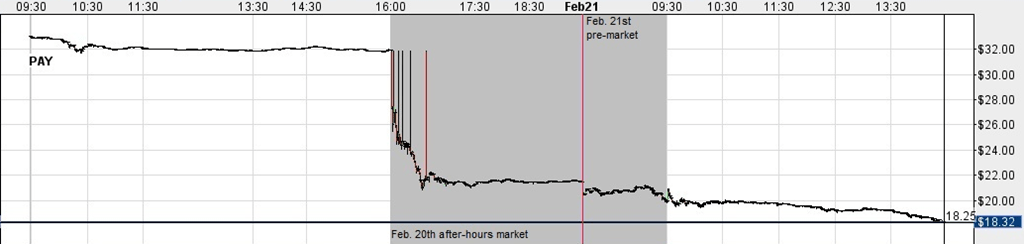
What needs to be understood is that roughly 12% of the shares traded caused PAY to decline –37% while 88% of the shares traded caused PAY to decline only –8%. This is the equivalent of an 11-story building weighing more than the 102-story Empire State Building.
According to the NYSE Euronext website (found here):
“NYSE and NYSE Amex are the only equities markets that offer a rich combination of cutting edge, ultrafast technology with the volatility buffer of human judgment and accountability to create orderly opens and closes, lower volatility, deeper liquidity and improved prices.”
These are bold claims for NYSE Euronext to make when 12% of trades are allowed to increase volatility, decrease liquidity and destroy prices. It is probable that NYSE Euronext will say that it doesn’t happen enough to warrant any changes. However, investors will discount the after-hours by piling their trades into this narrow window between conventional hours of trading. This is setting the markets up for the opposite of what the NYSE Euronext and other exchange operators claim to provide market participants.
Questions That Need Answers
-
Is it necessary to have the minority of traders affect the majority of the movement in the stock price while stop loss orders aren’t allowed?
-
If an investor has a sitting stop-loss order at a "reasonable" level, like $30 or lower, does it make sense that their shares automatically sell at the February 21st opening price of $19.97?
-
Can the investor be given the option, when the stock falls more than -10% in pre/post trading, as to whether they wish to commit to their initial order during “regular” hours?
-
Should we get rid of pre/post trading hours?
-
Is the current system adequate?
We believe that market regulators need to answer these questions before the situation really, really gets out of control. For now it only affects individual holders of the wrong stocks at the wrong time, which seems to be a little too frequently, of late. At some point, there will be a mass of pre/post market participants that will cause a stampede for the narrowest exits on a much broader scale that will put into the question whether what remains of the current system actually works.
Until the time comes when the above questions are answered and changes are implemented, the next stock market crash will be born in the pre/after-hour markets with flash crash characteristics if this issue isn’t addressed. We recommend that investors avoid using stop-loss orders as a means of protection against downside risk or seriously consider making use of pre/after-hour market trading platforms.
Posted in After Hours, flash crash, pre-market
Avoid These Ratios on Gold Stocks
When attempting to put the current market moves into perspective, it makes sense to look at the various market ratios like Price-to-Earnings, Price-to-Book, Price-Sales as guideposts for market direction. Ratios help to put the numbers that are constantly being generated into proper perspective, in relative terms. However, when attempting to look at how relatively valued gold stocks are, there are a couple of ratios that investors should uniformly avoid and those are the [Gold Stock Index]/Gold and the Gold/[Gold Stock Index].
For example, the HUI/Gold ratio currently appears to indicate that we’re approaching the 2008 low. Also, as suggested by well known market analyst John Hussman, since 1974, whenever the Gold/XAU ratio was at 3 or lower gold stocks were a sell. Whenever the Gold/XAU ratio rose to 5 or higher, gold stocks would be a buy (found here).
Currently, the Gold/XAU ratio is at 11.28, gold stock should be considered a screaming buy. However, since July 15, 2008, the Gold/HUI ratio has been above the 5 level ever since. This means that if either the XAU or HUI were bought on July 15, 2008, there would have been losses of -66% by October 27, 2008, an annualized loss of -98%. Additionally, both the XAU and HUI are at –23% and –13% if held since July 15, 2008 to the present (ratio charts below).
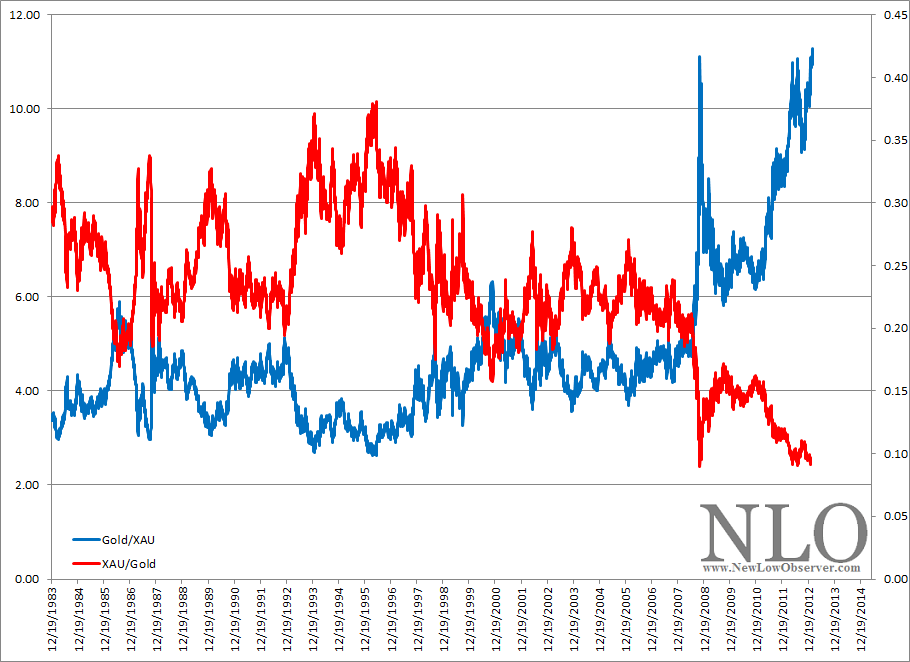
Now, because the XAU/Gold ratio matches the levels of the HUI/Gold ratio, the inverse should also be consistent. For this reason, the belief that the current level is close to the end of the decline may be in error. Additionally, as has been suggested by some, the fall in the price of gold and gold stocks may be a precursor to declines in the overall stock market. As we’ve demonstrated many times in the past, when the general stock market declines gold stocks decline by an even larger percentage.
From our work in the topic, our Gold Stock Indicator is 53% above the 2008 low as opposed to the Gold/XAU, Gold/HUI, XAU/Gold and HUI/Gold being within 5% of the 2008 low.
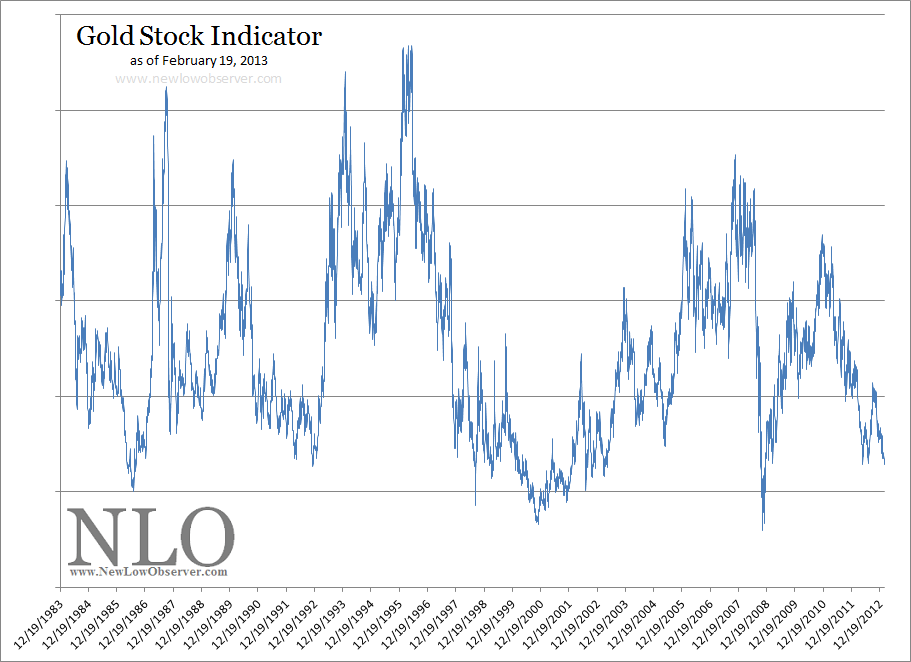
Our view is that, while the 2008 low is not guaranteed, there is the remote possibility that the lows for gold stocks are not completely in based on our Gold Stock Indicator.
Comments Off on Avoid These Ratios on Gold Stocks
Posted in Gold Stock Indicator
Canadian Dividend Watch List: February 15, 2013
This is a list of Canadian dividend stocks that currently, or in the past, had a history of consecutive dividend increases. For those wishing to find the most complete fundamental information on these companies, we recommend visiting one of Canada’s leading financial websites, the Financial Post (found here). However, Yahoo!Finance probably has the better long-term charts and historical dividend data.
Posted in Canadian Dividend Watch List
U.S. Dividend Watch List: February 15, 2013
Below are the 19 companies on our U.S. Dividend Watch List that are within 11% of their respective 52-week lows. Stocks that appear on our watch lists are not recommendations to buy. Instead, they are the starting point for doing your research and determining the best company to buy. Ideally, a stock that is purchased from this list is done after a considerable decline in the price and rigorous due diligence.
Posted in NLO Dividend Watch List
Q&A: Cycles and Their Use
Reader Kerry Comments:
“I’d like to pick up on the problem that untrusting investor has identified ‘The problem is that we have never seen one yet that has much accuracy or predictive ability to any substantive degree or within any reasonable time frame. As such, it becomes a ‘big gamble’ to take action on the predictions of any such cycle models or theories.’
“I like cycles myself, but I struggled with cycles that appeared great but then tended to be slightly off when forecasting the future, and therefore are difficult to use in trading. This led me to conduct my own research that has culminated in my own cycle work and the discovery of a 2.2/4.4 year cycle. I am of the opinion that the secular bear is about to strike back in the second half of 2013 as the 17.6 year stock market cycle continues until 2018, when the next great bull market will properly begin.”
Our Response:
Implicit in the discussion of cycles (observations of the past) is the eventual application of the analysis for the future. Unfortunately, some who do the best research on the study of cycles have the worst record of application. Our view is that we’ll be wrong about the actual cycle range and the application of the timing. Therefore, we are never disappointed about the outcome.
However, as students of the market we are constantly working to find quality research on the topic. Already we know that Charles Dow’s work on stock market cycles is useful when applied with skepticism and moderation.
As an example, based on the Wenzlick model for when real estate would bottom (18.3 years) it suggested that the low would be in 2009. In our January 2010 article titled “Real Estate: The Bottom is Calling” we said the following (found here):
“…tendency has been to include the years 2008 and 2010 just to play it safe.”
We understand that the markers for a bottom or top are like sand dunes in a desert, they are constantly on the move. This does not negate the cyclical nature of market moves, it just means that flexibility is required when thinking on the topic of cycles.
We followed up the January 2010 article with what we believed was the definitive call in the real estate bottom based on the work of Wenzlick. In a December 2010 article titled “Real Estate: The Verdict is In” (found here) we felt the title said it all.
Naturally, we could have been completely wrong and in select markets, a bottom may not be in at all. However, we’re trying to think in terms of the broader context. Based on the metrics that we tracked, real estate did hit bottom on or fairly close to the December 2010 low as highlighted in our follow-up article titled “Real Estate: A Sustainable Rise” (found here).
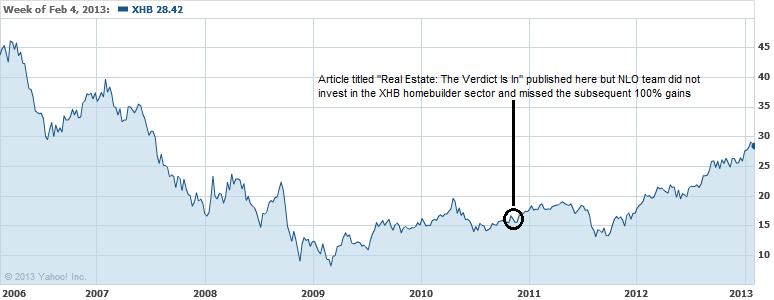
Within the general context of “being accurate” on our call of real estate based on the cycle work of Wenzlick, there are a couple of MAJOR ASPECTS THAT WE DID NOT GET RIGHT and that is the recommendation and investment in homebuilder stocks and the purchase of the home in our specific county.
First, we did not recommend homebuilder stocks because we simply didn’t think of it. That was a huge missed opportunity as shown in the chart below of the SPDR S&P Homebuilders ETF (XHB).
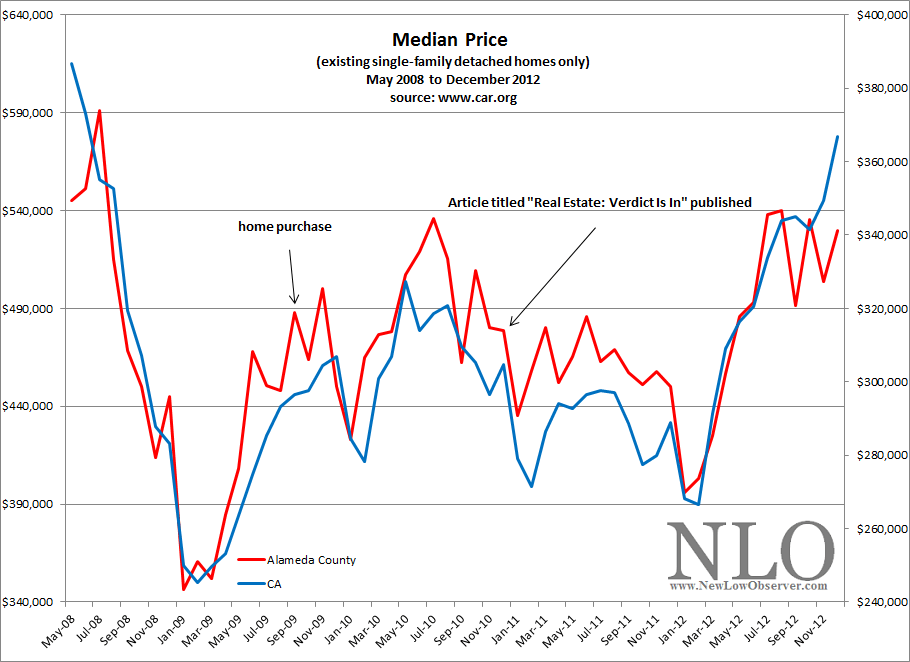
Second, our purchase of a home in September 2009 was not at the low point, for our region of the country, as real estate prices had bottomed in January 2009. By the time of the 2009 purchase, median prices for our county had increased by +40% as seen in the chart below (www.car.org).
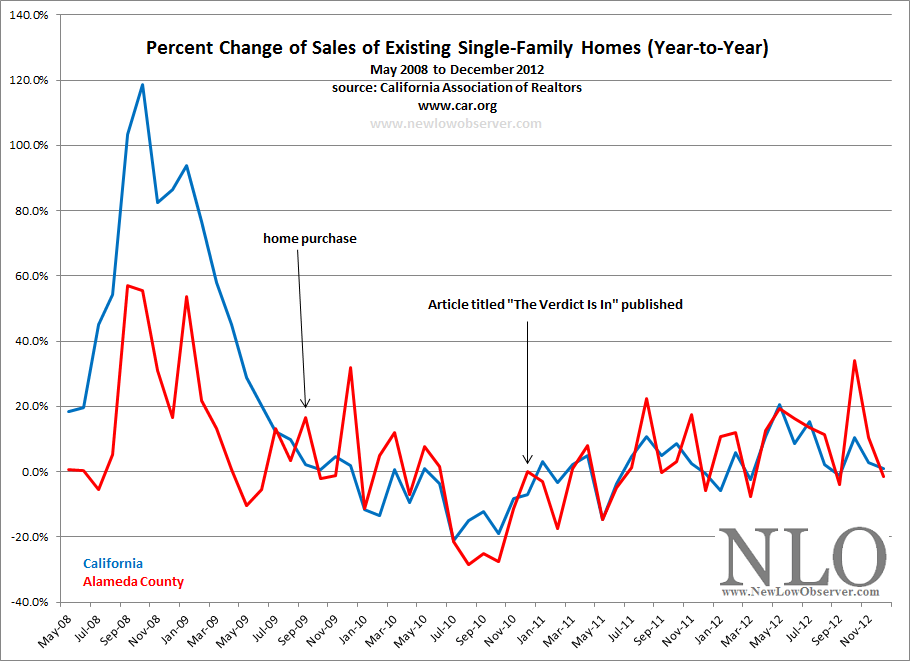
Also, as seen below, existing home sales for our county bottomed a year after the home purchase.
However, the overall point is that we're closer to the low in the respective cycles rather than near the peaks in the cycle with out investments and purchases. Additionally, we’re taking the lessons for the current cycle and hoping to apply it to the next cycle move.
We also have cycle targets for gold and interest rates which have been fairly accurate. Do we go “all in” on the cycle turns? No. However, we do factor in the chance that the change in the cycle could exert its force on our best intentions.
Again, the emphasis should always be on skepticism and moderation when attempting to apply cycles for predictions of the future. With this in mind, a good analyst will hedge their commentary on cycles and allow for a wide margin of error. After all, we’re all students of the market (real estate, jobs, stocks, cars, groceries etc.) and therefore open to changing conditions.
As mentioned earlier, we’re always factoring the downside risks and acting accordingly (most of the time, except when our subscriber SD pointed out the awesome buying opportunity on DELL from our own watch list at the low…Great call SD!).
Comments Off on Q&A: Cycles and Their Use
Posted in cycle analysis, Q and A, real estate
U.S. Dividend Watch List: February 8, 2013
Below are the 24 companies on our U.S. Dividend Watch List that are within 11% of their respective 52-week lows. Stocks that appear on our watch lists are not recommendations to buy. Instead, they are the starting point for doing your research and determining the best company to buy. Ideally, a stock that is purchased from this list is done after a considerable decline in the price and rigorous due diligence.