Below is a chart of Nu Skin (NUS) downside targets based on Edson Gould’s Speed Resistance Lines (SRL):
- Japan
- Market Indicator
- Price Momentum Indicators
- Richard Russell
- Silver
- Speed Resistance Lines
- U.S. Dividend Watch List

Below is a chart of Nu Skin (NUS) downside targets based on Edson Gould’s Speed Resistance Lines (SRL):
Posted in Edson Gould, speed resistance line, SRL
Below is the analyst estimates of expected price change for the dividend stocks that are on our January 10, 2014 U.S. Dividend Watch List (found here).
Below is the 1-year performance of the twelve Canadian dividend stocks from our January 15, 2013 watch list (found here) [intra-day prices listed].
|
Symbol
|
Name |
2013 | 2014 | % change |
| CUF-UN.TO | Cominar REIT | 22.34 | 18.43 | -17.50% |
| CPG.TO | Crescent Point Energy Corp. | 38.58 | 39.4 | 2.13% |
| FFH.TO | Fairfax Financial Holdings | 363.8 | 433.2 | 19.08% |
| IMO.TO | Imperial Oil Ltd. | 43.93 | 45.37 | 3.28% |
| AX-UN.TO | Artis REIT | 15.5 | 15.09 | -2.65% |
| CCA.TO | Cogeco Cable Inc. | 38.9 | 50.7 | 30.33% |
| IGM.TO | IGM Financial | 41.86 | 56.26 | 34.40% |
| CNQ.TO | Canadian Natural Resources | 29.09 | 35.99 | 23.72% |
| TA.TO | TransAlta Corp. | 15.92 | 13.95 | -12.37% |
| RBA.TO | Ritchie Bros. Auctioneers | 20.82 | 25.7 | 23.44% |
| TIH.TO | Toromont Industries Ltd. | 21.8 | 25.81 | 18.39% |
| AGF-B.TO | AGF Management Limited | 9.85 | 13.17 | 33.71% |
| Average | 13.00% | |||
| Toronto Stock Exchange | 12,642 | 13,767.94 | 8.91% |

The entire list of stocks gained +13% compared to the Toronto Stock Exchange gain of +8.91% in the same time. However, the top five stocks fell far short of the Toronto Stock Exchange with a gain of only +0.87%. At the time, we said the following of the first stock on our list, Cominar REIT (CUF-UN.TO):
“Bottom Line: The consistency of the Cominar’s dividend history, given the economic environment, is a reflection of a responsible management team at the helm. Cominar should be considered at or below $18.25. Acceptance of downside risk to the $10.59 price should be built in for long-term investors.”
Cominar has recently declined as low as $17.46 on an intra-day basis. With the stock down nearly –18% from last year, we continue to maintain our stance that utilities and real estate investment trusts are higher than average risks in the current interest rate environment. Therefore, new investors seeking Cominar and other REITs should accept the downside risks before committing capital.
Canadian Dividend Watch List: January 15, 2014
Below are the twelve Canadian companies that are on our radar with the analyst estimates for the coming year.
The following from Richard Russell’s Dow Theory Letters is what we believe to be one of the most valuable examples of Charles Dow’s 50% Principle in action.
“I am publishing this arithmetic chart of the D-J Industrials (high and low monthly) from M.C. Honey, Salisbury, Md. 21801. I am using an arithmetic chart because I want to show distance or ground covered by the Dow, not percentages.
“The 50% Principle states the following: After an extended advance, the termination point of the ensuing correction should be watched carefully. If the correction can halt while retaining 50% or more of the previous advance, it is a positive indication, and there is a good chance that movement will rally to test the area of the high again. Conversely, if the correction wipes out more than 50% of the previous extended advance, it is a negative indication, and there is a good chance that the movement will continue down, ultimately testing the area from which the entire advance started.
“It should be remembered that this is a theory, and although it has worked many times in the past there is nothing immutable about this theory (or observation, if you wish to call it that). Second, the 50% Principle should not be applied to short-term movements; it should only be applied to major movements lasting six months to a year or many years.

“There are two important applications of the 50% Principle which may be coming into prominence. First, referring to the chart, note that the Dow has broken the long-term trendline connecting the 1953 and 1962 bottoms. This is obviously a bearish indication, suggesting a reversal of the entire rising trend since 1949. The fact that this occurred within the framework of a primary bear markets makes the penetration of the trendline doubly significant. I do not believe, in other words, that this was a “false” penetration.
“If we measure advance, in the 1962 low of 535.76 on the Dow to the final 1966 peak of 995.15, we note that the movement carried 460 points. The halfway point of the 1962 to 1966 rise was thus 765. This means that during the 1966 and again during the most recent decline the Dow decisively broke the 50% level. The implication under the 50% Principle is that the Dow will probably test the area from which the movement began, or the 1962 area of 535. Whether this will happen remains to be seen, but at any rate that is the implication of the 50% Principle.
“The second important consideration is that the entire primary bull market covered a distance of 834 point; from the 161.60 of 1949 to 995.15 of 1966. The halfway point of the whole bull market rise is thus 578. I feel that if the Dow breaks to lower levels, it will be important to see what happens if and when 578 is approached.
“If a bottom can be formed at or above 578, particularly during a period which shows third phase characteristics, it will be a positive sign. Conversely, if 578 is decisively penetrated, I would take it as a most bearish and tragic sign. If 578 is broken decisively on the downside, my guess is that the final bottom of the bear market will arrive at an area far lower than anyone now thinks possible. (source: Russell, Richard. Dow Theory Letters. May 1, 1970. Page 3. www.dowtheoryletters.com)”
After the May 1, 1970 article by Richard Russell, the Dow Industrials had the following performance:

On December 6, 1974, the Dow Jones Industrial Average closed at 577.60. After this point, the Dow Industrials never closed lower. In the January 2, 1975 issue of the Dow Theory Letters, Russell said the following:
“Unless both Averages now break to new lows (Industrials below 577.60, Transports below 125.93) history will record October 3 as the bottom for the bear market (although December 6 will stand as the low day for the D-J Industrial Average alone).”
The 50% Principle is a necessary tool for all investors to gauge how much a decline is expected to run it’s course in the worst case scenario. A conservative investor should make use of the 50% Principle as a means of determining downside risk. With this in mind, the expectation is that at some point the stock (or index) will decline by nearly –50%. The 50% Principle sets the framework for how to interpret the price action from almost any prior peak.
In a roundabout way, even Charlie Munger, Warren Buffett’s long-time investment partner, considers the prospect of a decline by –50% in the following commentary:
“I think you can argue that if you’re not willing to react with equanimity to a market price decline of 50% two or three times a century you’re not fit to be a common shareholder and you deserve the mediocre result you’re going to get, compared to the people who do have the temperament who can be more philosophical about these market fluctuations.”
The 50% Principle Today
Below is the current 50% Principle for the Dow Jones Industrials Average.

While falling to 11,561.85 isn’t required, it doesn’t hurt to have a sense of the downside risk. Additionally, as the Dow goes higher, the level for the 50% Principle will increase. A retest of the ascending trendline should be expected at minimum.
Posted in 50% principle, Dow Fair Value
Watch List Performance Review
In our ongoing review of the NLO Dividend Watch List, we have taken the top five stocks on our list from January 11, 2013 (found here) and have checked their performance one year later. The top five companies on that list can be seen in the table below.
| Symbol | Name | 2013 Price | 2014 Price | % change |
| MSFT | Microsoft Corporation | 26.83 | 36.04 | 34.3% |
| NJR | New Jersey Resources Corp. | 39.53 | 45.97 | 16.3% |
| WEYS | Weyco Group | 22.76 | 28.63 | 25.8% |
| FDS | FactSet Research Systems | 88.87 | 106.81 | 20.2% |
| ED | Consolidated Edison | 55.91 | 54.33 | -2.8% |
| Average | 18.8% | |||
| DJI | Dow Jones Industrial | 13,488.40 | 16,437.05 | 21.9% |
| SPX | S&P 500 | 1,472.05 | 1,842.37 | 25.2% |
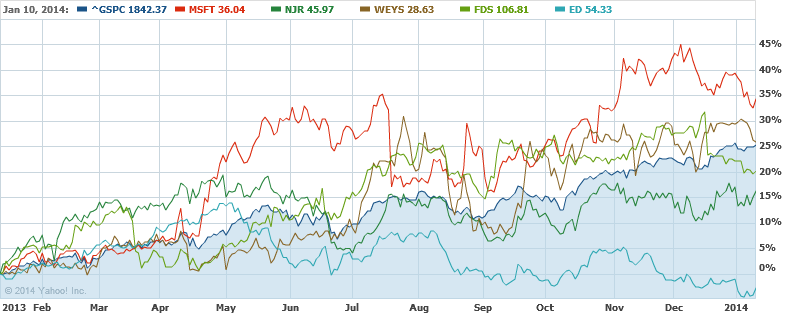
Our top five performed well considering the lagging utility sector. However, we did anticipate that this would occur since rates started to rise last year with the following commentary:
"Utility companies have been the lagging industry and this week is no exception. Two companies remained in the top five, New Jersey Resources (NJR) and Consolidated Edison (ED). Both companies yield exceed 4% but payout ratio is somewhat elevated at more than 60%. A surge in interest rates could significantly affect the short-term prospects of companies in the utility sector."
Microsoft (MSFT) performed as anticipated when we gave the following analysis:
"Technically, MSFT has been range bound between $26.50 to $27.50 since November. The bottoming process has begun in our view and as noted in the Nasdaq watch list commentary, we recommend buying in two stages."
What we said about Microsoft (MSFT) turned out to be fair analysis as the stock outperformed the market by a decent margin.
U.S. Dividend Watch List: January 10, 2014
Below are the 27 companies on our U.S. Dividend Watch List that are on our radar.
Performance Review
Below is the performance of the eight stocks from the January 11, 2013 Nasdaq 100 watch list (found here) compared to the performance of the Nasdaq 100 Index.
|
Symbol
|
Name | 2013 | 2014 | % change |
| MSFT | Microsoft Corp | 26.83 | 36.04 | 34.33% |
| DLTR | Dollar Tree, Inc. | 38.12 | 55.89 | 46.62% |
| BBBY | Bed Bath & Beyond | 56.27 | 69.94 | 24.29% |
| TEVA | Teva Pharmaceutical | 38.06 | 41.87 | 10.01% |
| VOD | Vodafone Group | 26.59 | 38.69 | 45.51% |
| PAYX | Paychex, Inc. | 31.78 | 44.37 | 39.62% |
| NVDA | NVIDIA Corporation | 12.21 | 15.73 | 28.83% |
| CA | CA Technologies | 23.34 | 34.02 | 45.76% |
| 34.37% | ||||
| ^NDX | NASDAQ-100 | 2,748.26 | 3565.08 | 29.72% |

On average, the watch list from last year gained +34.37%. This is contrasted with the Nasdaq 100 gaining an average of +29.37%. Of the top five stocks on our list, only Teva Pharmaceutical (TEVA) did not exceed the performance of the Nasdaq 100 throughout the year. Additionally, Bed Bath and Beyond (BBBY) outpaced the Nasdaq 100 until recently. Dollar Tree (DLTR) registered the best performance for the entire list even though the stock is down –7.35% from the November peak.
January 10, 2014 Nasdaq 100 Watch List
Below are the six Nasdaq 100 companies that are on our radar with the analyst estimates of downside risk for the coming year.
Posted in Nasdaq 100 Watch List
Gold and gold stocks, based on the Philadelphia Gold & Silver Index, was unchanged for the week.
On January 8, 2014, we carried out the following transaction(s):
On January 7, 2014, we carried out the following transaction(s):
Below are the 23 companies on our U.S. Dividend Watch List that are on our radar. Stocks that appear on our watch lists are not recommendations to buy. Instead, they are the starting point for doing your research and determining the best company to buy. Ideally, a stock that is purchased from this list is done after a considerable decline in the price and rigorous due diligence.
This week, gold increased +1.70% while gold stocks, as represented by the Philadelphia Gold and Silver Index (XAU), increased +3.61%. Our Gold Stock Indicator (GSI), is indicated in the chart below:
On January 2, 2014, we carried out the following three transactions:
Below is a chart of how our investment portfolio performed against the S&P 500 index and the 30-year Treasury based on the January 3, 2013 rate (found here).

Our portfolio exceeded the guaranteed rate (30-yr treasury) by almost six times. However, the S&P 500 exceeded our 2013 return by nearly double.
Below is the cumulative performance of our investment strategy since 2006 when we codified our investment approach in the last quarter of 2005. We have compared our performance to the indexes indicated, based on $10,000 invested over the subsequent period of time.
|
Year
|
Dow Indu. | $10,000.00 | S&P 500 | $10,000.00 | Nasdaq | $10,000.00 | NLO | $10,000.00 |
| 2006 | 16.29% | $11,629.00 | 15.74% | $11,574.00 | 9.52% | $10,952.00 | 18.30% | $11,830.00 |
| 2007 | 6.43% | $12,376.74 | 5.46% | $12,205.94 | 9.81% | $12,026.39 | 19.80% | $14,172.34 |
| 2008 | -33.84% | $8,188.45 | -37.22% | $7,662.89 | -40.54% | $7,150.89 | 14.35% | $16,206.07 |
| 2009 | 18.82% | $9,729.52 | 27.11% | 9,740.30 | 43.89% | $10,289.42 | 36.65% | $22,145.60 |
| 2010 | 11.02% | $10,801.71 | 14.32% | $11,135.11 | 16.91% | $12,029.36 | 7.14% | $23,726.79 |
| 2011 | 5.53% | $11,399.05 | 0.00% | $11,135.11 | -1.80% | $11,812.83 | 6.20% | $25,197.85 |
| 2012 | 7.26% | $12,226.62 | 16.20% | $12,939.00 | 15.91% | $13,692.25 | 7.80% | $27,163.28 |
| 2013 | 26.50% | $15,466.67 | 31.90% | $17,066.54 | 38.30% | $18,936.38 | 19.00% | $32,324.30 |
Posted in Performance Review
This week, gold increased +1.54% while gold stocks, as represented by the Philadelphia Gold and Silver Index (XAU), increased +4.56%. Our Gold Stock Indicator (GSI), is indicated in the chart below:
Below are the 18 companies on our U.S. Dividend Watch List that are on our radar. Stocks that appear on our watch lists are not recommendations to buy. Instead, they are the starting point for doing your research and determining the best company to buy. Ideally, a stock that is purchased from this list is done after a considerable decline in the price and rigorous due diligence.