Below are the valuation targets for ASML Holdings N.V. (ASML) for the next 10 years. Continue reading
- Japan
- Market Indicator
- Price Momentum Indicators
- Richard Russell
- Silver
- Speed Resistance Lines
- U.S. Dividend Watch List

Below are the valuation targets for ASML Holdings N.V. (ASML) for the next 10 years. Continue reading
Below are the valuation targets for Unilever N.V. (UN) for the next 10 years. Continue reading
On November 30, 1977, Richard Russell of the Dow Theory Letters said the following:
"Bill Bretz, editor of the excellent new Juncture Recognition report (Box 1209. Pompano Beach, FL 33061), has just presented a fascinating sentiment study, the Dow vs. the University of Michigan Consumer Sentiment Index. Normally, says Bill, consumer sentiment and stock prices have a long-term influence on each other. And the chart does show this interesting correlation. But in the recent 214 point decline in the Dow, consumer sentiment has stayed bullish. Says Bretz, “The market has never fallen so far in an atmosphere of such total unconcern...I can't help but wonder how far down the Dow will have to go in order to produce the kind of fright that is the hallmark of an important market bottom.” (Russell, Richard. Dow Theory Letters. November 30, 1977. page 5.)."

As we highlighted in our article titled Dow’s Theory on Consumer Sentiment dated April 1, 2019:
“…when we change the data for each indicator to reflect the percentage change from the prior year, we get a useful representation of the data that is relative to each indicator that can also be compared to one another.”
Let’s look at the same indicators on a monthly basis and see if the year-over-year percentage change provides a better perspective on the topic.

When viewed on a year-over-year percentage change basis, the period in question, from the 1976 peak to November 1977, the two indicators had the most correlation of a peak and decline up to that point since 1964.
When presented in this fashion (y-o-y % change) we arrive at an answer to the question stated above by Bretz:
“…how far down the Dow will have to go in order to produce the kind of fright that is the hallmark of an important market bottom.”
In fact, the Dow Jones Industrial Average (DJIA) and the University of Michigan Consumer Sentiment Survey (UMCSENT) did not need much in the way of declining to match each other as both indicators were well on their way to bottoming out, with the DJIA reversing to the upside well before the UMCSENT.
“If a pickpocket meets a saint, he sees only his pockets.” -Hari Dass Baba.
(Russell, Richard. Dow Theory Letters. April 9, 1975. page 1.)
Posted in Quote of the Day
Below is the monthly New York Times Recession/Depression Index from January 2000 to March 2019.

Visit our December 30, 2018 explanation of this index (found here).
On January 15, 2016, we said the following in our conclusion to our Dow Theory assessment:
“What are we looking for from Dow Theory now? We’re hoping that the Dow Jones Industrial Average can decline below the August 2015 low to confirm what the other indexes have already done. Additionally, we’re looking for the INDPRO to continue its trend lower to confirm that we are in a recession and a bear market. We think that if we are in a recession, the NBER will label either the December 2014 or August 2015 peaks as the beginning of a recession in approximately six to nine months from now.”
On September 30, 2018, in a New York Times article titled “The Most Important Least-Noticed Economic Event of the Decade” said the following:
“Sometimes the most important economic events announce themselves with huge front-page headlines, stock market collapses and frantic intervention by government officials.
“Other times, a hard-to-explain confluence of forces has enormous economic implications, yet comes and goes without most people even being aware of it.
“In 2015 and 2016, the United States experienced the second type of event (Irwin, Neil. "The Invisible Recession of 2016." New York Times Sep 30 2018, Late Edition (East Coast) ed. ProQuest. 3 Apr. 2019 .).”

As time passed, and after not getting a recession call from the National Bureau of Economic Research, we rationalized away, or pushed back the expected date of a recession call. It was not until reading this article from the New York Times were we able to realize that our initial take was accurate and timely.
Posted in Dow Theory, recessions
Below are the valuation targets for Banner Corp. (BANR) for the next 10 years. Continue reading
Below are the valuation targets for Oxford Industries (OXM) for the next 10 years. Continue reading
The NLO team executed the following transaction(s): Continue reading
Consumer Sentiment and its Predictive Role
Consumer sentiment seems to be an arbitrary measure for deciding if the economy will grow or contract. However, having a reliable measure of consumer sentiment can aid in future planning for spending and investment. As outlined on Investopedia.com and reviewed by Will Kenton on January 26, 2018:
“Consumer sentiment is a statistical measurement and economic indicator of the overall health of the economy as determined by consumer opinion. Consumer sentiment takes into account an individual's feelings toward his or her current financial health, the health of the economy in the short term and the prospects for longer-term economic growth.”
It is our contention that consumer sentiment indications coincide with, and potentially follow, markets. The work of Charles H. Dow on the topic of sentiment of large banks, large speculators and small investors is said to have far reaching implications for short and long term expectations of the American economy. Dow says:
“Wall street will undoubtedly discount the turn in the industrial situation, but the people who discount it too long ahead may have to extend their notes. (Sether, Laura. Dow Theory Unplugged: Charles Dows Original Editorials & Their Relevance Today. W & A Publishing, 2009. page 170.)”
“As the stock market is always an effect and never a cause, it must respond to these conditions. As, however, the stock market, while an effect, is also a discounted effect, the decline in prices of stocks usually anticipates decline in prices of stocks usually anticipates decline in commodities, because operators for a fall sell in anticipation of the changes which they foresee in business conditions. (Sether, Laura. Dow Theory Unplugged: Charles Dows Original Editorials & Their Relevance Today. W & A Publishing, 2009. page 201.)”
In the years when Dow was writing on markets and their participants, the general public was not widely involved in stock speculation and investment. However, the activity of business owners, market operators and bankers and their decisions within the stock market reflected future business change whether higher (expansion) or lower (contraction).
Before getting into the details of consumer’s short-term and long-term views on economic prospects for growth, we need to cover the topic of the official accounting of recessions and expansions in the U.S. economy as presented by the National Bureau of Economic Research (NBER).
Periods of Expansion and Contraction
In the charts that follow, indications of the beginning and end of a recession are clearly noted in the gray vertical bands. The announcement of an end to a recession is usually indicated from six months to a year after the actual event by the National Bureau of Economic Research.
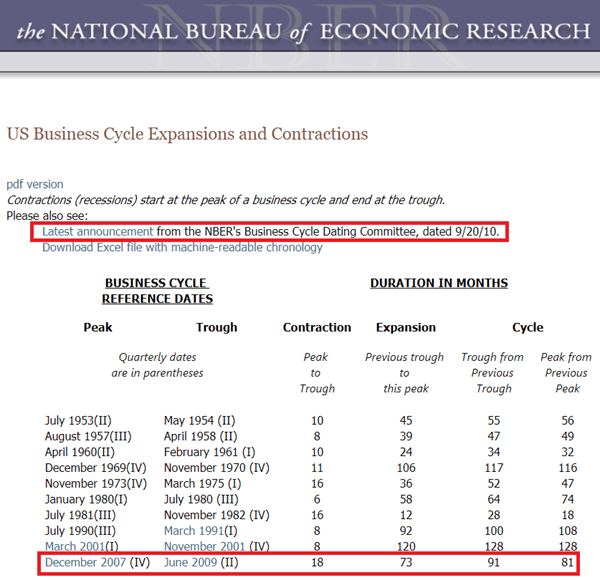
In the above business cycle data from 1953 to the present, we find that the “latest announcement” from the NBER’s Business Cycle Dating Committee was published on September 20, 2010 and said the following:

It was not until 15 months after June 2009 end of the recession that the organization responsible for all the gray vertical bands on every chart of economic data was able to inform the public that the economy had turned from recession to expansion. With the understanding of the lag that exists when waiting for the call on a recession or expansion, from the National Bureau of Economic Research, we can easily see why it is necessary to look for other sources as possible indicators on the economy.
Another concern is that the National Bureau of Economic Research seems to have arbitrary nature of a recession. There are periods when each indicator discussed in the outline declines significantly and reverses but there is no indication of a recession by the National Bureau of Economic Research. Naturally, the two indicators that we cover are not the only attributes that go into the calculation of a expansion or contraction. However, for now, we’ll presume that the University of Michigan Consumer Sentiment Survey (UMCSENT) and the Dow Jones Industrial Average (DJIA) are key indicators of consumer sentiment and accurate reflections of economic conditions.
DJIA as a Consumer Sentiment Indicator
Much of the work of Charles H. Dow was based on core economic principles that are currently taken for granted in U.S. monthly reports of economic activity. One area that Dow worked diligently on was the insights of markets as a reflection of general public sentiment for future expectations. According to Dow, sentiment was demonstrated through the stock market indexes that currently bear Dow’s name in the form of the Dow Jones Industrial Average (DJIA), Dow Jones Transportation Average, and Dow Jones Utility Average.
In the “Review and Outlook” of the Wall Street Journal dated April 21, 1899, Dow said the following of changing consumer sentiment, as a reflection of the “general conditions”:
“The time involved in theses turns is determined by natural causes. The change is that the stock market reflects general conditions and it takes years for such a change for the better or for the worse to work its way through the community, so that the mass of people are either optimistic or pessimistic in their views. Some people foresee changes in the situation much quicker than others, but it takes a change of opinion on the part of millions of people to produce a well defined sentiment throughout the country. (Dow, Charles H. Review and Outlook. Wall Street Journal. April 21, 1899.)”
The general conditions is a reference to the overall economy and is reflected in sentiment throughout the United States.
“The market continues broad with an upward tendency. There is constant realizing, some of it on a large scale, but the largest interests give support when it is needed and then by judicious stimulation of one stock or another bring enough buying to retain and slowly increase bull sentiment. A great many people are buying stocks with the expectation of having to run in a great hurry on some unfavorable news before the election. Some of these people sell on the small declines that come along, but buy their stocks back again the next day, when it transpires that the dreaded slump has not yet arrived. Perhaps the large operators play a little on this condition of sentiment. (Dow, Charles H. Review and Outlook. Wall Street Journal. October 25, 1900.)”
At a time when telephones were not widely dispersed to survey the attitudes and opinions of the general public, Dow was able to infer behavior through the activity of the stock market, the most readily available real-time source for sentiment.
From 1899 to 1902, Charles H. Dow wrote in great detail of the intent and impact of individuals and their behavior and how it was a predictor of the direction of the economy. This was the basis of Dow’s creation of the indexes that still bear his name, more than 120 year later. However, since the 1940’s, there has been a more relied upon source for the sentiment of consumers.
University of Michigan Consumer Sentiment Survey
In the 1940’s, professor George Katona introduced the Survey of Consumer Finances, with the backing of the Federal Reserve Board, which outlined the views that consumers views on future spending can act as a possible leading indicator of economic activity.
The adoption of the survey for the purpose of determining expectations and intentions of consumers ultimately led to what we currently know as the University of Michigan Consumer Sentiment Survey. The survey is conducted through calling over 500 households to determine their preferences and expectations for the future.
It is very important to understand that getting to the point where a phone survey with 50 questions is used to determine the attitudes and opinions of consumers wasn’t an easy process. Chief among the critics of consumer surveys, initially, was the Federal Reserve Board, the very institution that was funding the project.
It took considerable effort on the part of professor George Katona to impart the value of collecting the necessary survey data. In addition, competing surveys, vying for funding and prestige, sprung up attempting to garner more attention and better outcomes. In the end, inertia and lack of better results led to Katona’s Consumer Sentiment Survey to become the preeminent survey in the nation.
University of Michigan Consumer Sentiment Survey: January 1978 to January 2019

According to Richard Curtin’s “George Katona: A Founder of Behavioral Economics”:
“Perhaps the most interesting postscript to the debates of the 1950's is what has proven to be an effective leading indicator over the next half century. The presumed predictive ability of purchase intentions data was tested using large samples and with probability measures by the U.S. Census Bureau in the 1960's. These surveys were discontinued due to its poor predictive performance, although the debates it spanned were also contentious (McNeil, 1974; Curtin, 2004; Dechaux, 2015). In contrast, the approach advocated by Katona has not only survived to this day in the U.S. but has been replicated by six dozen other countries in every inhabited continent in the world (Curtin, 2005). In the U.S. as in most other countries, consumer sentiment measures are recognized as leading economic indicators based on their predictive performance (for a summary, see Curtin, 2005). Notably, the predictive performances of Katona’s measures were at their very best at the most critical times: when the economy was about to turn from expansion to contraction, or visa-versa.(Curtin, Richard. George Katona: A Founder of Behavioral Economics).”
The strength of the University of Michigan Sentiment Survey surrounds the idea that “…the predictive performances of Katona’s measures were at their very best at the most critical times: when the economy was about to turn from expansion to contraction, or visa-versa.” As with the stock market, this ideas is particularly challenging in the moment and abundantly clear well after the fact.
UMCSENT versus DJIA
When viewed from the perspective of the absolute change in each indicator, we find that there is little difference between the stock index over the consumer sentiment indicator.
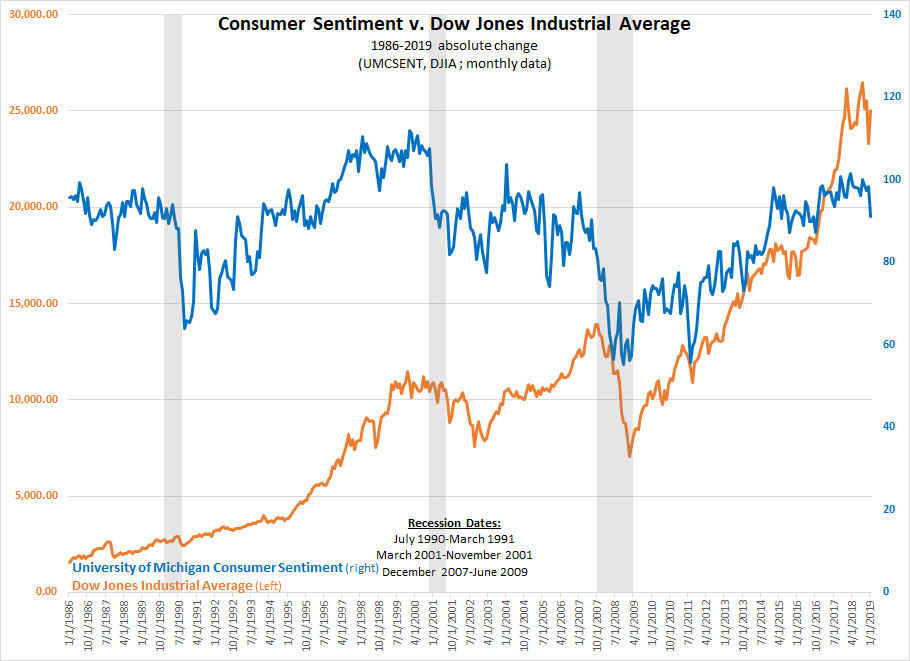
In both cases of the absolute change, the absence of a range makes it difficult to determine when a level has gone “too high” or “too low” or nearing a reversal. However, what does stand out in the DJIA is that the beginning of the recession is at or near a relative peak and the low appears within the recessionary period. In the case of the University of Michigan Sentiment Survey, a low is achieved within a recession but a relative peak does not occur at or near the beginning of a recession as cited earlier. This gives the Dow Jones Industrial Average a more meaningful indication of when a recession might begin as well as when it might end.
When reflected on a monthly basis from 1976 to 2019, the transition from expansion to contraction isn’t as clear as suggested by Richard Curtin. If measured by the amount of time (in months) from the peak to the beginning of a recessionary period, the shortest amount of time from the peak in the University of Michigan Sentiment Survey is eight months.

Even if we were to take out the UMCSENT peak of September 1984 (71 months), the average length of time would be reduced from 34 months to 20 months, or nearly double that of the DJIA. This makes it difficult to highlight the predictive value at the peak, when in some cases, the amount of time after the top could be almost six years for UMCSENT.
Overall, a simple comparison between the University of Michigan Consumer Sentiment Survey and the Dow Jones Industrial Average on an absolute basis is not easy. After all, when we look at data numbers for the University of Michigan Consumer Sentiment Survey of 93.8 for February 2019 and the Dow Jones Industrial Average at 25,928.68, as of March 29, 2019, there is little relationship that can be made.
However, when we change the data for each indicator to reflect the percentage change from the prior year, we get a useful representation of the data that is relative to each indicator that can also be compared to one another. In the chart below, from 1953-2019, we can see that at the trough of each recession both indexes, the University of Michigan Consumer Sentiment Survey and the Dow Jones Industrial Average, experienced relative lows and reversals within the recessionary period.
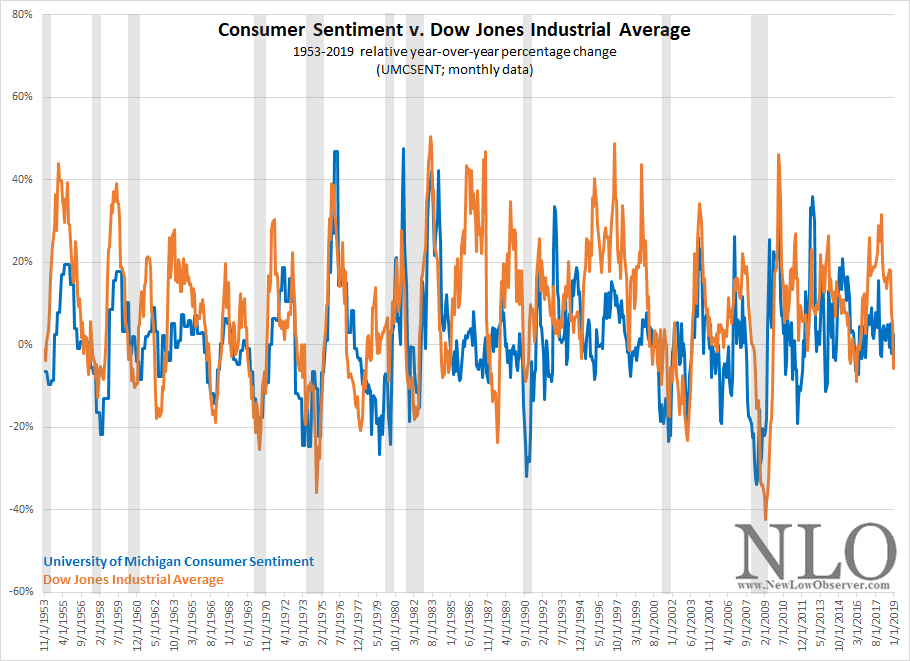
In the recession from 1990-1991 & 2001, the University of Michigan Consumer Sentiment Survey gave a better indication of a low and reversal as it was not followed by a lower level in a short period of time afterwards. In the case of the Dow Jones Industrial Average, a significant low was achieved on August 1988 and March 2003. We would consider the DJIA indications to be a failure of predictive value for the recessions of 1990-1991 and 2001.
The recession from January 1980 to July 1980 saw both the DJIA and UMCSENT fail to achieve a low and reversal within the designated recessionary period. However, The University of Michigan Consumer Sentiment Survey provided the closest approximation of a low and reversal nearest the recession period.
Of the 10 recessionary periods from 1953 to 2019, the University of Michigan Consumer Sentiment Survey coincided with relative lows within a recession 90% of the time. Meanwhile, the Dow Jones Industrial Average, over the same period had relative lows 80% of the time. This is a clear distinction between the two indicators. However, in either case, relative lows don’t say much when we considering that the low during the recession of 1960 is distinctly different than the lows of 1974 or 2009.
As indicated earlier, the University of Michigan Consumer Sentiment Survey and its forerunner, the Survey of Consumer Finances, began in and around the 1940’s or 1950’s. With a 90% track record for achieving a low and reversal within a recession, that is a track record that is hard to beat. However, let's look at how the Dow Jones Industrial Average performed from 1897 to 1950.
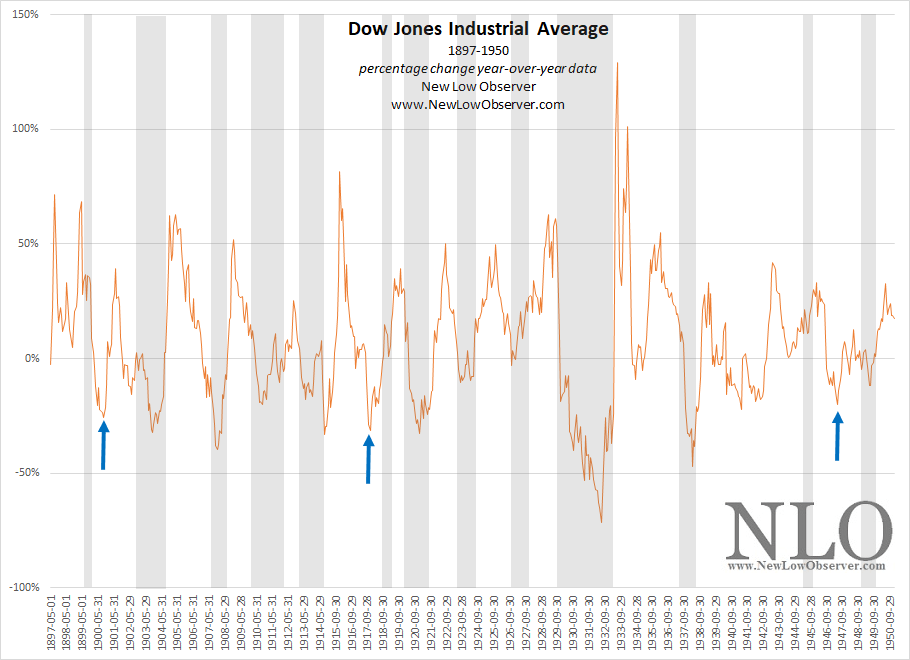
Of the 13 instances of a recession from 1897 to 1950, the Dow Jones Industrial Average experienced a relative low within a recessionary period 76% of the time. In three instances, the DJIA managed to be in an established rising or declining trend, as indicated by the blue arrows , which we consider to be a failure of predictive value.
The Roots and the Tree
It has been said that the roots of a tree are equal to, or greater than, what is seen above ground. For a homebuilder, when planning the placement of trees, they need to understand the impact of both what is appealing above ground and the implications of the roots and the damage it can cause to the foundation and pipes underground.
Looking at the University of Michigan Sentiment Survey is like enjoying what is above ground while disregarding what also goes on underground. It could be argued that the high level of certainty in the University of Michigan Sentiment Survey, at nearly 90% or above in reversing from a low, is exactly what a consumer or business owner would need for short or long term planning. However, in spite of the quality in the accounting for the reversals at the low, the University of Michigan Sentiment Survey has some short-comings when providing timely indications of a reversal from a peak in the economy. This leaves half of the equation unresolved.
In spite of the DJIA’s significantly lower level of consistency at designated reversals (76% to 78%) from the low, there are considerable benefits in the index arriving at a reversal indication at both the low and high ends of the spectrum. On the whole, Dow’s writing reflected current and future financial conditions which to this day works as a useful indicator of consumer sentiment.
See Also:
Supplemental Material:
Sether, Laura. Dow Theory Unplugged: Charles Dows Original Editorials & Their Relevance Today. W & A Publishing, 2009. page 190.
"There is a pronounced difference between bull markets that are made by manipulation and those that are made by the public. The former represent the effort of a small number of persons; the latter reflects the sense of country on values. It is possible to create a limited public sentiment by manipulation, but the sentiment that endures and sweeps away the strongest interests which oppose it is invariably founded upon general conditions which are sufficiently universal and sufficiently potent to affect the opinions of practically everybody.(Dow, Charles H. Review and Outlook. Wall Street Journal. April 24, 1899.)."
Sether, Laura. Dow Theory Unplugged: Charles Dows Original Editorials & Their Relevance Today. W & A Publishing, 2009. page 130.
”A third factor in estimating the duration of the bull market is the condition of public sentiment. That sentiment is the best indication of the condition of the thousands of lines of business in which the public is engaged. (Dow, Charles H. Review and Outlook. Wall Street Journal. April 25, 1899.)."
Sether, Laura. Dow Theory Unplugged: Charles Dows Original Editorials & Their Relevance Today. W & A Publishing, 2009. page 23.
"The market no longer moves together. On some days, the industrial list has declined while the railway list has advanced. This might easily grow out of a change in speculative sentiment which led operators to buy the railroads and sell industrials. The fundamental reason for doing this would be that the railway list has not been greatly expanded in recent years. There has been little addition to the volume of railway stocks except through the medium of reorganization. The growth of the business of the country accrues on the old stocks (Dow, Charles H. Review and Outlook. Wall Street Journal. May 31, 1899.)."
Sether, Laura. Dow Theory Unplugged: Charles Dows Original Editorials & Their Relevance Today. W & A Publishing, 2009. page 69.
"There can be no doubt about the bullish character of the stock market. Its present activity and strength are the result of a full appreciation of the splendid condition of the country from nearly all standpoints. It is often said that the stock market discounts a change in the condition of business. This may usually be the case, but in this instance the bullish sentiment is more in the nature of the appreciation of a result. Prices of commodities and manufactured product are on a higher and firmer basis than ever before and it is not strange that the prices of securities representing them should also seek a higher level of value (Dow, Charles H. Review and Outlook. Wall Street Journal. November 3, 1899.)."
Sether, Laura. Dow Theory Unplugged: Charles Dows Original Editorials & Their Relevance Today. W & A Publishing, 2009. page 136.
"Sustained sentiment lasts for months. The sustained sentiment of the public in a belief that the market is going to be better or going to be worse is one of the most powerful factors in speculation. and when it is widespread Will defeat the strongest speculative combinations which may be working against it. "Everybody," said Mr. Vanderbilt. from experience "is stronger than anybody. (Dow, Charles H. Review and Outlook. Wall Street Journal. December 30, 1899.)."Sether, Laura. Dow Theory Unplugged: Charles Dows Original Editorials & Their Relevance Today. W & A Publishing, 2009. page 70.
"The large operator is of necessity a close student of existing conditions in their relation to money, business, politics and public sentiment over the civilized world.(Dow, Charles H. Review and Outlook. Wall Street Journal. January 8, 1900.)."Sether, Laura. Dow Theory Unplugged: Charles Dows Original Editorials & Their Relevance Today. W & A Publishing, 2009. page 103.
"We referred some days ago to the fact that the market was controlled by sentiment, manipulation and business conditions as they worked out in the form of increasing or decreasing value of railway and industrial stocks. (Dow, Charles H. Review and Outlook. Wall Street Journal. January 15, 1900.)."Sether, Laura. Dow Theory Unplugged: Charles Dows Original Editorials & Their Relevance Today. W & A Publishing, 2009. page 103.
"This movement of the market is made, to considerable extent, by professional traders who are influenced chiefly by sentiment. (Dow, Charles H. Review and Outlook. Wall Street Journal. January 15, 1900.)."Sether, Laura. Dow Theory Unplugged: Charles Dows Original Editorials & Their Relevance Today. W & A Publishing, 2009. page 253.
"The main speculative question is whether the market is likely to have its spring rise from about this level or whether there will be first some days or weeks of decline. Large operators are divided on this point and commission houses are not clear. Those who are definite in their predictions disregard to a large extent the facts presented by the opposing side. It is clear from this that the street is not at all a unit in its forecast and this will probably have a tendency to keep the market rather narrow until sentiment begins to lean definitely to one side or the other. (Dow, Charles H. Review and Outlook. Wall Street Journal. January 18, 1900.)."Sether, Laura. Dow Theory Unplugged: Charles Dows Original Editorials & Their Relevance Today. W & A Publishing, 2009. page 33.
"There have been essential changes in rates for money, although falling bank reserves have exerted a little influence on sentiment (Dow, Charles H. Review and Outlook. Wall Street Journal. March 5, 1900.)."Sether, Laura. Dow Theory Unplugged: Charles Dows Original Editorials & Their Relevance Today. W & A Publishing, 2009. page 108.
"The establishment of a gold standard has had a good effect on sentiment abroad as far as increasing purchases of American stocks are concerned, and a still greater effect may be felt her¢after. (Dow, Charles H. Review and Outlook. Wall Street Journal. April 28, 1900.)."Sether, Laura. Dow Theory Unplugged: Charles Dows Original Editorials & Their Relevance Today. W & A Publishing, 2009. page 46.
"The market continues broad with an upward tendency. There is constant realizing, some of it on a large scale, but the largest interests give support when it is needed and then by judicious stimulation of one stock or another bring enough buying to retain and slowly increase bull sentiment."A great many people are buying stocks with the expectation of having to run in a great hurry on some unfavorable news before the election. Some of these people sell on the small declines that come along, but buy their stocks back again the next day, when it transpires that the dreaded slump has not yet arrived. Perhaps the large operators play a little on this condition of sentiment. (Dow, Charles H. Review and Outlook. Wall Street Journal. October 25, 1900.)."
Sether, Laura. Dow Theory Unplugged: Charles Dows Original Editorials & Their Relevance Today. W & A Publishing, 2009. page 114.
"Large operators, especially if they are in for an extended campaign, a re always sorry to see too great confidence on the part of the public: as this always means pyramiding and the creation of a weak account which breaks down and makes trouble. It is, therefore, the part of wise manipulation to create enough uncertainly in regard to the course of the market to keep accounts within reason and at the same time maintain a strong bull sentiment. Something of this kind may be under way. (Dow, Charles H. Review and Outlook. Wall Street Journal. November 14, 1900.)."Sether, Laura. Dow Theory Unplugged: Charles Dows Original Editorials & Their Relevance Today. W & A Publishing, 2009. page 136.
"The market is governed by sentient, manipulation and facts. Sentiment rests on facts as they are supposed to exist, but the supposition is often wrong. Manipulation on a large scale is always in line with essential facts for the long run. but temporarily is often directly opposed to the facts. (Dow, Charles H. Review and Outlook. Wall Street Journal. December 30, 1899.)."Sether, Laura. Dow Theory Unplugged: Charles Dows Original Editorials & Their Relevance Today. W & A Publishing, 2009. page 136.
"It is evident, therefore, that whether speculation is considered from the standpoint of sentiment or of manipulation, it all comes back to a question of facts. The small operator who can foresee the facts correctly for next spring can trade in stocks with full confidence that he is doing very nearly what the largest operators are doing. (Dow, Charles H. Review and Outlook. Wall Street Journal. December 30, 1899.)."
sources:
The market continues to push off against the 2,800 level and rose more than +1% this past week. The number of companies appearing on our watch list this week continues to dwindle. Despite that, we believe that you can find a handful of companies that will fit your own personal investment criteria. Continue reading
Posted in Dividend Achiever Watch List, Dividend Achievers, Dividend Watch List
Tagged members
As the saying goes, “it is a recession when it happens to others and a depression when it happens to you.”
In the last “Great” Depression from 1929 to 1945, Americans were well aware of the pain and misery that was wrought on the nation. There are even some who wrongly claim that the only reason the United States got out of the “Great” Depression was World War II. Debates aside, below is a percentage change chart of the Dow Jones Industrial Average from 1929 to 1954, the period of time that it took for the index to get back to “break even.”

There is no debate among the average American or Harvard economist about when the last “Great” Depression occurred in the United States. However, when the exact same thing happens to one of our allies, it seem difficult for even the most esteem experts on the “Great” Depression to recognize the current depression simply because it isn’t happening to us.
That ally is Japan. To put our claim in context, we will show you the stock market of Japan as represented by the Nikkei 225 Index in exactly the same format as the Dow Jones Industrial Average above.
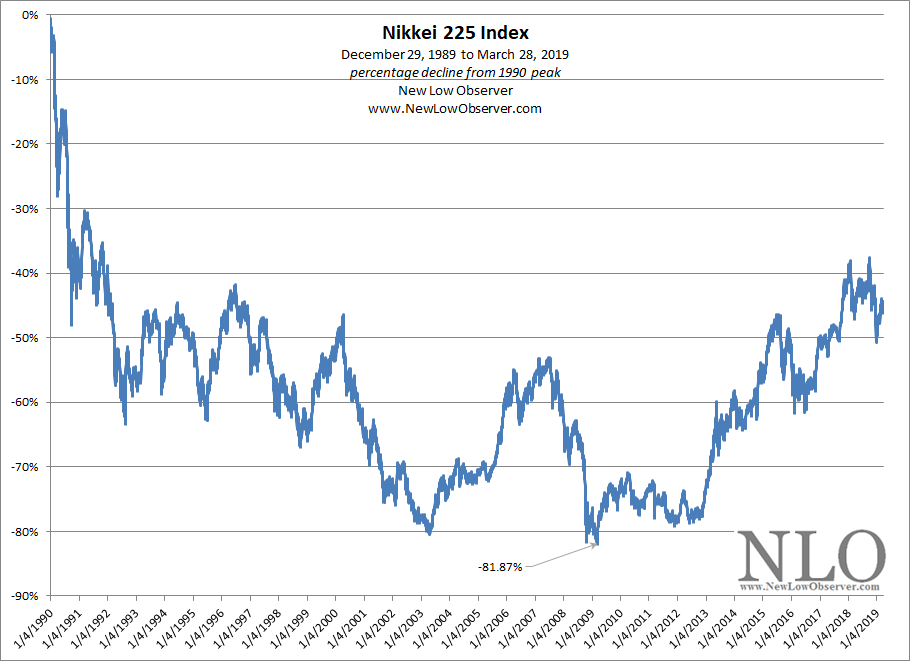
Someone please tell us that what Japan is going through isn’t a depression. We use the stock market as the most accurate real-time reflection of the economy, politics, and social well being, which is nothing new to long-time readers of our work.
Let’s reflect for a moment, in Japan from 1989 to 2008:
How is it possible, that a key measure of the health of a nation like Japan could suffer so much and not be recognized to be in an “Even Greater” Depression?
Look at the Dow Jones Industrial Average from 1929 to 1954 again. It took 25 years for the index to break even. Now look at the Nikkei 225 Index, it has already been 29 years and the index is still –40% below the prior peak.
Let’s take a brief refresher course on what was said of Japan prior to the decline of 1990, this from the Dow Theory Letters as published by Richard Russell and dated May 12, 1989:
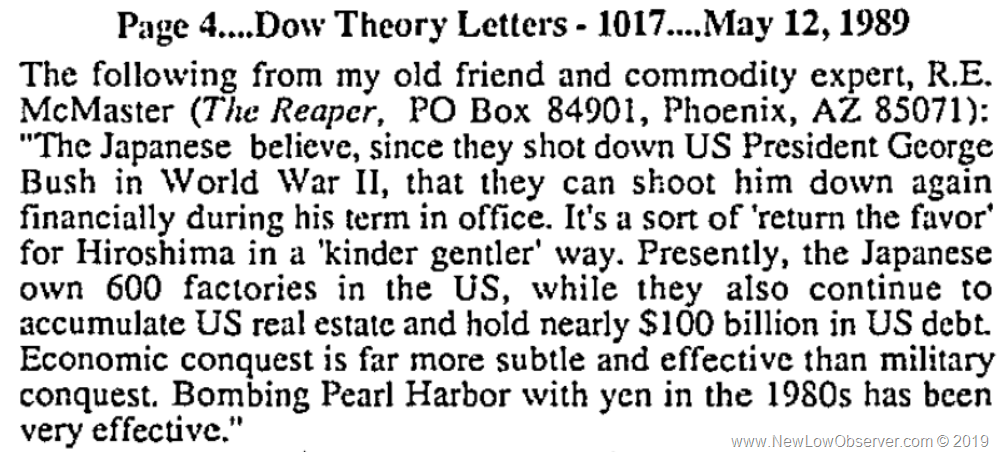
Or how about the following, dated October 18, 1989:

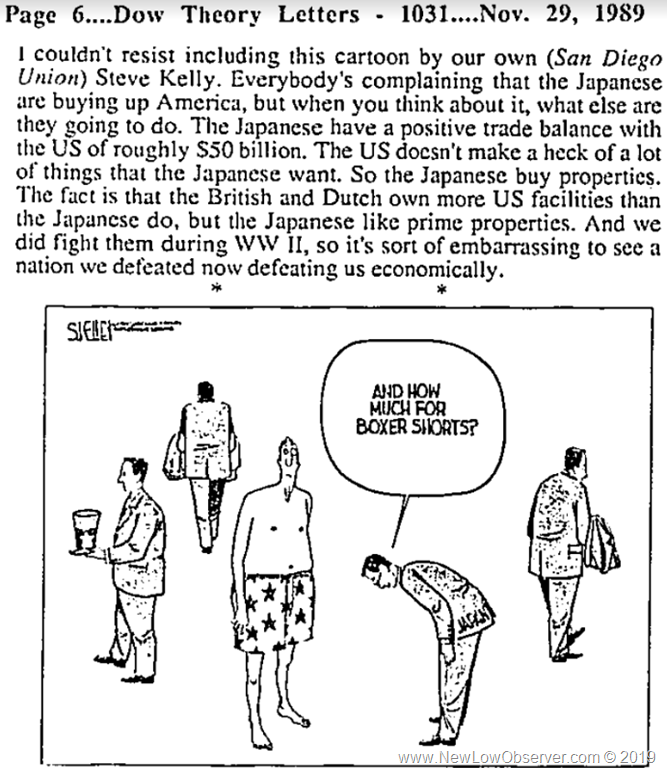
And this from November 29, 1989:
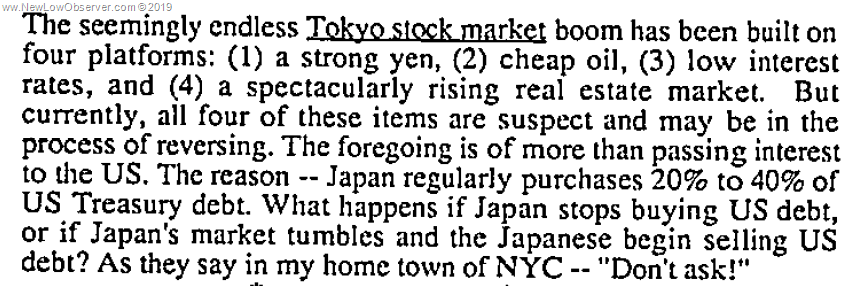
And finally, this from April 5, 1989:
It is not an uniquely American attribute to forget the past but to blithely walk past the “Even Greater” Depression within our midst while it impacts our ally is a brewing storm.
Investors, politicians, and citizens alike would do well to note the exact same (subtle and not so subtle) slights and invectives being lobbed around today. Meanwhile, due diligence is necessary to first acknowledge the plight of an ally and act in the interest of both nations before it is too late.
Posted in 1929, DJIA, interest rates, Japan, Nikkei, QE, Quantative Easing
Based on the closing price data of March 27, 2019, we have the following average year-to-date performance of the respective categories within the Dogs of the TSX 60 as compared to the year-to-data performance of the Toronto Stock Exchange.
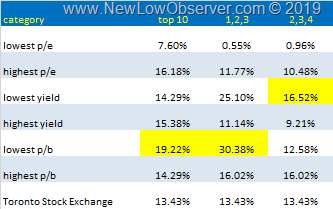
We’ve stated in the past that traditional valuation metrics do better with the Dogs of the TSX 60. However, the stocks with the lowest p/e ratio aren’t doing so well. Additionally, the odds on favorite in the highest yield group aren’t pulling in the returns (absent their dividend gains) that we would expect.
For now, the lowest p/b ratio stocks are taking the lead while the lowest yield stocks are managing to edge out the highest yield stock, overall. Remember, the highest yielding stocks are supposed to be the leaders in the returns category. As with the Dogs of the Dow strategy, the highest yielding stocks are turning into also-rans.
Below is the specific stocks and their respective performance which generated the listed returns for the specific categories (date range is December 31, 2018 to March 27, 2019). Continue reading
Since December 24, 2018, the Toronto Stock Exchange has increased by exactly the same amount as the Dow Jones Industrial Average. This is no small feat as the expectation is that a real estate bust is coming for the Canadian economy and Canadian banks are set to decline dramatically further as a result.
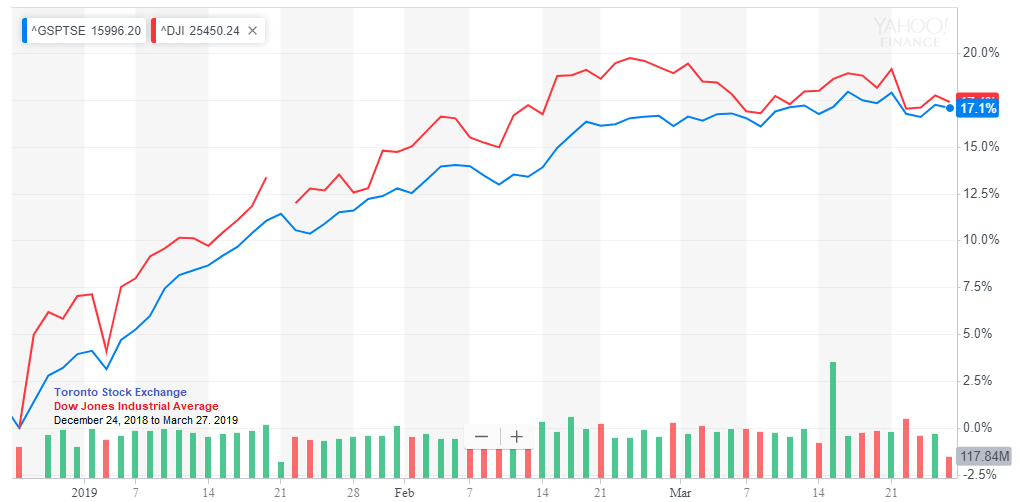
So far, the Toronto Stock Exchange is indicating that it is at a relative high compared to the period of 1996 to 2019. Based on a hypothetical dividend growth rate of 10%, The Toronto Stock Exchange has the following Altimeter and undervalued/overvalued ranges: Continue reading
There are many technical indicators traders and investors utilize in their decision making process. We have been exploring how effective one particular technical pattern is and have some surprising findings to share. The pattern in question is known as the Death Cross. A quick search will reveal the definition(s) of this particular pattern, and for our purpose, we will assume the following definition.
Death Cross - when a short-term moving averages (in our study 50-day) crosses below the long-term moving averages (in our study 200-day).
Before we go to the data and findings, there are additional assumptions we'd like to lay out.
Now that we've laid out the rules, the index we will focus on is the S&P 500. Anyone can replicate our study by downloading the historical price from Yahoo!Finance using the non-adjusted closing price.
According to a prominent investment site, the death cross is a technical pattern indicating a potential for a major selloff. The excerpt below came from the same site.
The death cross indicator has proven to be a reliable predictor of some of the most severe bear markets of the past century: 1929, 1938, 1974, and 2008.
Let's explore how reliable this indicator is. Since inception of S&P 500, we observed 30 instances of the death cross, 8 of which lead to a negative return after 253 trading days. This is a 27% success rate if you short sell the market. On the other hand, 73% of the time the market actually gained value in the same time frame. In our research, we saw an average gain of +6%, maximum gain of +31%, and largest loss at -42%. The table below provide a detail of all 30 transactions.
| Date | Short Selling Price | Buy to Cover Price | % Gain/Loss |
| 5/11/1953 | 24.91 | 28.72 | 15% |
| 10/26/1956 | 46.27 | 41.02 | -11% |
| 9/26/1957 | 42.57 | 49.66 | 17% |
| 10/30/1959 | 57.52 | 53.94 | -6% |
| 5/7/1962 | 66.02 | 70.01 | 6% |
| 7/22/1965 | 83.85 | 85.41 | 2% |
| 4/28/1966 | 91.13 | 93.84 | 3% |
| 2/27/1968 | 90.53 | 101.02 | 12% |
| 3/13/1969 | 98.39 | 87.29 | -11% |
| 9/24/1971 | 98.15 | 108.52 | 11% |
| 4/18/1973 | 111.54 | 93.75 | -16% |
| 12/1/1976 | 102.49 | 94.69 | -8% |
| 12/13/1978 | 96.06 | 107.67 | 12% |
| 4/22/1980 | 103.43 | 133.94 | 29% |
| 7/2/1981 | 128.64 | 107.65 | -16% |
| 2/3/1984 | 160.91 | 180.35 | 12% |
| 11/18/1986 | 236.78 | 245.55 | 4% |
| 11/5/1987 | 254.48 | 276.31 | 9% |
| 2/26/1990 | 328.67 | 362.81 | 10% |
| 9/7/1990 | 323.40 | 388.57 | 20% |
| 4/19/1994 | 442.54 | 505.29 | 14% |
| 9/29/1998 | 1,049.02 | 1,282.71 | 22% |
| 11/4/1999 | 1,362.64 | 1,426.69 | 5% |
| 10/30/2000 | 1,398.66 | 1,118.86 | -20% |
| 8/18/2004 | 1,095.17 | 1,219.02 | 11% |
| 7/19/2006 | 1,259.81 | 1,541.57 | 22% |
| 12/21/2007 | 1,484.46 | 863.16 | -42% |
| 7/2/2010 | 1,022.58 | 1,337.88 | 31% |
| 8/12/2011 | 1,178.81 | 1,403.93 | 19% |
| 8/28/2015 | 1,988.87 | 2,176.12 | 9% |
 We were once a believer of this technical pattern. However, being skeptical of the conventional wisdom coupled with data analysis, we're able to conclude that the Death Cross is not so deadly after all. So the next time you see this term used to instill fear of a impending market crash, be sure to think twice about liquidating all your holdings.
Sources:
Posted in Death Cross, technical, Technical Take