Netflix (NFLX) is the first stock under review. Our prior work on this stock can be found here (September 22, 2011).
- Japan
- Market Indicator
- Price Momentum Indicators
- Richard Russell
- Silver
- Speed Resistance Lines
- U.S. Dividend Watch List

Netflix (NFLX) is the first stock under review. Our prior work on this stock can be found here (September 22, 2011).
In a series of articles examining Edson Gould’s Speed Resistance Lines (SRL), we put some big name stocks to the test. The test was to see if Gould’s SRL had any reasonable predictive ability to determine the downside targets for the stocks in question. The results have been astounding and are well worth your careful consideration.
First, we will review the SRLs for Netflix (NFLX) and Green Mountain Coffee Roasters (GMCR) and the outcome of the analysis related to Gould’s indicator. Next, we will review the updated Chipotle Mexican Grill (CMG) downside target.
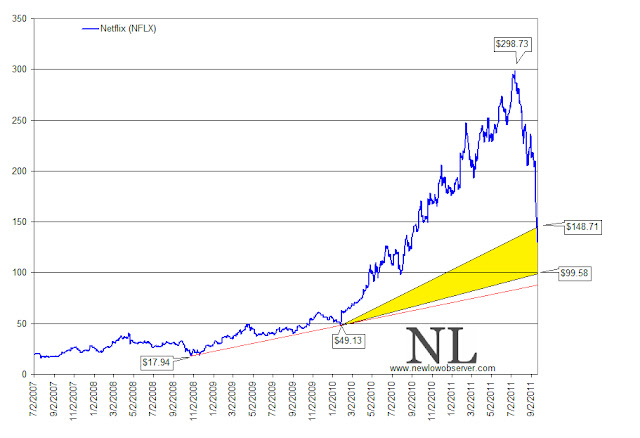
The first stock that we applied the SRLs to was Netflix (NFLX) on December 3, 2010. At that time, NFLX was trading at $205.90. When the stock rose to the eventual peak of $298.73, we thought that maybe the SRL was a waste of effort.

However, almost one year to the day after we ran the SRL on Netflix, the stock had broke through our conservative downside target of $117.76. Even more amazing, NFLX later declined below the extreme downside target that we set at $68.63. Today Netflix trades at $66.56. Because we’re not short-sellers, we did not take any position on the decline of the stock. However, we were able to buy the stock at $62 and sell the stock at $100 in the subsequent rebound from the initial low.
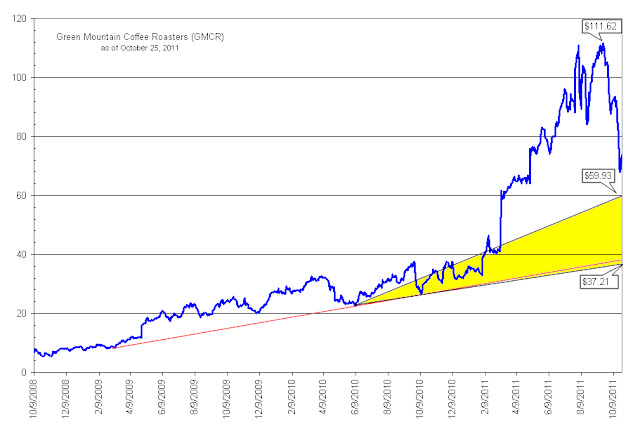
The next stock that we applied the SRL to was Green Mountain Coffee Roasters (GMCR) in our October 25, 2011 review of Edson Gould’s formula. At the time, GMCR was trading at $64.75 after declining –42% from the peak in the stock price on September 19, 2011. There were some who said that the stock was a bargain and should be bought. However, Gould’s SRL indicated that at minimum, GMCR was to decline to $59.93 and possibly decline to the $37.21 level.

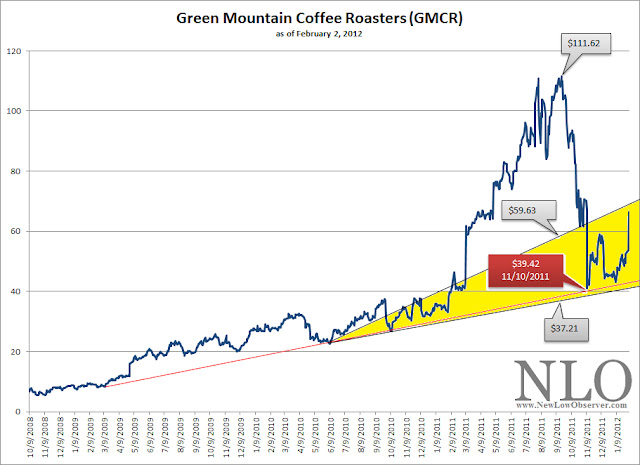
In a May 2, 2012 revision of Gould’s SRL for Green Mountain Coffee Roasters (GMCR), when the stock was trading at $28.50, we suggested that the stock could trade down to $22.53 with and additional downside target of $8.30. Today GMCR trades at $22.13 (see chart above).
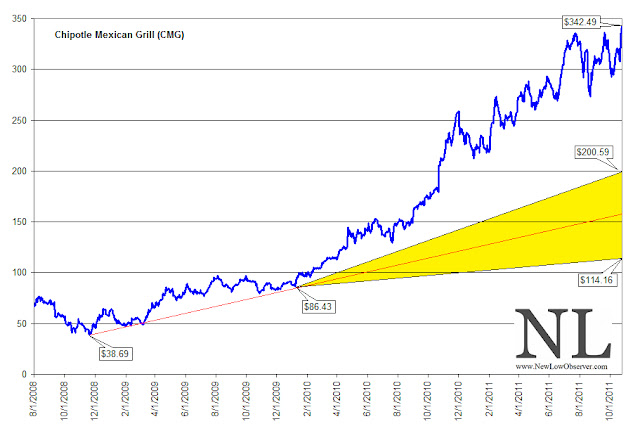
In the same October 25, 2011 review of Green Mountain Coffee Roasters, we covered Chipotle Mexican Grill (CMG). At that time, Gould’s indicator suggested that CMG had a conservative downside target of $200.59 and an extreme downside target of $114.16. As we’ve indicated in the past, SRLs are based based on the highest price the stock attains. In this case, CMG rose as much as +45.70% since our October 25, 2011 article. Below is the revised SRL for CMG.

Based on the high of $440.40, Chipotle Mexican Grill has a conservative downside target of $233.23 and an extreme downside target of $146.80. We’re cautious about anyone who suggests that CMG is a “good buy” or “undervalued” at the current price. Already, we’re within striking distance of the $233.23 conservative downside target as CMG trades at $280.93 after hedge fund manager David Einhorn recently recommended selling the stock short (article found here). If past use of SRL is any indication, when CMG declines below the upward trending conservative downside line, you can be assured that the stock will hit $233.
Again, our purpose of using SRLs to determine the downside risk of a stock that we’d like to buy but don’t want to chase. We’re willing to wait for the eventual decline or admit that we missed the boat on a great investment opportunity. Again, we don’t sell stocks short because we’re interested in acquiring great companies at the best price possible.
Disclaimer: This piece is a continuation of the examination of Edson Gould's speed resistance line as explained in prior articles. This is not an endorsement to sell short at the current levels nor buy these stocks once falling below the extreme downside targets since the stocks have been randomly selected, at best.
Posted in CMG, downside, Edson Gould, GMCR, NFLX, speed resistance line
Tagged members
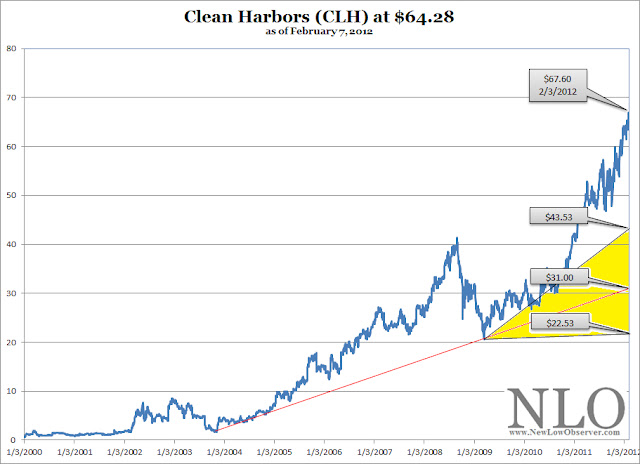
On February 9, 2012, when the stock was trading at $64.28, we reviewed the Speed Resistance Lines for Clean Harbors (CLH). At that time we indicated the Clean Harbors had the following downside targets (found here):
Currently, Clean Harbors (CLH) has declined to the $54.80 level which, in our view, happens to be a critical support level for shareholders of the stock. As can be seen in the chart below, the price of CLH fell below the 200-day moving average (red line) on June 1, 2012. Additionally, on three occasions the price of CLH attempted and failed to exceed the 200-day moving average (red line).

CLH is now bouncing along the support level of $55 (blue line). It is not clear whether the stock is going to retest the 200-day moving average which presently sits at $61.94. However, any additional decline in the stock price will likely lead to falling to $47.83.
Posted in Clean Harbor, CLH, speed resistance line, SRL
In after-hours trading, Priceline.com (PCLN) has decline below the June 1, 2012 support level of $610.50. By declining below such a level, it appears that we can project downside targets using Edson Gould’s Speed Resistance Lines.

Our current assessment of Priceline.com is far different from our examination of Gould’s Speed Resistance Lines on November 10, 2011 (found here). As the price of PCLN has increased so does the downside targets.
Over the next several months, we’ll be able to see if Priceline.com declines to the conservative target of $434.73 and then to the $317 level. Our extreme downside target of $258.32 appears as an outlier event at this point but will be reconsidered if PCLN declines to $317.
The following is a review of Buckle (BKE) using Edson Gould’s Altimeter.

Below is the performance of the buy and sell indications of Edson Gould’s Altimeter based on periods when the indicator first cross below 150 for buy indication, and above 247 for sell indications.
| Date | Price | Altimeter | buy/sell | % change | $1 invested |
| 6/12/1997 | 6.57 | 148 | buy | 69% | $1.69 |
| 1/28/1998 | 11.13 | 250 | sell | -47% | |
| 10/8/1998 | 5.95 | 134 | buy | 85% | $3.13 |
| 11/6/1998 | 11.01 | 248 | sell | -41% | |
| 11/4/1999 | 6.51 | 146 | buy | 69% | $5.30 |
| 3/19/2002 | 11.01 | 248 | sell | 120% | |
| 11/19/2007 | 24.26 | 146 | buy | 72% | $9.13 |
| 9/18/2008 | 41.78 | 251 | sell | -43% | |
| 10/23/2008 | 23.94 | 144 | buy | 107% | $18.90 |
| 3/9/2012 | 49.56 | 248 | sell | -39% | |
| ????????? | 30 | 150 | buy | ????????? |
The consistency of the indicator is amazing. Only the sell indication of March 19, 2002 resulted in an outcome that was contrary to the desired result. Even so, A person who only bought BKE based on the buy signal and sold based on the sell indication would have resulted in a gain of 1,890% from June 12, 1997 to the present. This is compared to the buy and hold total return with reinvestment of dividends (including special dividends) of 766.21%. Based on capital appreciation alone, the price of BKE rose 498% since June 12, 1997.
In the table above, the section in blue is the tentative estimate of when the next buy signal will be registered and the amount of decline necessary to get to the signal. It appears that based on the sell indication from March 9, 2012 to the price of $30, BKE would have to decline -39% using the Altimeter. Such a decline is well within the prior successful sell indications that resulted in losses.
We are very interested in this stock at the right price. We believe that BKE will be a buy at $30 and below. However, prior price movement based on Gould’s speed resistance lines indicated that the conservative downside target is $24.47 and the extreme downside target of $16.68.
Historically, based on prior Altimeters, a buy indication does not mean that the price decline has actually ended. Therefore, if the buy indication is triggered then be prepared by making your purchase of the stock in, at least, two stages. Once at the trigger price and again at any desirable price lower than the trigger level.
Posted in Altimeter, BKE, Buckle, Edson Gould, speed resistance line, SRL
Tagged members
While it appears that Chesapeake Energy (CHK) has seen all the punishment that could possibly lay ahead, we’re concerned that the previous technical pattern in the period from 1993 to 1999 is about to repeat. In the chart below, we’ve applied Edson Gould’s Speed Resistance Lines [SRL] to the price of CHK in the period from 1993-1999 and 1999-2012.

Critical to our analysis using Edson Gould’s SRL is the fact that, so far, CHK has replicated every move that has occurred in the ‘93-‘99 period in the most recent price activity from ‘99-‘12. While it would appear academic that the stock has been in a declining trend, we’re more concerned with the downside risk.
With this in mind, if CHK declines below the red line at x2, then we believe CHK will return to the pivot level of $4.94 with the possibility of declining all the way back to 1999 prices. If CHK falls significantly below the $4.94 level, then the stock has a high likelihood of going all the way $0.67. This would be a replication of CHK falling below x1, and returning to the previous pivot level of $2.00, set in 1994.
This “warning” does not suggest that CHK cannot go back to the prior highs at $55 (for now), instead, this review is strictly intended to consider the downside risk, which is our only concern.
Who is Edson Gould?
“Edson Gould spent over 60 years working in and studying financial markets. Gould studied the arts at Princeton, engineering at Lehigh (from where he graduated in 1922), and finance at New York University. In 1922, after working for a short time at Western Electric, he joined Moody’s Investor Service as an analyst and later was editor of Moody’s Stock Survey, Bond Survey, and Advisory Reports. In 1948, he began at Arthur Wiesenberger & Company, where he developed and edited the well-known Wiesenberger Investment Report and became a senior partner. He also was Research Director at E. B. Smith (which later became Smith Barney), and worked for Nuveen.”
(source: Market Technicians Association. Gould, Edson Beers, Knowledge Base. Accessed April 26, 2012. link MTA reference.)
“Market technician Edson Gould always laughed at the idea of having a significant influence on the stock market, but his predictions were the most precise around. He pinpointed major bull markets and prophesied bottom-out markets as if he had his own peephole into the future. But in place of a crystal ball and wacky off-the-cuff schemes, his were smart, intensely researched and time-tested theories that made him a legend in the investment community.”
(source: Fisher, Kenneth L.. 100 Minds That Made the Market. Business Classics, Woodside, CA. 1993. page 320.)
Posted in CHK, Edson Gould, speed resistance line
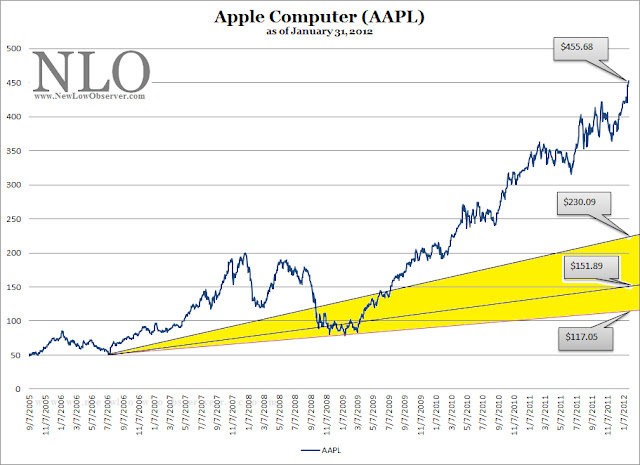
For the New Low Observer team, it has been an uneventful period in our watch of Apple Inc. (AAPL) stock since February 5, 2012 even though the price has risen nearly 40%. What in the world would we consider eventful in regards to Apple stock? Well, we’d like to see Apple hit one of Edson Gould’s speed resistance line downside targets. The chart below is an update of the one that we submitted earlier this year (found here).

The new downside targets are as follows:
Based on the current run in Apple Inc. stock, the Dow Theory fair value is $275.44. (636.23-85.35)/2=275.44
As we said on February 5, 2012, “the rampant enthusiasm for AAPL suggests that the stock isn't likely to decline to the indicated levels any time soon.” This has definitely been the case with the impressive run up since the beginning of the year.
In order to diffuse the legitimate claims that we’re grasping at straws simply to make a bearish case against Apple Inc., we’ve provided the price performance of the stock over a similar 7-year period from December 19, 2000 to December 31, 2007 applying Edson Gould's speed resistance lines, in the chart below.

What stands out the most in the period from 2000-2007 is the percentage increase in Apple’s stock price compared to the current run-up as indicated below:
If we were to ask the question of what was the likelihood of Apple falling to $133.22 on December 31, 2007, we believe the chorus of Apple investors would say, “not likely, if ever.” Similarly, we believe that, based on the current speed resistance lines, no one would expect Apple to decline to our conservative downside target of $424 let alone falling to the $212.08 worst case price.
We’re not advocating that we’ve seen the peak in Apple’s stock price especially when we compare the fundamental data on AAPL between the 2007 peak and the current price:
| Apple (AAPL) | 2007 | 2012 | % change |
| Sales per share | 27.52 | 170.2 | +518.45 |
| ‘‘Cash Flow’’ per share | 4.37 | 46.5 | +964.07 |
| Earnings per share | 3.93 | 43.8 | +1,014.50 |
| Div’ds Decl’d per share | 0 | 2.65 | N/A |
| Cap’l Spending per share | 0.84 | 5.65 | +572.62 |
| Book Value per share | 16.66 | 138.85 | +733.43 |
| Common Shs Outst’g | 872.33 | 940 | +7.76 |
| P/E Ratio @ high price | 43.53 | 17.23 | -60.42 |
| Source: Value Line Investment Survey | Oct. 12, 2007 | April 6, 2012 |
However, in 2007, it was justified for a non-dividend paying technology company to have a P/E ratio in the 40’s while a company that could easily become a dividend aristocrat would be considered fairly priced with a P/E ratio of 17.
Since we believe that markets are supremely inefficient, the perceived extremes to the upside are likely to be counteracted to the downside. Edson Gould’s speed resistance lines provide a progressive downside target as Apple’s price increases. If the price decline achieves any of the downside targets, we’ll be ready to re-examine the company fundamentals for long and short-term investment opportunities.
Posted in AAPL, Edson Gould, speed resistance line
As Apple Inc. (AAPL) announces that it will be paying a dividend of $2.65 per quarter starting in July 2012, we wondered what Edson Gould’s Altimeter would look like if it were applied to AAPL after 1995, when AAPL eliminated their quarterly dividend. We want to see how Gould’s Altimeter would react to Apple Inc. if the dividend were increased every year from 1996 to the present with the assumption that the 2013 annual dividend would be $10.60 per share.
The Altimeter was first described by Edson Gould in Barron's on February 21, 1968. Gould asserted that the relationship between the price and the dividends paid on that stock, or index, tell investors of under or overvaluation. It is important to make the distinction between Edson Gould’s Altimeter analysis and his Speed Resistance Line [SRL] analysis. Altimeters are based on the dividend payment relative to the stock price while the SRL is based strictly on the price movement.
In the case of Apple Inc. (AAPL), there hasn’t been a dividend paid since 1995. To arrive at a dividend payment from 1996 to today, we calculated a gradual annual dividend increase as would be the case with any blue chip stock like a Dividend Achiever. Dividend Achievers are stocks that have increased their dividend every year for 10 consecutive years in a row.
We're running on the assumption that the July 2012 $2.65 quarterly dividend would be the latest increase in a long string of dividend increases since 1996. Below is the assumed dividend increases from 1996 to the present:
| Year | Annual | Quarterly |
| 1996 | $0.52 | $0.13 |
| 1997 | $1.13 | $0.28 |
| 1998 | $1.76 | $0.44 |
| 1999 | $2.40 | $0.60 |
| 2000 | $3.00 | $0.75 |
| 2001 | $3.64 | $0.91 |
| 2002 | $4.42 | $1.11 |
| 2003 | $4.88 | $1.22 |
| 2004 | $5.52 | $1.38 |
| 2005 | $6.14 | $1.54 |
| 2006 | $6.76 | $1.69 |
| 2007 | $7.40 | $1.85 |
| 2008 | $8.02 | $2.01 |
| 2009 | $8.64 | $2.16 |
| 2010 | $9.28 | $2.32 |
| 2011 | $9.89 | $2.47 |
| 2012 | $10.48 | $2.62 |
| 2013 | $10.60 | $2.65 |
Based on the proposed annual dividend increases, we can now view what Edson Gould’s Altimeter would look like for Apple Inc. (AAPL) stock. Below is the Altimeter from 1996 to the present.

The first thing that is noticed, in the chart above, is the fact that from 1996 to 2007, Apple traded in a range of between 50 and 17 on the Altimeter (Altimeter level; not stock price). Anytime AAPL was trading near 50 the stock was overvalued and when the stock traded around the 17 range the stock was considered undervalued.
However, the low of 2003 marked the beginning of a new relationship between Apple’s stock price and our hypothetical dividend that would have been received. Starting in 2006, AAPL’s stock would decline, at minimum, to the previous Altimeter peak. The decline from the 2006 peak stopped exactly at the 2005 peak. The decline from the 2007 peak initially flirted with the 2006 peak but ultimately succumbed to the forces in play and fell well below the 2006 peak.
Our take on this “pattern,” based on hypothetical dividend increases every year from 1996 to the present, is that the next support level for Apple’s stock price would be at the 2007 peak, at minimum. This suggests that APPL’s stock price could decline to $284.98. Such a decline would constitute a –52.59% drop from the closing price of $601.10 on March 19, 2012. Although the $284.98 level seems dismal, it is a far cry better than Edson Gould’s Speed Resistance Line [SRL] analysis which suggests that the extreme downside target is $201.66. This is an increase from the February 5, 2012 downside [SRL] analysis done on Apple (found here).
Posted in AAPL, Altimeter, Apple Computer, Edson Gould, speed resistance line
Tagged members
In retrospect, everything appears “oh so clear.” We love history and attempt to interpret events from the past as a means to project into the future, assuming everything remains the same. Which is why the chart below seems so stunning to us.
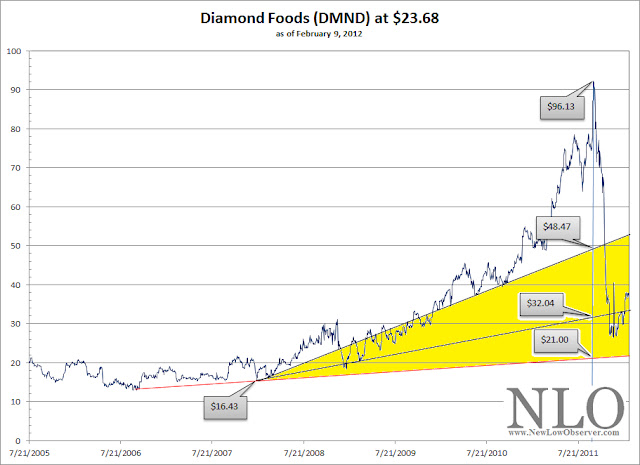
The above chart of Diamond Foods (DMND), which has recently been blown out the water due to some accounting “irregularities” and the dismissal of the CEO and CFO, demonstrates the seeming power of Edson Gould’s speed resistance lines (SRL). First, notice that the high of DMND was at$96.13, the starting point for all analysis of SRLs. Based on the high of $96.13, the conservative downside target would have been the $48.47 level. At the same time, the extreme downside target would have been the $21.00 level with an intermediate downside target of $32.04.
Amazingly, every downside target has been met with DMND reaching as low as $21.44 , on an intraday low. By the way, little mention has been made of the accounting firm that signed off on Diamond Foods spurious books.
Already, in our prior work, we've seen a Netflix (NFLX) SRL, done in December 2010, give us an extreme downside target of $66. Almost a year later, NFLX declined through the $66 level to fall to as low as $62.37 on November 30, 2011. Another SRL that we ran before it came to fruition was Green Mountain Coffee Roasters(GMCR) on October25, 2011. At the time, GMCR was trading at $64.75. We estimated, using the SRL, that GMCR had an extreme downside target of $37.21. The stock recently fell as low as $39.42 as reviewed in our February2, 2012 posting.
Below is the latest speed resistance lines for a stock that we've been curious about for some time, Clean Harbors (CLH).
Some could reasonably argue that we’re allowing correlation to equal causation, which we’d gladly confess to. However, this explains why we a reactively seeking companies which we can run Edson Gould’s SRLs beforehand to ensure some semblance of integrity in the concept. We want to run this examination through as many companies as we can before the actual decline.
A word of warning, the fact that a stock reaches the extreme downside target does not necessarily mean that the stock or index is considered to be a “buy.” Nor does it suggest that the stock or index cannot fall further. Instead, it only reflects what potentially could happen on the downside. Additionally, SRLs do not suggest a time frame that a decline is expected to occur.
For the NLO team, speed resistance lines appeal to our sense of considering the worst case scenario, which has saved us a lot of money simply by avoiding situations that would create significant loss. Using history to assist us in projecting the downside risk is the primary reason we started examining speed resistance lines.
Posted in Clean Harbor, CLN, Diamond Foods, DMND, Edson Gould, Netflix, NFLX, speed resistance line
Sixteen days later, on an intraday basis, GMCR fell as low as$39.42. This was within 6% of the targetedextreme low of $37.21. In this example, we’re satisfied that Edson Gould’s speed resistance line has met our expectations.
Posted in AAPL, Edson Gould, NFLX, speed resistance line, William X. Scheinman
Tagged members
Although we thought that the stock would be worth considering below the indicated levels, at the time, we had to concede that, “the difficulty may be that the sentiment that pushed the stock price to $298.73 would likely be just the opposite to push the price down.” Therefore, we’re not buyers of NFLX at these levels. However, we wondered what Edson Gould’s speed resistance lines would say about two other stocks that have had tremendous increases recently.
“Resistance lines decline or ascend at one-third or two-thirds the rates of actual declines and advances between significant bottoms and tops. Resistance to advance or decline is frequently encountered at such trendlines; however, if the resistance line is decisively penetrated, the price-action often tends to accelerate in the direction of the penetration.”

Comments Off on Netflix and Speed Resistance Lines
Posted in Edson Gould, Netflix, speed resistance line, William X. Scheinman, XAU