Below is a chart of Southern Company (SO) from 1982 to 2019 reflecting the year-over-year (YoY) percentage change.
- Japan
- Market Indicator
- Price Momentum Indicators
- Richard Russell
- Silver
- Speed Resistance Lines
- U.S. Dividend Watch List

Below is a chart of Southern Company (SO) from 1982 to 2019 reflecting the year-over-year (YoY) percentage change.
Below are the valuation targets for Southern Company (SO) for the next 10 years. Continue reading
Below are the valuation targets for Southern Company (SO) for the next 10 years. Continue reading
Below are the 12 companies on our U.S. Dividend Watch List that are within 11% of their respective 52-week lows. Stocks that appear on our watch lists are not recommendations to buy. Instead, they are the starting point for doing your research and determining the best company to buy. Ideally, a stock that is purchased from this list is done after a considerable decline in the price and rigorous due diligence.
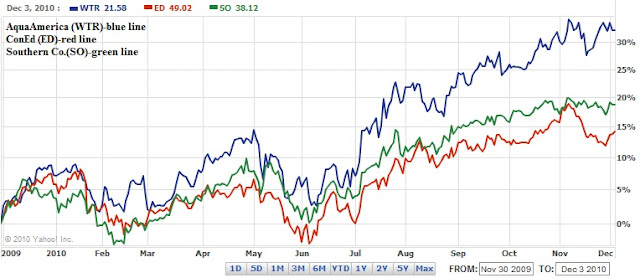
Posted in Aqua America, Consolidated Edison, ED, SO, Southern Company, WTR
Tagged members