Category Archives: real estate

Review: Bank of Montreal

Contributor C. Cheng Asks:

“What are your concerns regarding the housing bubble forming in Canada and it’s potentially adverse effects on BMO?”

Our Response:

The timeliness of this comment regarding Bank of Montreal (BMO) is critical.  On June 7, 2012 (found here), we posted an Investment Observation on Bank of Montreal which was one of our leading considerations as an investment opportunity.  Keep in mind that our interest in BMO came after a 14-month declining trend in the stock’s price.

At that time we said the following of BMO:

“We are reticent to recommend any kind of banking institution due to the many unexpected risks that occur outside of the purview of regulators and accountants.  However, Bank of Montreal is a reasonable banking investment if bought at the right price.  We believe that the right price begins at $51.80 and below.”

Unfortunately, BMO never fell below $51.80.  In fact, the day that were did our write up on BMO it only fell below the $53.57 price on the five subsequent trading days immediately afterwards, with the lowest price being $52.15 on June 11, 2012.

At the moment, BMO’s stock price has retested the previous high set in November 2013.

image

If there is a concern that Canadian real estate is in a bubble then it would be wise to sell only the principal in BMO while leaving the profits to compound.  This would eliminate the guesswork associated with determining if there is a bubble.  The remaining funds would be allowed to compound at a 5.50% rate until BMO has sustain a similar decline in price from April 2011 to June 2012.

Continue reading

Q&A: Cycles and Their Use

Reader Kerry Comments:

“I’d like to pick up on the problem that untrusting investor has identified ‘The problem is that we have never seen one yet that has much accuracy or predictive ability to any substantive degree or within any reasonable time frame. As such, it becomes a ‘big gamble’ to take action on the predictions of any such cycle models or theories.’

“I like cycles myself, but I struggled with cycles that appeared great but then tended to be slightly off when forecasting the future, and therefore are difficult to use in trading. This led me to conduct my own research that has culminated in my own cycle work and the discovery of a 2.2/4.4 year cycle. I am of the opinion that the secular bear is about to strike back in the second half of 2013 as the 17.6 year stock market cycle continues until 2018, when the next great bull market will properly begin.”

Our Response:

Implicit in the discussion of cycles (observations of the past) is the eventual application of the analysis for the future. Unfortunately, some who do the best research on the study of cycles have the worst record of application. Our view is that we’ll be wrong about the actual cycle range and the application of the timing. Therefore, we are never disappointed about the outcome.

However, as students of the market we are constantly working to find quality research on the topic. Already we know that Charles Dow’s work on stock market cycles is useful when applied with skepticism and moderation.

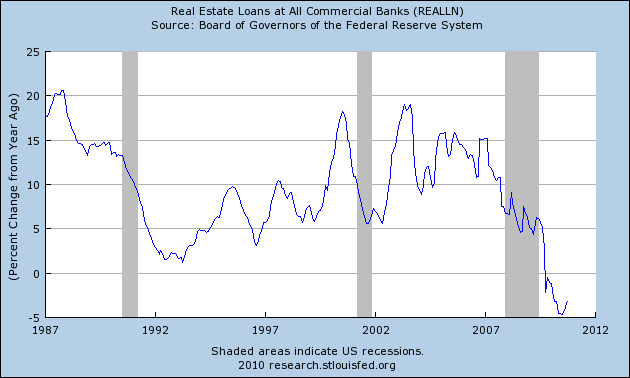
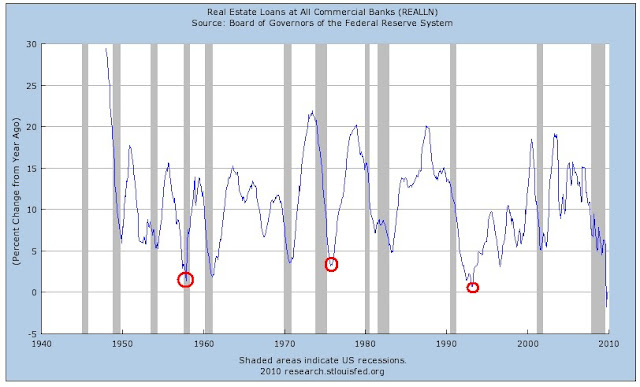
As an example, based on the Wenzlick model for when real estate would bottom (18.3 years) it suggested that the low would be in 2009. In our January 2010 article titled “Real Estate: The Bottom is Calling” we said the following (found here):

“…tendency has been to include the years 2008 and 2010 just to play it safe.”

We understand that the markers for a bottom or top are like sand dunes in a desert, they are constantly on the move. This does not negate the cyclical nature of market moves, it just means that flexibility is required when thinking on the topic of cycles.

We followed up the January 2010 article with what we believed was the definitive call in the real estate bottom based on the work of Wenzlick. In a December 2010 article titled “Real Estate: The Verdict is In” (found here) we felt the title said it all.

Naturally, we could have been completely wrong and in select markets, a bottom may not be in at all. However, we’re trying to think in terms of the broader context. Based on the metrics that we tracked, real estate did hit bottom on or fairly close to the December 2010 low as highlighted in our follow-up article titled “Real Estate: A Sustainable Rise” (found here).

Within the general context of “being accurate” on our call of real estate based on the cycle work of Wenzlick, there are a couple of MAJOR ASPECTS THAT WE DID NOT GET RIGHT and that is the recommendation and investment in homebuilder stocks and the purchase of the home in our specific county.

First, we did not recommend homebuilder stocks because we simply didn’t think of it. That was a huge missed opportunity as shown in the chart below of the SPDR S&P Homebuilders ETF (XHB).

image

Second, our purchase of a home in September 2009 was not at the low point, for our region of the country, as real estate prices had bottomed in January 2009.  By the time of the 2009 purchase, median prices for our county had increased by +40% as seen in the chart below (www.car.org).

image

Also, as seen below, existing home sales for our county bottomed a year after the home purchase.

image

However, the overall point is that we're closer to the low in the respective cycles rather than near the peaks in the cycle with out investments and purchases.  Additionally, we’re taking the lessons for the current cycle and hoping to apply it to the next cycle move.

We also have cycle targets for gold and interest rates which have been fairly accurate. Do we go “all in” on the cycle turns? No. However, we do factor in the chance that the change in the cycle could exert its force on our best intentions.

Again, the emphasis should always be on skepticism and moderation when attempting to apply cycles for predictions of the future.  With this in mind, a good analyst will hedge their commentary on cycles and allow for a wide margin of error. After all, we’re all students of the market (real estate, jobs, stocks, cars, groceries etc.) and therefore open to changing conditions.

As mentioned earlier, we’re always factoring the downside risks and acting accordingly (most of the time, except when our subscriber SD pointed out the awesome buying opportunity on DELL from our own watch list at the low…Great call SD!).

Real Estate: A Sustainable Rise

The cover story for the September 10th weekly magazine Barron’s is on the recent surge in real estate and how the rise in property prices is no fluke.  In the article by Jonathan R. Laing titled “Happy at Last,” readers are given a cautiously optimistic assessment of what has already been a well established trend in the real estate market.  A distinction in this article is the confidence with which many professionals believe that the current rise in real estate is sustainable for the foreseeable future. 

We agree that real estate will have a sustainable trajectory upward as we outlined in our December 10, 2010 article titled “Real Estate: The Verdict is In” (found here).  We believe that the clear reversal of the indicators that we discussed at the end of 2010 has proven that the real estate market has bottomed.  The following is a review of the indicators that we track that have definitively shown that the direction is up.

As can be seen in the chart below, U.S. housing starts bottomed in January 2009 and started to base over the next 2 years.  Two months after our December 2010 article, housing starts began to increase at a healthy pace.

image

The broad basing pattern in U.S. housing starts and the relatively mild increase, as compared to the 1991 bottom, seems to indicate a more realistic view on expectations for real estate going forward.

The next chart that we find useful for determining the direction of the real estate market is the real estate loans at all commercial banks.  When we published our December 2010 article, we said that the bottom had occurred in April 2010.  In fact, the actual bottom took place in April 2011 as shown below.

image

The real estate market cannot thrive in an environment where lenders are unwilling to lend.  Tracking the real estate loans by banks is instructive as to what the direction in might be.  Our assessment of this indication suggested that on a relative basis, the declining trend was at, or near, an end.  The dramatic increase in lending since early 2011 has helped push select real estate markets higher.

Much of the research analysis that we do on the topic of real estate is based on the work of Roy Wenzlick.  If there ever was a scientifically accurate approach to analyzing the real estate market, Roy Wenzlick perfected it.  Anyone who read his newsletter, The Real Estate Analyst (published from 1932-1974), would have thought that Wenzlick was strictly a statistician.  However, while Wenzlick was a compiler of significant amounts of data on real estate, he also believed that the market for properties ran on a clearly defined cycle.  On each chart above, we have indicated Wenzlick’s last estimated low for real estate based on that cycle.

The chart below illustrates the importance of considering Wenzlick’s estimate of the real estate cycle because it isn’t the rise that we’re interested in as much as when the next decline begins and when the bottom might occur.

image

The real estate cycle that Roy Wenzlick adheres to pointed to a low in 1991 and a low in late 2009.  In the Federal Housing Finance Agency’s House Price Index (HPI) for the nation, we can seen that 2009 was not quite the end of the decline for real estate.  Knowing that all cycle analysis is a rough estimate, at best, we hedged our view to include the possibility that the bottom would occur as late as the end of 2010.

While the outlook for real estate prices appear to be up for an extended period of time, the stock price of homebuilders like Beazer Homes (BZH), Hovnanian Enterprises (HOV), Toll Brothers (TOL), DR Horton (DHI), Pulte Group (PHI) and Lennar Corp. (LEN) are expected to rise and fall in anticipation of cyclical (short-term) trends.  We continue to recommend considering any of these companies, including homebuilder ETFs like S&P Homebuilders (XHB), when they are within 10% of their respective 52-week lows.  We believe that a revisit of the June 2012 lows will be the prices to watch for as the next buying opportunity for these stocks.

Barron’s is on the right track in terms of where the real estate market has been. However, the fact that Barron’s is favorably highlighting this trend indicates that there may be a short-term reversal in many of the widely followed indicators in the industry.  This suggests that there are immediate long-term opportunities for homebuyers while real values in homebuilder stocks will arrive six to twelve months from now.

Real Estate: The Verdict Is In

On January 6, 2010, we wrote an article titled "Real Estate Bottom is Calling". At that time we indicated that, based on the cycles as presented by Roy Wenzlick along with supporting data from the Federal Reserve Bank of St. Louis, the real estate bottom was in or that it would be registered within 2010.

As we come to the close of 2010, it appears that based on the narrow scope of sources that we’ve selected, the bottom in real estate has come and gone. Below we show a chart of housing starts which appears to have registered a bottom in the month of July 2010.

In the next chart, we have the real estate loans of all commercial banks. This chart also shows that the bottom did occur in the month of April 2010.

Again, the premise of our assertion that real estate would hit bottom is primarily based on the fine research of Roy Wenzlick, author of the Real Estate Analyst. Wenzlick proposed that real estate goes through 18.3 year cycles. Such cycles can be used to estimate the approximate bottoms or tops in the market for relatively accurate timing on when to buy or sell real estate.

Below is a chart that appears to show real estate hitting bottom in 1973. If we were to added 18 years to 1973 then we’d get a bottom in the real estate market in 1991. In fact, 1991 was the last major bottom in real estate. Adding 18 years to 1991 gives us an expected bottom in 2009. As stated in our article of January 6, 2010, we play it safe by including 2008 and 2010 to our expected bottom in the real estate cycle.

saupload_wenzlick

If we add another 18 years to the 2010 bottom that we expect that we’ve passed, we arrive at the year 2028 as the next bottom. This coincides with our inflation cycle peak that is expected from 2028 to 2030 (see right hand column). We arrived at our inflation cycle from the work of Dewey and Dakin’s book Cycles, The Science of Prediction. In their book, written in 1947, Dewey and Dakin proposed that the next peak in wholesale prices would occur in 1979 and the next trough would occur in 2006. The 1979 target was off by one year while the 2006 target is off by 2 or 3 years.

Source: Edward Dewey and Edwin Dakin. Cycles, Science of Prediction. 1947.

Despite the discrepencies in the 2006 estimate for wholesale prices, the stage has been set for some interesting times in the coming years. Based on the indicated sources above, we feel that real estate has a six to nine year stretch of rising prices or "trading" in a range and decreased foreclosures.

Real Estate Bottom is Calling

The great real estate analyst Roy Wenzlick may have called the bottom in real estate again...for the 10th time in a row for the last 78 years. Although he passed away in 1989, Roy Wenzlick gave significant credibility to the idea that real estate has an 18.3 year cycle. Wenzlick compiled data on real estate in St. Louis as well as the rest of the nation from 1932 until 1973 in his publication The Real Estate Analyst.In the diagram below, you will see Wenzlick's 18.3 year cycle displayed from 1795 until 1973.
 
It is important to note that if you add 18 years to 1973 you get the year 1991 as the next period for a low in the real estate market. Coincidentally, to some, 1991 was the last time we had a bottom in the real estate market. If you add another 18 years to 1991 then you get 2009. My tendency has been to include the years 2008 and 2010 just to play it safe.
 
As a way to cross reference our perspective that the bottom is coming, I have included the Federal Reserve's data on real estate loans with the percentage change from the previous year. Although real estate loans by banks is a slightly lagging indicator it has tracked the performance of the real estate market in sync with the Wenzlick model.
 
If we haven't hit bottom yet it means that within the year 2010 we will have to go below the previous low prices of 2009. Such an occurrence would be a complete disaster for the financial markets. I am hopeful that the real estate market doesn't further devolve. However, the concern does rest in the back of my mind.
 
Barring any further crisis in real estate, I'm willing to go out on a limb and say that on the whole, as opposed to specific geographic regions, based on credible sources like Wenzlick, the bottom in real estate may be in.
 

Resources: