
- Japan
- Market Indicator
- Price Momentum Indicators
- Richard Russell
- Silver
- Speed Resistance Lines
- U.S. Dividend Watch List
Category Archives: payx
Paychex Inc. 10-Year Targets
Below are the valuation targets for Paychex Inc. (PAYX) for the next 10 years. Continue reading
Nasdaq 100 Watch List
Watch List Summary
At the end of the week for September 17, 2010, the top performing stocks from our Nasdaq 100 list for August 15, 2010 are Oracle (ORCL) with a gain of 21.27%, Qualcomm (QCOM) with a gain of 12.07% and Computer Associates (CA) with a gain of 11.57%.
The worst performing stocks from our August 15th watch list are Intel (INTC) down –1.78%, Applied Materials (AMAT) down –1.34% and Activision (ATVI) down –0.46%.
The average gain for the watch list was 6.33%. Of the two stocks that we pointed out as being standouts from August 15th, Garmin (GRMN) exceeded the average return by climbing 9.57% while Paychex (PAYX) underperformed the average gain by rising 3.92%.
A distinction that needs to be made between this week’s list and our August 15th list is that we’ve ranking the companies on this list by those stocks nearest their 52-week low. Our previous list was ranked by those stocks that had the highest dividend yield and within 20% of their respective 52-week low.
Performance Review
The following is a total return (appreciation plus dividends) performance review of our Nasdaq 100 Watch List from September 11, 2009:
- Stericycle (SRCL) up 44.48%
- Genzyme (GENZ) up 25.54%
- Pharmaceutical Product Development (PPDI) up 20%
- Cephalon (CEPH) up 5.92%
As a group, the average gain for the stocks mentioned was 23.99%. This is contrasted by the Nasdaq 100 gain of 16.07% in the same period of time.
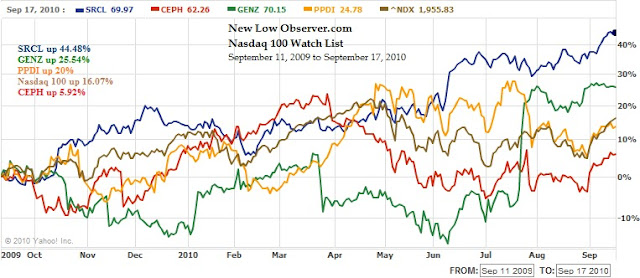 |
| *chart does not reflect dividend reinvestment for PPDI |
Nasdaq 100 Watch List
Below are the Nasdaq 100 companies that are within 20% of their respective 52-week lows. Stocks that appear on our watch lists are not recommendations to buy. Instead, they are the starting point for doing your research and determining the best company to buy. Ideally, a stock that is purchased from this list is done after a considerable decline in the price and rigorous due diligence.
| Symbol | Name | Price | P/E | EPS | Yield | P/B | % from Low |
| PAYX | Paychex, Inc. | 25.95 | 19.67 | 1.32 | 4.80% | 6.67 | 5.27% |
| INTC | Intel Corporation | 18.81 | 11.26 | 1.67 | 3.40% | 2.3 | 6.87% |
| AMAT | Applied Materials, Inc. | 11.02 | 24.44 | 0.45 | 2.50% | 2.03 | 7.33% |
| YHOO | Yahoo! Inc. | 13.89 | 22.77 | 0.61 | N/A | 1.59 | 7.34% |
| MXIM | Maxim Integrated Products, Inc. | 16.91 | 41.86 | 0.4 | 5.00% | 2.15 | 7.91% |
| GILD | Gilead Sciences, Inc. | 34.56 | 10.47 | 3.3 | N/A | 4.58 | 8.93% |
| ATVI | Activision Blizzard, Inc | 10.82 | 41.94 | 0.26 | 1.30% | 1.21 | 8.96% |
| DELL | Dell Inc. | 12.45 | 15.74 | 0.79 | N/A | 3.92 | 9.80% |
| RIMM | Research In Motion Limited | 46.72 | 10.24 | 4.56 | N/A | 3.2 | 9.85% |
| AMGN | Amgen Inc. | 55.22 | 11.73 | 4.71 | N/A | 2.28 | 9.87% |
| DISH | DISH Network Corporation | 18.77 | 11.26 | 1.67 | N/A | N/A | 10.02% |
| CSCO | Cisco Systems, Inc. | 21.86 | 16.46 | 1.33 | N/A | 2.82 | 10.31% |
| XRAY | DENTSPLY International Inc. | 30.66 | 16.55 | 1.85 | 0.70% | 2.6 | 10.45% |
| MSFT | Microsoft Corporation | 25.22 | 12 | 2.1 | 2.10% | 4.76 | 10.95% |
| SPLS | Staples, Inc. | 19.49 | 17.26 | 1.13 | 1.80% | 2.2 | 11.69% |
| PDCO | Patterson Companies Inc. | 27.15 | 14.67 | 1.85 | 1.50% | 2.3 | 12.52% |
| SHLD | Sears Holdings Corporation | 66.83 | 27.38 | 2.44 | N/A | 0.9 | 12.87% |
| GOOG | Google Inc. | 490.15 | 21.29 | 23.03 | N/A | 3.77 | 13.03% |
| LIFE | Life Technologies Corporation | 46.51 | 29.91 | 1.56 | N/A | 1.97 | 13.16% |
| STX | Seagate Technology. | 11.16 | 3.55 | 3.14 | N/A | 1.95 | 13.41% |
| FLIR | FLIR Systems, Inc. | 27.24 | 18.52 | 1.47 | N/A | 3.25 | 13.50% |
| GRMN | Garmin Ltd. | 29.64 | 8.95 | 3.31 | 5.10% | 2.21 | 13.52% |
| TEVA | Teva Pharmaceutical Industries | 53.48 | 19 | 2.82 | 1.20% | 2.48 | 13.81% |
| FLEX | Flextronics International Ltd. | 5.55 | 15.72 | 0.35 | N/A | 2.26 | 14.20% |
| COST | Costco Wholesale Corporation | 61.29 | 21.93 | 2.8 | 1.30% | 2.43 | 14.75% |
| HSIC | Henry Schein, Inc. | 56.35 | 15.82 | 3.56 | N/A | 2.31 | 14.77% |
| CERN | Cerner Corporation | 79.18 | 31.31 | 2.53 | N/A | 3.83 | 14.85% |
| CELG | Celgene Corporation | 55.25 | 29.99 | 1.84 | N/A | 5.11 | 15.06% |
| CA | CA Inc. | 20.44 | 13.43 | 1.52 | 0.80% | 2.02 | 15.48% |
| ERTS | Electronic Arts Inc. | 16.26 | N/A | -1.06 | N/A | 1.96 | 15.63% |
| VRTX | Vertex Pharmaceuticals Incorpor | 36.25 | N/A | -3.53 | N/A | 9.01 | 16.00% |
| KLAC | KLA-Tencor Corporation | 31.05 | 25.31 | 1.23 | 3.30% | 2.32 | 16.34% |
| STLD | Steel Dynamics, Inc. | 15.01 | 15.73 | 0.95 | 2.00% | 1.58 | 16.45% |
| WCRX | Warner Chilcott plc | 22.75 | 11.2 | 2.03 | N/A | 2.82 | 16.55% |
| LOGI | Logitech International S.A. | 15.39 | 22.57 | 0.68 | N/A | 2.68 | 16.86% |
| CEPH | Cephalon, Inc. | 62.26 | 12.48 | 4.99 | N/A | 2.09 | 17.36% |
| URBN | Urban Outfitters, Inc. | 34.11 | 22.19 | 1.54 | N/A | 4.26 | 18.85% |
| FWLT | Foster Wheeler AG. | 24.19 | 10.8 | 2.24 | N/A | 3.46 | 18.99% |
| FISV | Fiserv, Inc. | 53.56 | 17.16 | 3.12 | N/A | 2.57 | 19.55% |
| JBHT | J.B. Hunt Transport Services, I | 35.26 | 26.73 | 1.32 | 1.40% | 7.56 | 19.73% |
| CTAS | Cintas Corporation | 27.71 | 19.64 | 1.41 | 1.70% | 1.67 | 19.96% |
Nasdaq 100 Watch List
Below are the Nasdaq 100 companies that are within 10% of the 52-week low. This list is strictly for the purpose of researching whether or not the companies have viable business models. These companies are deemed highly speculative unless otherwise noted.
| Sym. | Name | Price | P/E | EPS | Yield | P/B | % to Low |
| GILD | Gilead Sciences | $31.94 | 10.24 | $3.12 | 0.00% | 4.29 | 0.35% |
| NVDA | NVIDIA | $10.05 | 20.85 | $0.48 | 0.00% | 2.14 | 1.52% |
| XRAY | DENTSPLY | $29.25 | 15.99 | $1.83 | 0.70% | 2.46 | 1.77% |
| FISV | Fiserv, Inc. | $45.60 | 14.29 | $3.19 | 0.00% | 2.31 | 1.79% |
| SPLS | Staples, Inc. | $19.31 | 17.86 | $1.08 | 1.80% | 2.18 | 2.60% |
| PAYX | Paychex, Inc. | $25.67 | 19.46 | $1.32 | 4.70% | 6.83 | 3.13% |
| AMGN | Amgen Inc. | $52.17 | 11.07 | $4.71 | 0.00% | 2.29 | 3.68% |
| VRTX | Vertex Pharma. | $32.47 | 0 | -$3.50 | 0.00% | 6.89 | 3.90% |
| ERTS | Electronic Arts Inc. | $14.79 | 0 | -$2.08 | 0.00% | 1.87 | 5.19% |
| ADBE | Adobe Systems | $27.39 | 38.47 | $0.71 | 0.00% | 2.86 | 5.31% |
| FWLT | Foster Wheeler | $21.52 | 7.85 | $2.74 | 0.00% | 3.28 | 5.85% |
| AMAT | Applied Materials | $12.19 | 38.09 | $0.32 | 2.20% | 2.29 | 6.18% |
| HOLX | Hologic, Inc. | $14.12 | 25.67 | $0.55 | 0.00% | 1.35 | 6.49% |
| CA | CA Inc. | $19.00 | 12.9 | $1.47 | 0.80% | 1.99 | 6.74% |
| SHLD | Sears Holding | $63.23 | 32.69 | $1.93 | 0.00% | 0.87 | 6.79% |
| SYMC | Symantec | $14.59 | 16.73 | $0.87 | 0.00% | 2.62 | 7.44% |
| YHOO | Yahoo! Inc. | $14.90 | 26.75 | $0.56 | 0.00% | 1.67 | 8.36% |
| GOOG | Google Inc. | $459.61 | 20.92 | $21.97 | 0.00% | 4.11 | 8.53% |
| LOGI | Logitech Intl | $14.33 | 0 | $0.00 | 0.00% | 0 | 8.81% |
| MSFT | Microsoft | $24.89 | 12.9 | $1.93 | 2.00% | 4.89 | 9.50% |
| KLAC | KLA-Tencor | $29.23 | 68.45 | $0.43 | 2.00% | 2.34 | 9.52% |
| EBAY | eBay Inc. | $20.09 | 10.87 | $1.85 | 0.00% | 1.95 | 9.72% |
| APOL | Apollo Group | $45.57 | 11.68 | $3.90 | 0.00% | 4.77 | 9.94% |
Watch List Notes
Two stocks of particular interest on this week's list are Dentsply International (XRAY) and Paychex (PAYX). Both companies are former Dividend Achievers with Dentsply raising their dividend 14 out of the last 15 years and Paychex raising their dividend 20 out the last 21 years. Both companies have above average compounded annual growth rates of their dividends. Of the two companies, Paychex (PAYX) appears to be the best value.
Currently, Paychex is selling slightly below the year 2000 price while Dentsply (XRAY) is selling around the 2005 price. This means that the value component of PAYX is 5 years ahead of XRAY. If the shares of PAYX don't rise soon then they are a likely candidate for buyout. Maybe because the shares of Intuit (INTU) and PAYX have been on divergent paths since October 2008, Intuit (INTU) might be a great acquirer of PAYX. In either case, XRAY and PAYX would be quality acquisitions for short-term or long term portfolios after considerable research. These stocks will be profiled in upcoming Investment Observations.
Email our team here.
Nasdaq 100 Watch List
Below are the Nasdaq 100 companies that are within 20% of the 52-week low.
| Symbol | Name | Price | P/E | EPS | Yield | P/B | % from Low |
| QCOM | QUALCOMM | 40.05 | 32.14 | 1.25 | 1.70% | 3.17 |
12.94%
|
| FSLR | First Solar, Inc. | 113.3 | 15.05 | 7.53 | N/A | 3.65 |
14.78%
|
| GILD | Gilead Sciences, Inc. | 47.87 | 16.96 | 2.82 | N/A | 6.7 |
15.88%
|
| ERTS | Electronic Arts Inc. | 18.42 | N/A | -2.31 | N/A | 2.33 |
17.32%
|
| ATVI | Activision Blizzard, Inc | 11.82 | 139.06 | 0.09 | 1.30% | 1.39 |
20.00%
|
This list is strictly for the purpose of researching whether or not the companies have viable business models or are about to go out of business. These companies are deemed highly speculative unless otherwise noted.
Nasdaq 100 Watch List Summary
This week, the top performing stock from last week's watch list was Genzyme Corp. (GENZ) which was up 4.36%. The worst performing Nasdaq 100 stock from last week was First Solar (FSLR) which fell -1.93%.
Below is the list of the highest yielding stocks that are components of the Nasdaq 100. This isn't an endorsement of the companies on the list. However, it is noted that the majority of the companies that pay a dividend are related to the chip sector. Clustering of companies in a specific industry may indicate that the entire sector is undervalued. If the companies have high dividend yields on a relative basis (compared to their historical high yields), then these companies may be worth considering despite the fact that they are not within 20% of the new low. Linear Technology (LLTC), ADP (ADP), and Paychex (PAYX) are Dividend Achievers as well as members of the Nasdaq 100 index.
Before pursuing any of these companies, be sure to verify the dividend history as well as the earnings capacity to pay the dividend (more commonly known as payout ratio).
| Symbol | Company | Price | P/E | EPS | Yield | P/B | % from low |
| MCHP | Microchip Technology | 28.25 | 31.6 | 0.89 | 4.80% | 3.53 | 43.69% |
| MXIM | Maxim Integrated Prod. | 19.14 | 71.69 | 0.27 | 4.20% | 2.31 | 48.49% |
| PAYX | Paychex, Inc. | 32.17 | 23.52 | 1.37 | 3.90% | 8.43 | 39.87% |
| LLTC | Linear Technology | 28.36 | 24.22 | 1.17 | 3.20% | N/A | 39.98% |
| ADP | ADP | 44.6 | 16.57 | 2.69 | 3.00% | 3.91 | 34.10% |
| INTC | Intel Corporation | 21.99 | 28.41 | 0.77 | 2.90% | 2.94 | 53.26% |
| PPDI | Pharma Prod. Dev. | 22.71 | 16.94 | 1.34 | 2.60% | 1.98 | 26.38% |
| XLNX | Xilinx, Inc. | 26.6 | 24.43 | 1.09 | 2.40% | 3.68 | 46.48% |
| AMAT | Applied Materials, Inc. | 12.49 | N/A | -0.07 | 2.20% | 2.37 | 23.91% |
| CMCSA | Comcast Corp. | 17.53 | 13.9 | 1.26 | 2.20% | 1.17 | 40.35% |
| KLAC | KLA-Tencor Corp. | 28.79 | N/A | -0.39 | 2.10% | 2.25 | 49.25% |
Email our team here.