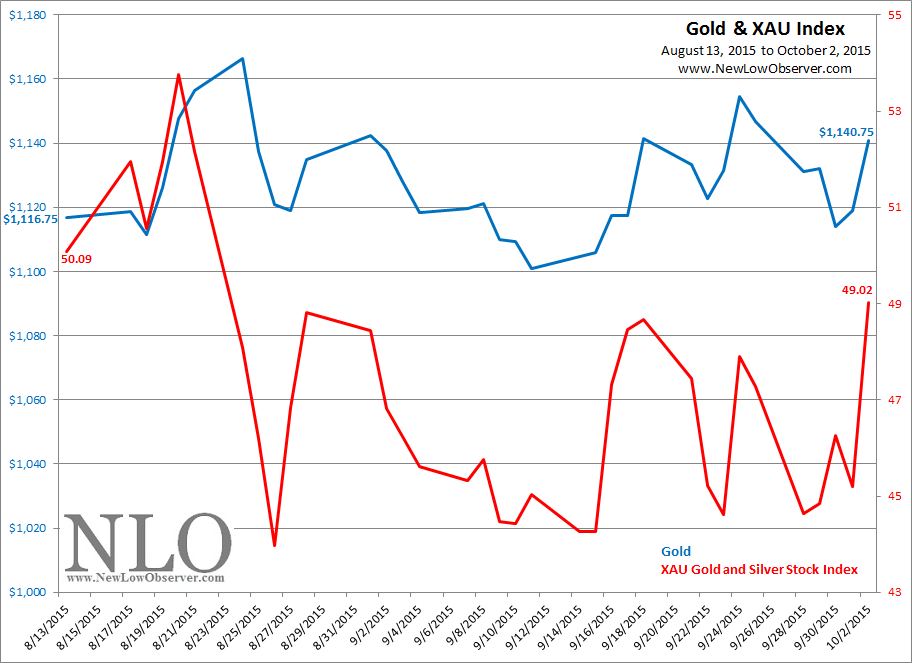
Since August 13, 2015, the price of gold has increased by +2.15% while the Philadelphia Gold and Silver Stock Index has declined –2.13%.
The price of gold could be considered to be on a tear given the fact that it isn’t falling, at the moment.

Since August 13, 2015, the price of gold has increased by +2.15% while the Philadelphia Gold and Silver Stock Index has declined –2.13%.
The price of gold could be considered to be on a tear given the fact that it isn’t falling, at the moment.
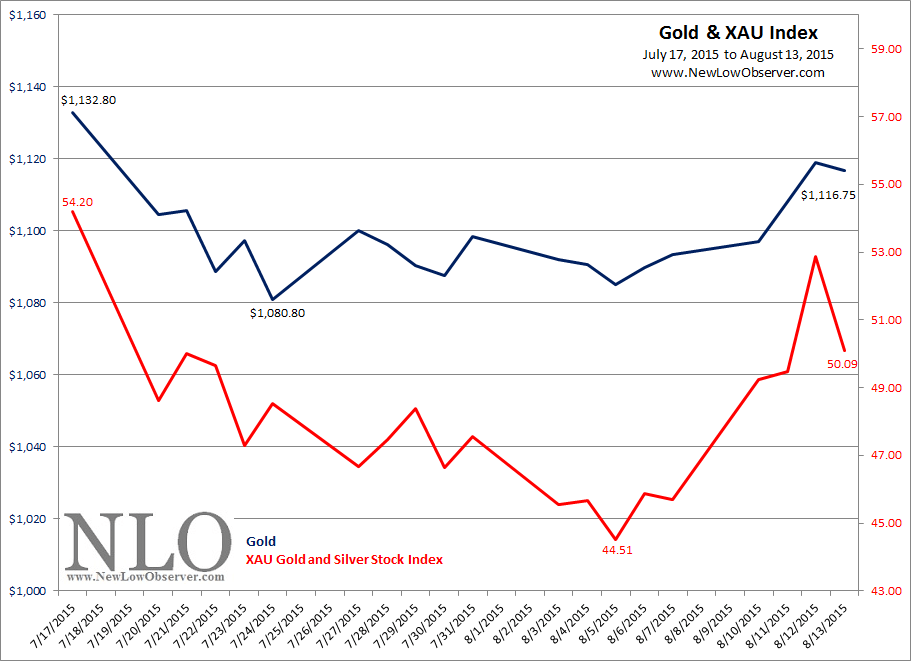
In the past month, gold and gold stocks have been on a rollercoaster ride. Gold declined as much as –4.59% while gold stocks, as represented by the Philadelphia Gold and Silver Stock Index (XAU), declined –17.88%.
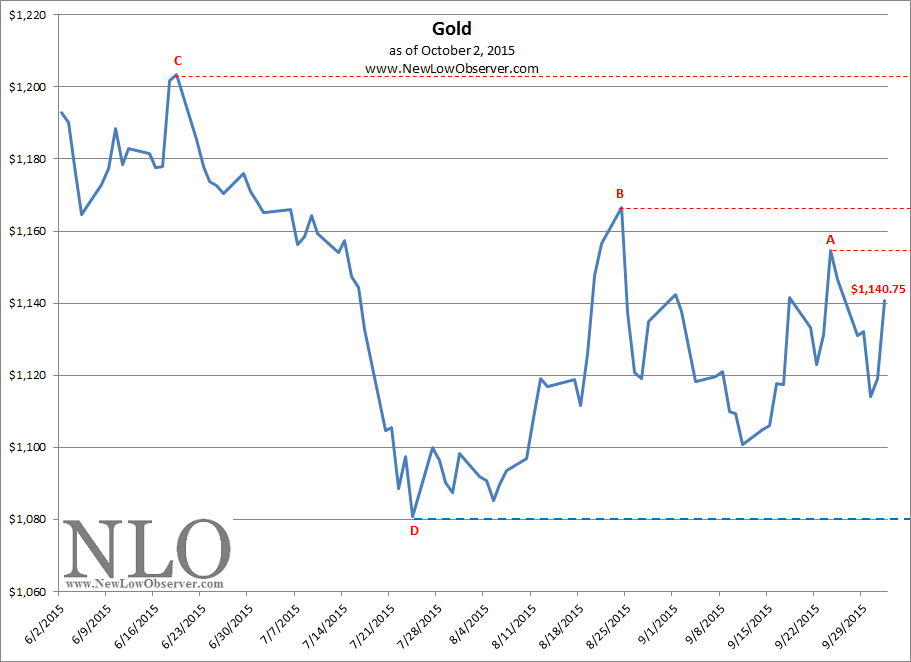
Although there has been a recovery of sorts, we cannot be sure that the decline is over.
Posted in 50% principle, Edson Gould, gold, gold bugs, Gold Stock Indicator
Tagged members
Since June 29, 2015, the price of gold has declined –3.67% while the gold and silver stock index (XAU) declined -15.19%.
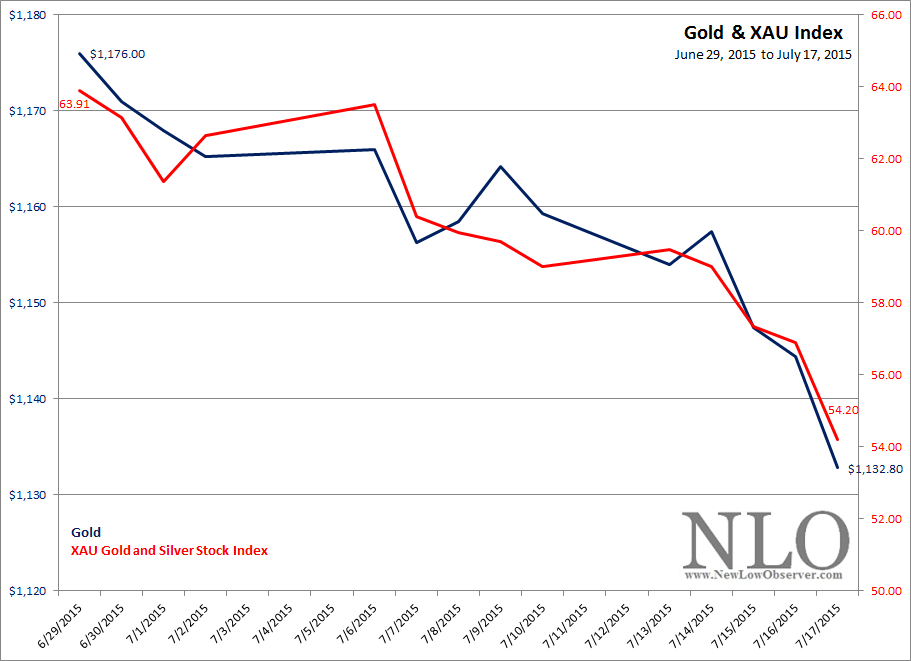
The recent declines are nothing compared to the full extent of the carnage that has been witnessed since the 2010 peak in gold stocks which have fallen –76%. Meanwhile, the price of gold from the 2011 peak has declined -40.22%.
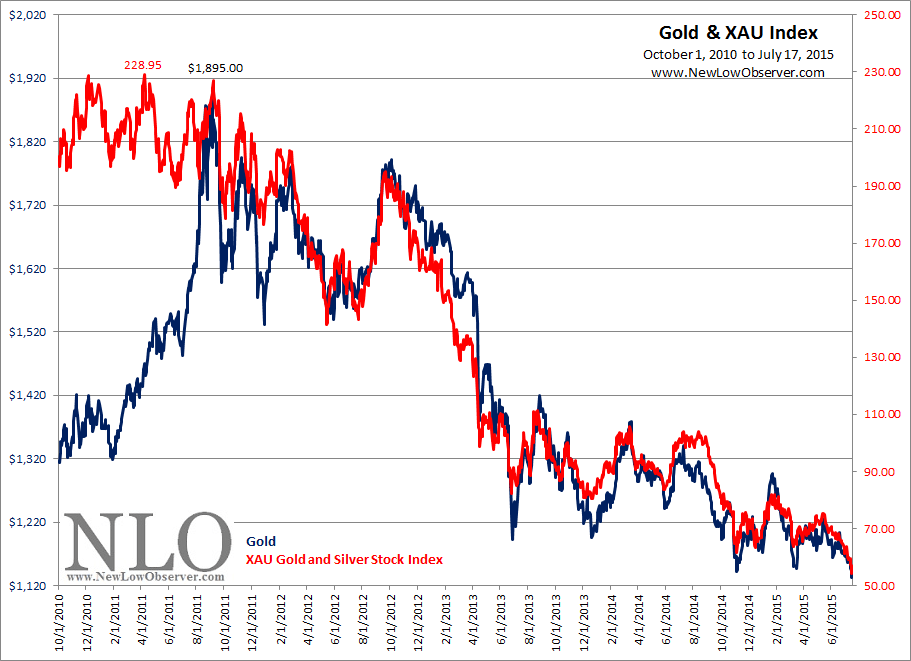
This decline is very much similar to the percentage declines experienced in the period from 1974 to 1976 when gold fell –44% and gold stocks fell –68%.
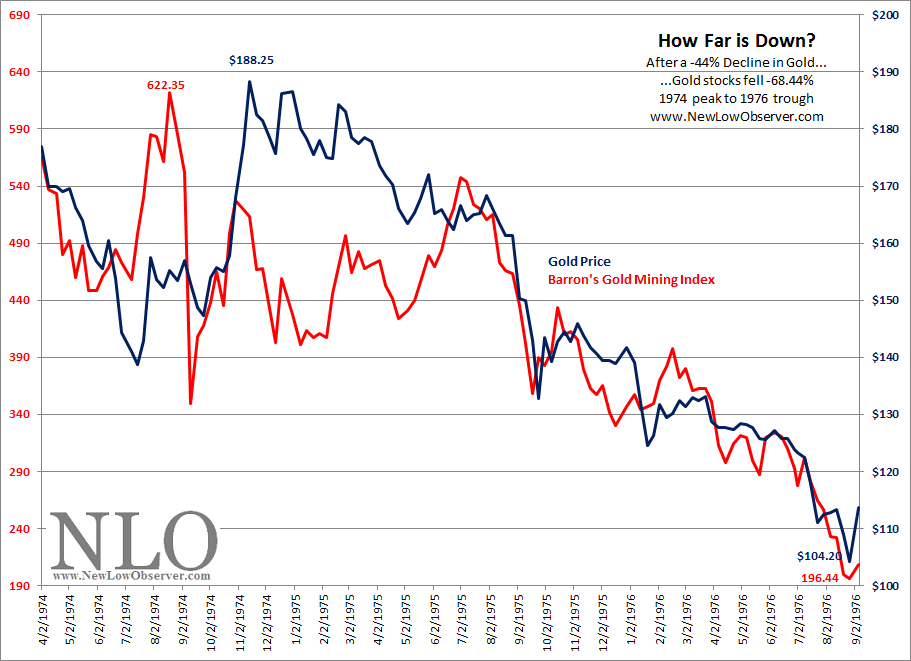
The following two quotes from Richard Russell (near the low in the gold market) seem appropriate given the current market conditions:
“The great fortunes have been made in the market by buying shares that no one wanted. S. African golds are nearing that point now. For those willing to "buy'em and put'em away," for those willing to write off a possible loss against a possible major gain, many of the marginal S. African gold shares are interesting now (Russell, Richard. Dow Theory Letters. April 2, 1976. page 6.).”
“In August of 1975 the golds fell out of the triangle and entered into one of the worst bear market collapses I have ever seen. By mid-1976 about 75% of all gold mine values were wiped out. Guessing at bear market bottoms for stock groups is always a hazardous occupation. Certainly, the action of the last month must be considered a panic in gold shares. Bear markets often end with downside panic action. Therefore, in view of the time element of the bear market, the severity of the recent chaotic panic action, and the current gold pessimism, I am guessing that we will see the lows for most gold shares in this area. But I would say that holding gold shares is an uninteresting proposition unless relative strength for the group turns bullish. It hasn’t yet (Russell, Richard. Dow Theory Letters. July 30, 1976. page 5.).”
Since our last Gold Stock Indicator posting, the price of gold has increased <1% while the Philadelphia Gold and Silver Stock Index (XAU) declined –4.49%.
Below are is the GSI for Barron’s Gold Mining Index from 1973 and XAU Index from 1983. Based on these two charts, an investors can easily discern where we are from a valuation perspective.
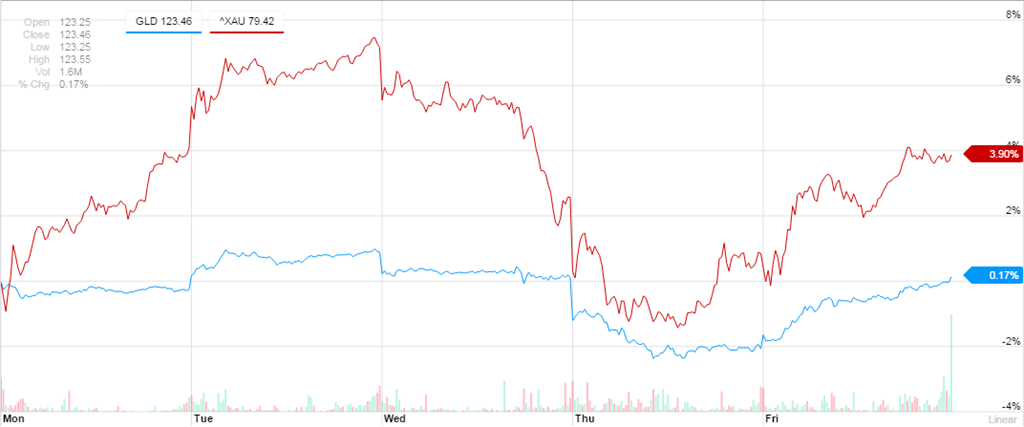
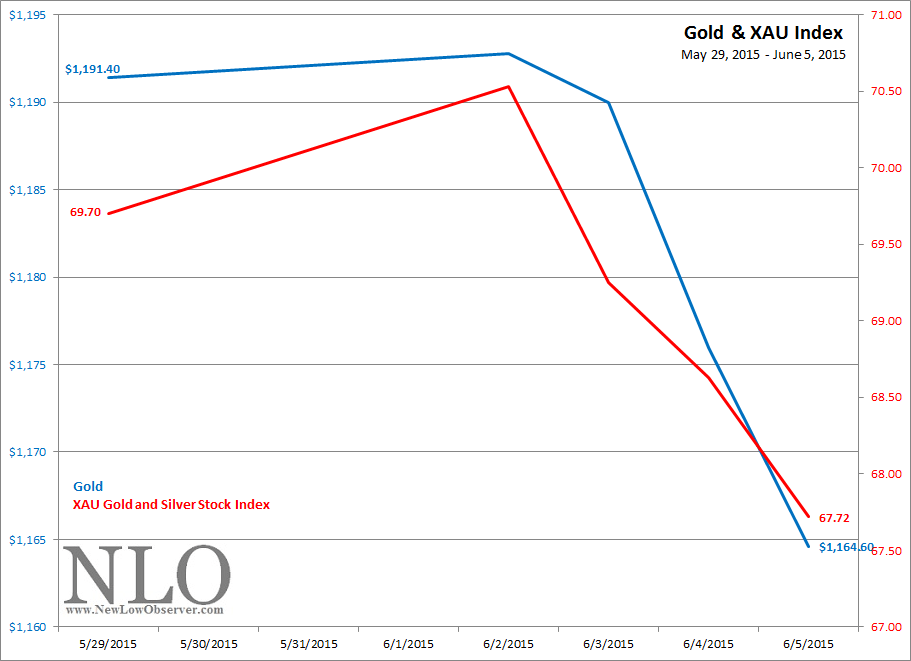
Gold fell hard this past week. On the week, gold declined –2.25% while the gold stock index dropped –2.84%.
Although gold stocks fell more on a percentage basis, from a historical standpoint the metal declined by a greater magnitude as reflected in the Gold Stock Indicator below.
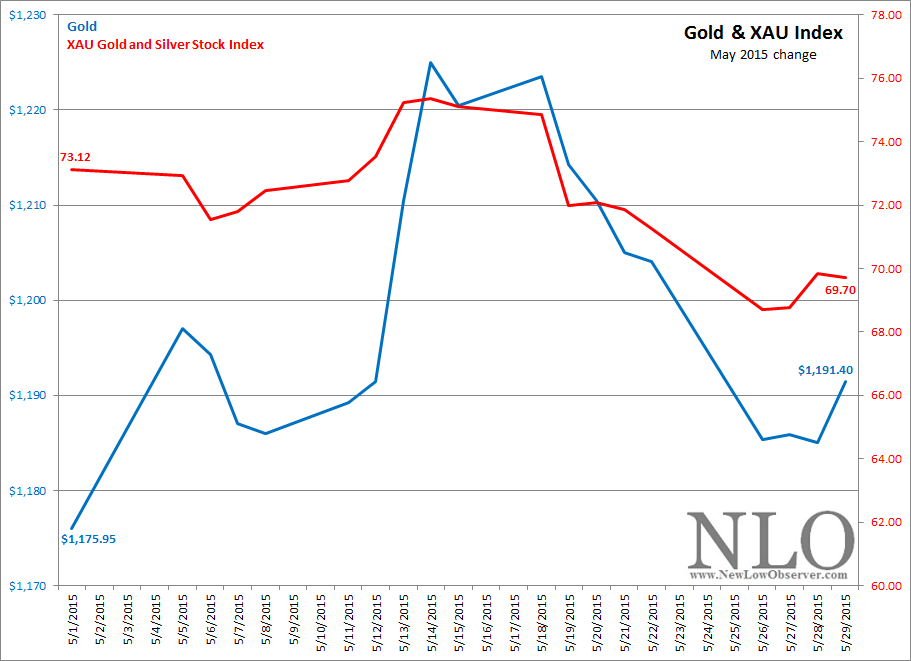
Gold and gold stocks traded places in the last month with gold increasing from 1175.95 to 1191.40 while the gold stock index (Philadelphia Gold and Silver Stock Index) declined from 73.12 to 69.7o. However dramatic the changes appear in the chart below, the actual change was +1.31% for gold and –4.67% for gold stocks.
The narrow range in the price of gold and gold stocks seems to indicate that there is a measure of price stability at the current levels. Naturally, that all changes when new lows are achieved. However, from June 2013 to the present, we have seen what could be called a basing in the price of gold and gold stocks. This is difficult to perceive especially when we know that the stocks and metals have been much lower in the past. Looking at the long-term Gold Stock Indicator puts into perspective where we are today.
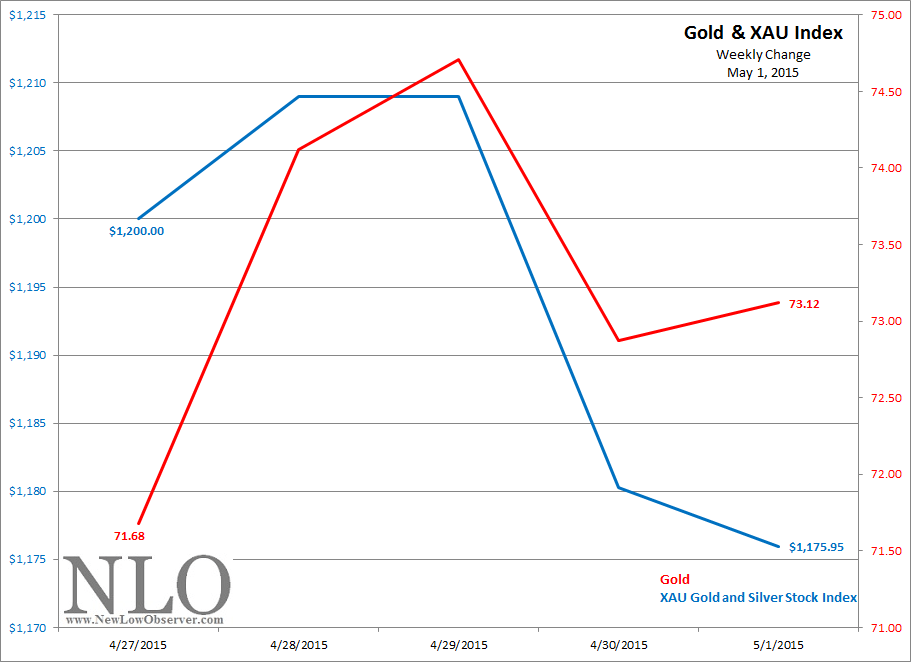
Gold stocks were up while gold was down in the past week.
Gold Stock Indicator: Long Term Charts
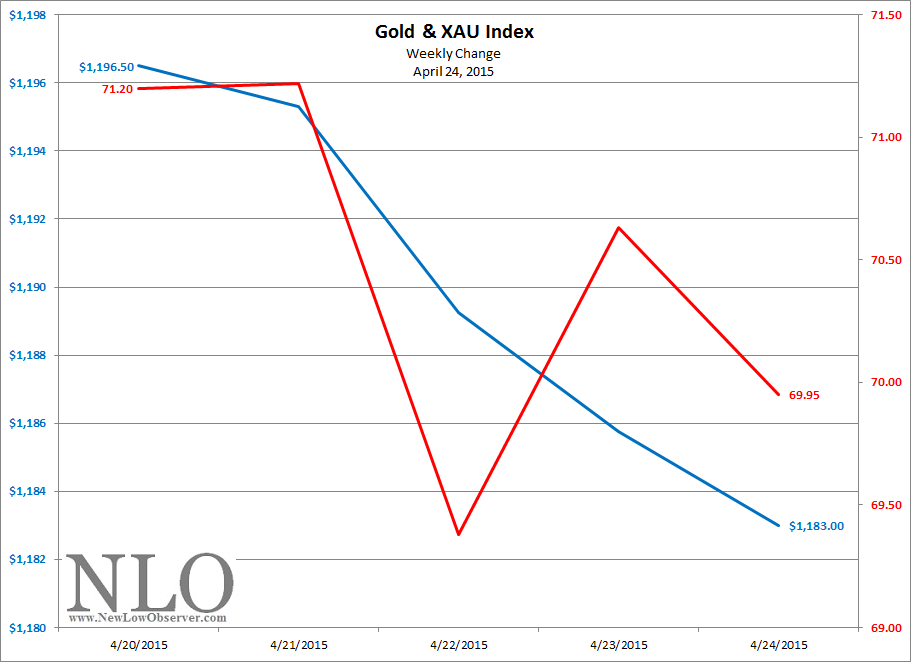
Another week of declines for gold and gold stocks. Gold fell –1.13% while gold stocks declined –1.76%.
The Gold Stock Indicator is treading water based on the otherwise listless action of gold and gold stocks. However, we’d like to review our commentary on gold from April 8, 2014. At that time, we said the following:
Gold and gold stocks parted ways in the last week. Gold was increased slightly while gold stocks declined –1.72%.
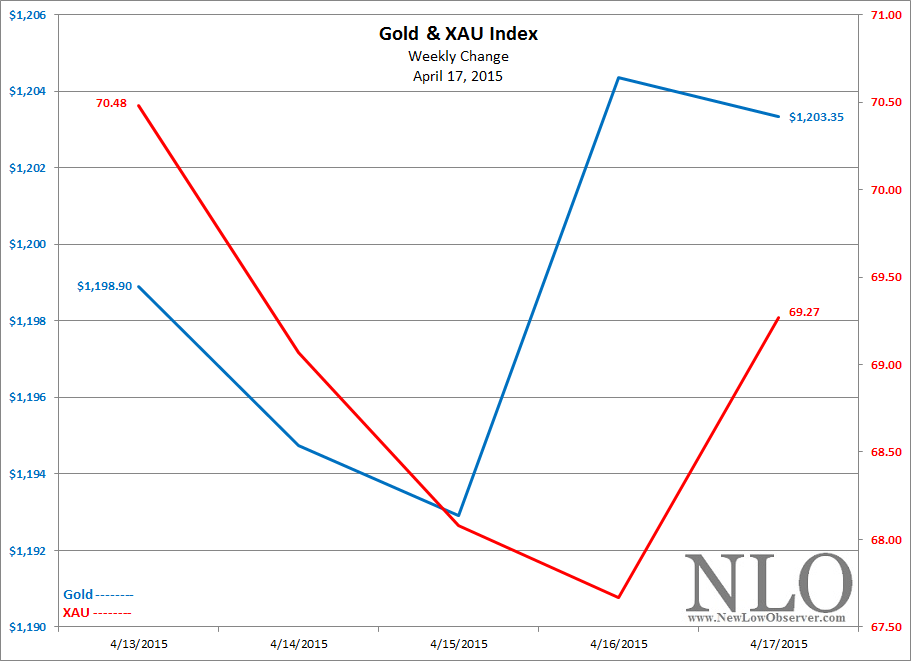
In the past week, gold has declined less that –1% while the gold and silver stock index has declined by –1.72%.
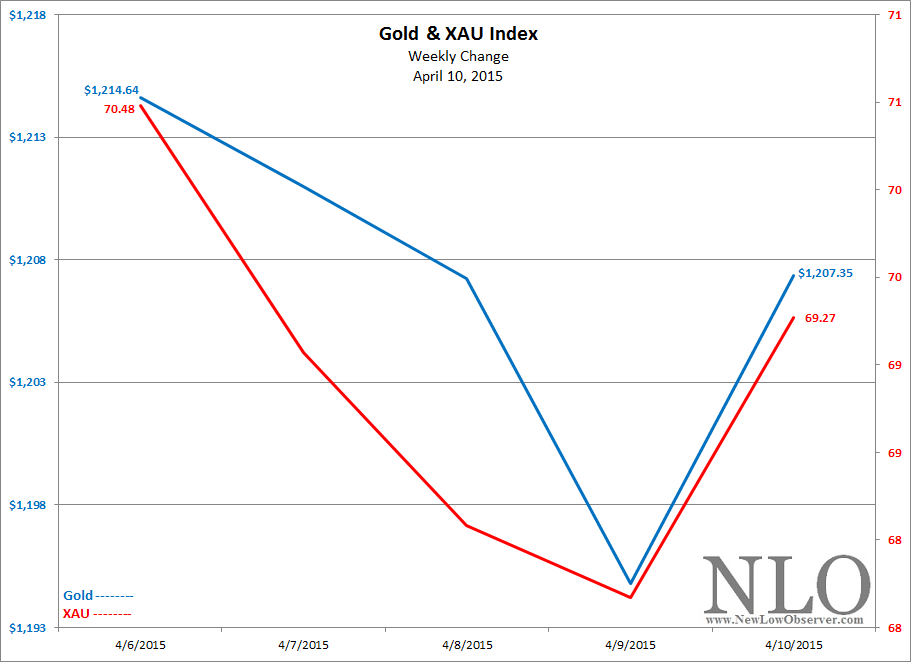
The Gold Stock Indicator nudged slightly higher in the last week. However, the long term perspective outlines the relative level of the indicator.
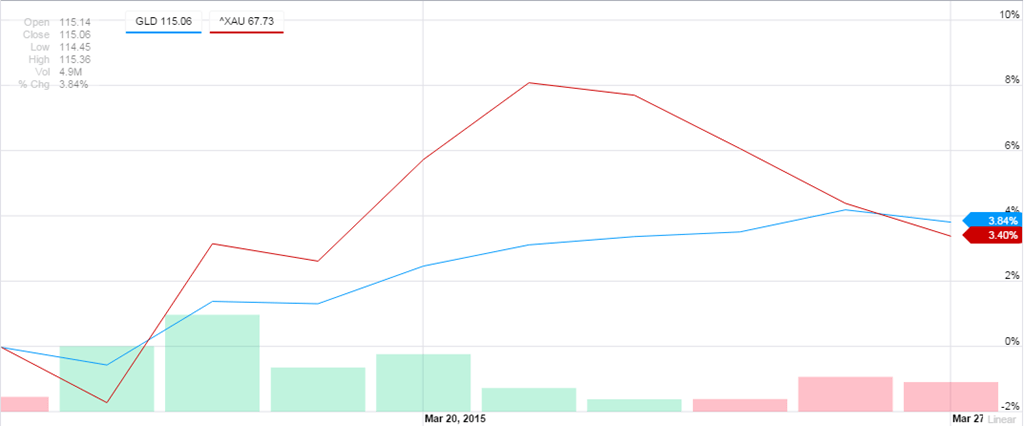
Since our last posting on March 13, 2015, gold (as represented by the SPDR Gold Shares) has increased by +3.84% while the Philadelphia Gold and Silver Stock Index has increased by +3.40%.
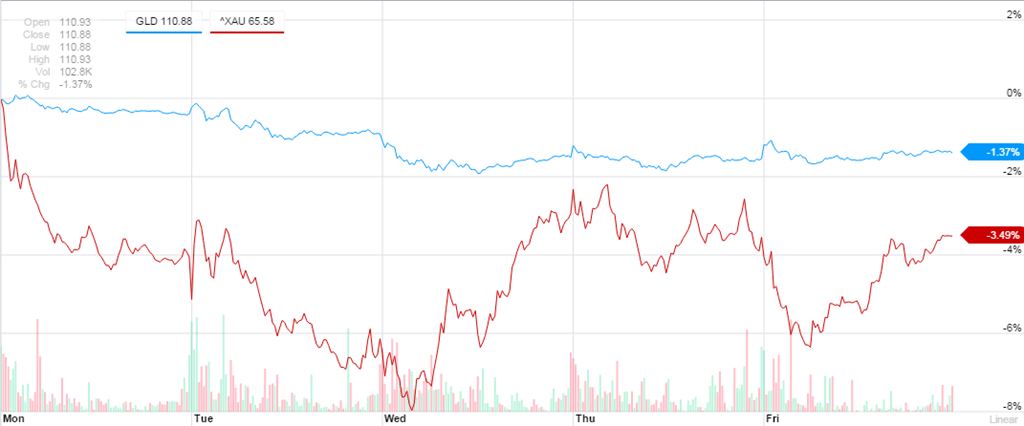
Gold declined –1.37% while the index for gold stocks declined by –3.49% in the past week. The closing numbers for gold stocks would be considered deceptive since the decline was much worse earlier in the week when the decline for the index was as much as –8%.
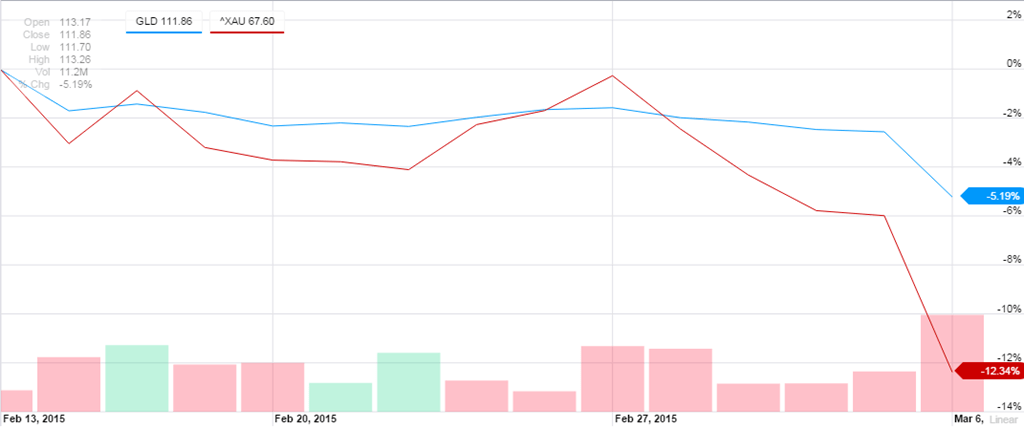
Gold, as represented by the SPDR Gold Shares (GLD), has registered a loss of –5.19% since our last posting on February 13, 2015. At the same time, gold stocks, as represented by the Philadelphia Gold and Silver Stock index (XAU), have declined –12.34%.
Since our January 30, 2015 posting, the price of gold, as represented by the SPDR Gold Shares (GLD), has declined –4.43% while the Philadelphia Gold and Silver Stock Index (XAU) has declined –2.87%.
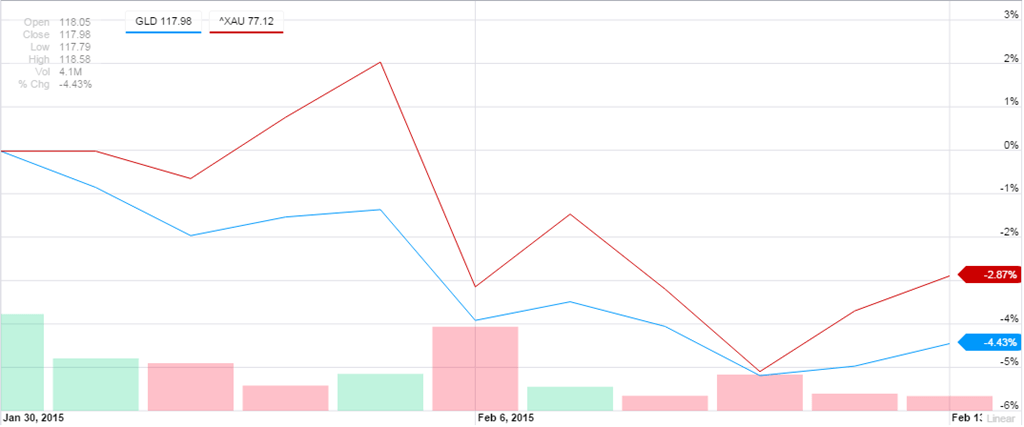
It is unusual that the price of the gold stock index would decline less than that of the price of gold. Either the gold stock index needs to decline much further or the price of gold should rebound. Remember that gold stocks are the sentiment indicator for the price of gold, therefore, the pricing action above might suggest that the gold declines aren’t sustainable.
The Gold Stock Indicator is reflecting this relative strength with the marginal declines as indicated in the chart below.
Gold was essentially unchanged this past week while gold stocks were up nearly +4%. So far the trend is pointing to higher gold as the November 2014 low remains in place.