Category Archives: gold

Gold Stock Indicator: December 2016

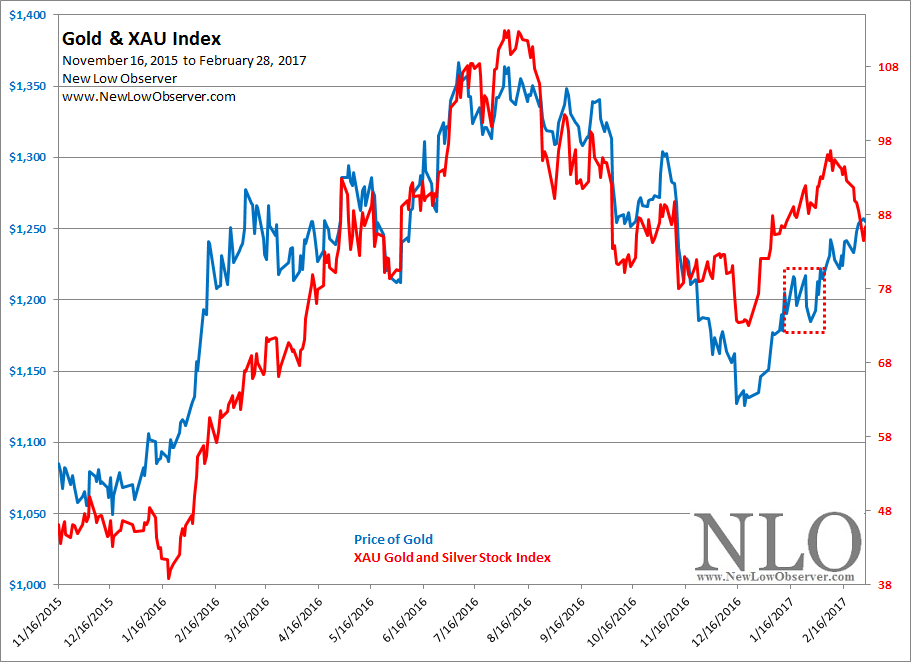
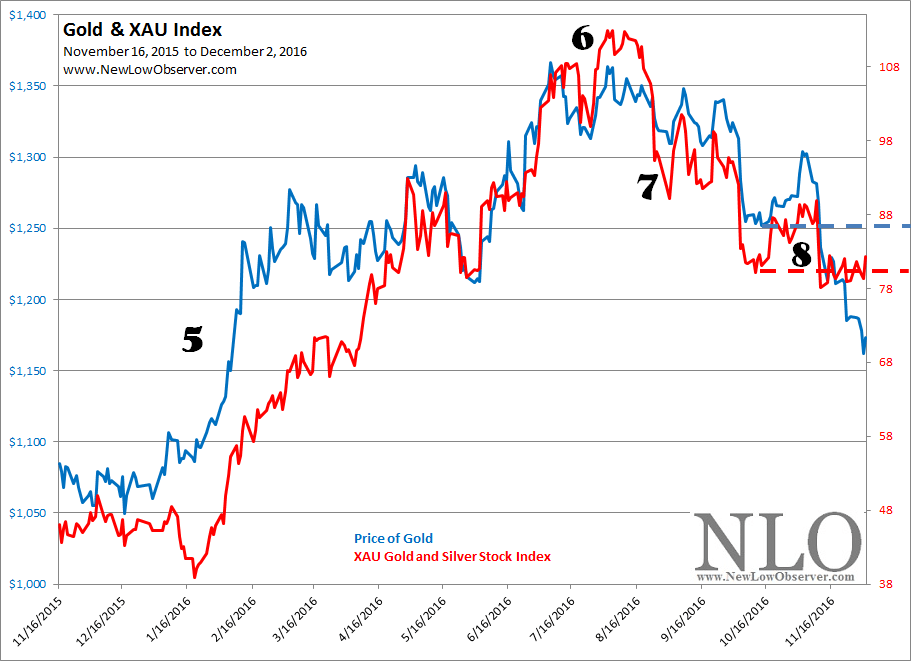
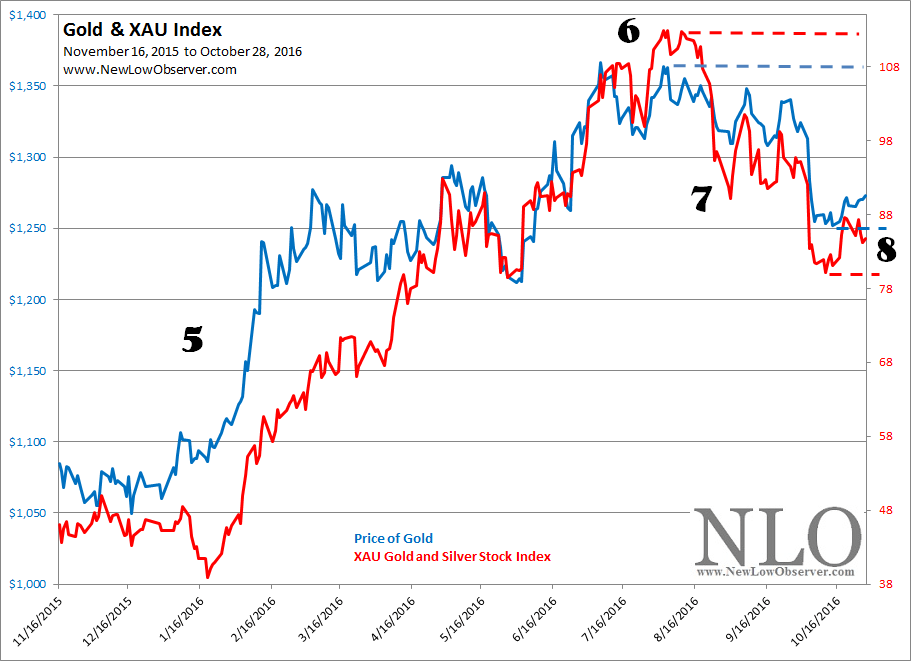
After our assessment on gold and gold stocks in October 2016, the price of both have declined but to varying degrees.  Gold declined by –7.82% while gold stocks, as represented by the Philadelphia Gold and Silver Stock Index (XAU), fell by –2.91%.

image

Gold Stock Indicator: October 2016

Since May 2016, gold and gold stocks, as represented by the Philadelphia Gold and Silver Stock Index (XAU), are managing to give us the most structurally significant pattern that a tea leaf reader could ever want.

image

Everything becomes easy with the pattern that has evolved.  According to Dow Theory, this is what is expected at this time in this excerpt from a 1939 series of articles in Barron’s that later became the book “Making the Dow Theory Work” by Sparta Fritz Jr. and A.M. Shumate:

Continue reading

Gold Stock Indicator: End of July 2016

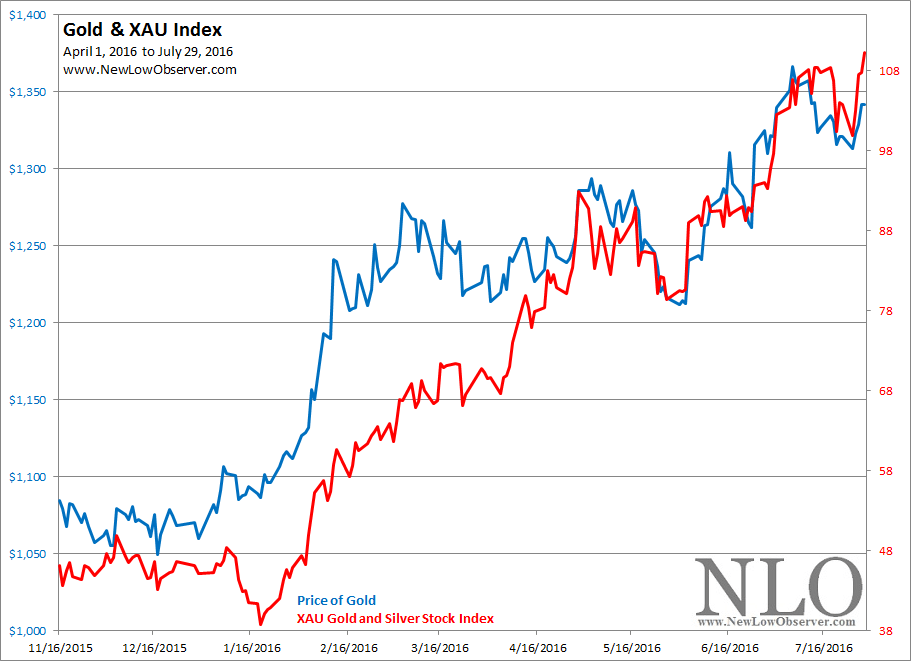
In the month of July 2016, gold increased +1.60% and gold stocks increased +12.94%.

image

Gold Stock Indicator: July 2016

The gold market is off and running.  There are many reasons for the current rise in the price of gold but it is all after the fact and may only be guessing at best.  It is important to note that “Brexit” has occurred six months from the respective lows in gold and gold precious metal stocks with each rising as much as 28% and 165%, respectively.  To our minds, giving credit to the turmoil in the UK for the increase of precious metals is somewhat misplaced and could lead to more wrong conclusions than a single “right” one.

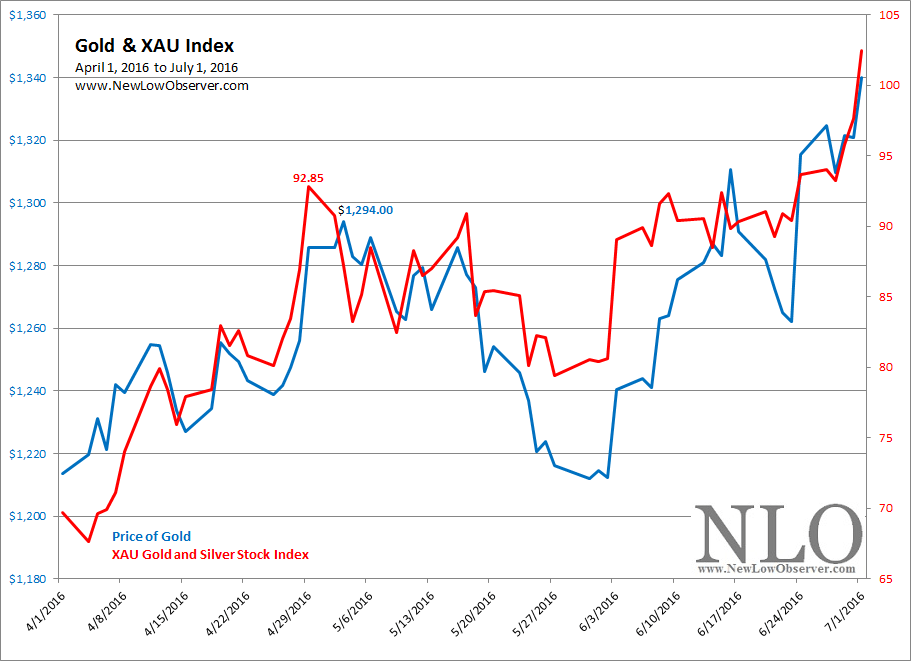
All that we’re considering is the price action and that alone is giving us food for thought. Below is the performance for gold and gold stocks from April 1, 2016 to July 1, 2016.

image

Since our posting on June 5, 2016, the price of gold has increased by +8.02% and the gold stock index has increased by +15.09%.

Gold Stock Indicator: June 2016

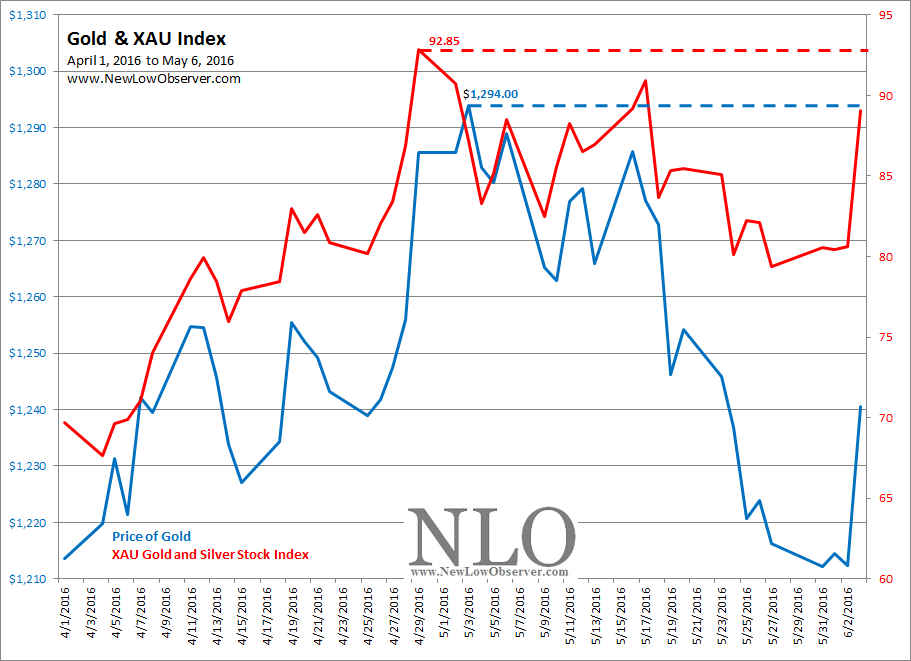
If you like a rising market then you definitely want the price of gold and gold stocks to increase above the level of $1,294 and 92.85, respectively.  Otherwise, there will be a big blowoff in the gold market and sizable downside risk.

image

Good News, Bad News

Gold Stock Indicator: April 2016

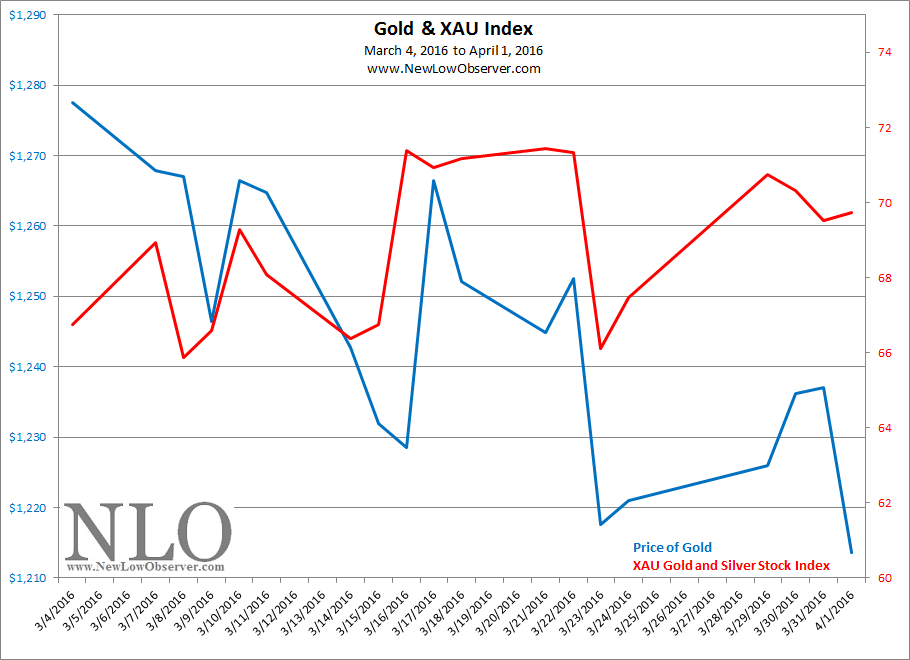
Since our March 2016 posting, the price of gold has decreased by –5.00% while the Philadelphia Gold and Silver Stock Index (XAU) has increased +4.45%.

image


Gold Stock Indicator: March 2016

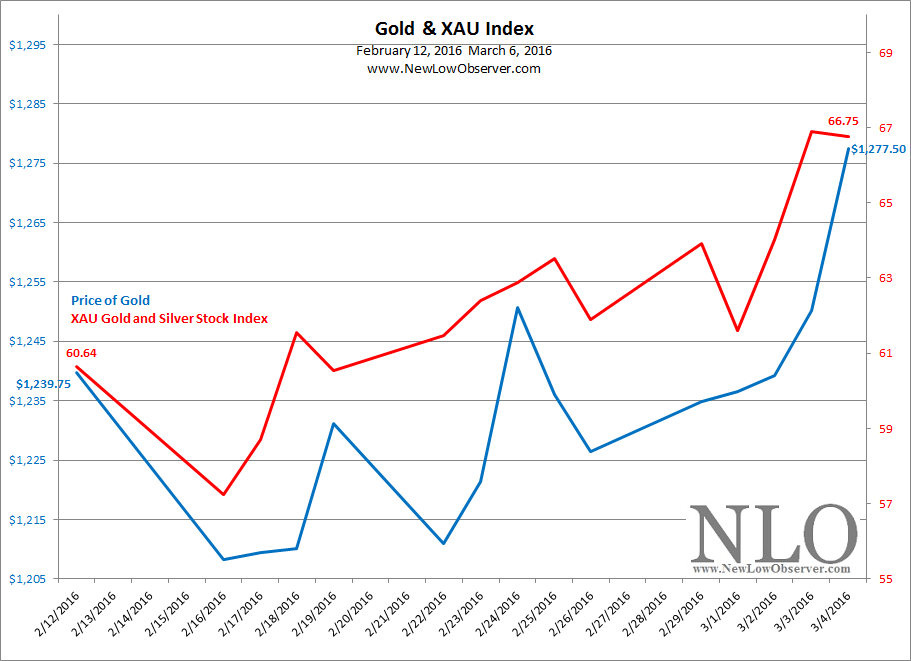
Since our February 12, 2016 posting, the price of gold has increased by +3.04% while the Philadelphia Gold and Silver Stock Index has increased +10.07%. 

image

There is the mistaken view that in order to verify the trend in the precious metals market based on Dow’s Theory, investors should compare the price of gold with the price of silver.  In fact, this is incorrect.

Gold Stock Indicator: February 12, 2016

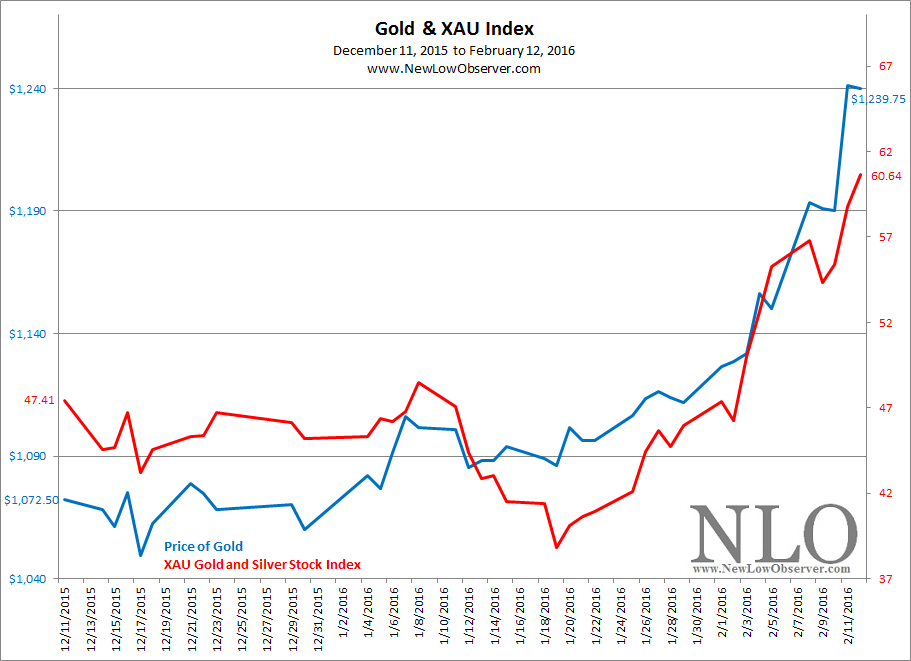
Gold and gold stocks have made a turnaround in the declining trend that has persisted over the last several years.  The reactions to a dramatic rise or fall in commodity prices is usually equal in violence and magnitude.  Gold has increased +15.59% while gold stock has increased +27.90% since our last posting.

image

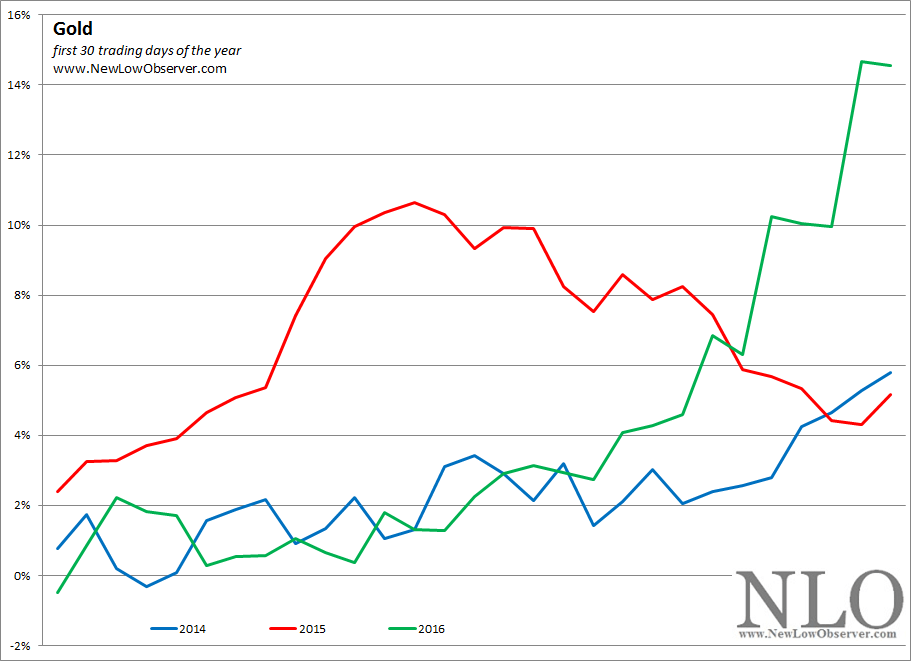
There is a lot of excitement in the gold investing community as there is the belief that this may be the long awaited bull market in gold which has been attributed by some by the advent of negative interest rate policies in major economies like Japan.  We remain hesitant to believe that all is well in the gold sector as this is the third year in a row that gold has started strong.  The last two years (2014 & 2015) both ended in the loss column for the year, in spite of the early gains.

image

The above chart shows exactly how gold garnered early gains.  For 2014, gold ended the year at a loss of –1.55% while the XAU index declined –21.11%.  For 2015, gold fell –9.55% and gold stocks fell –35.89%.  The early gains for 2016 are nice but new investors should accept what may come if there is a repeat of the last two years.

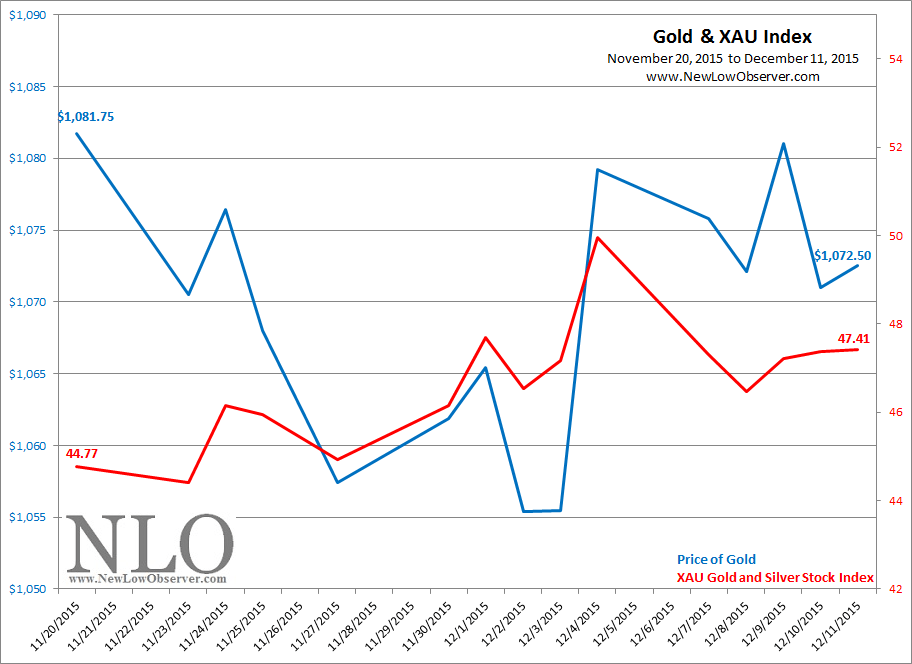
Gold Stock Indicator: December 11, 2015

Gold and gold stocks continue to struggle in an effort to remain in a trading range rather than collapse.  A fall is coming if we see the general equity markets decline, which would compound the abysmal performance of the precious metal stocks over the last five years.

image

Gold Stock Indicator

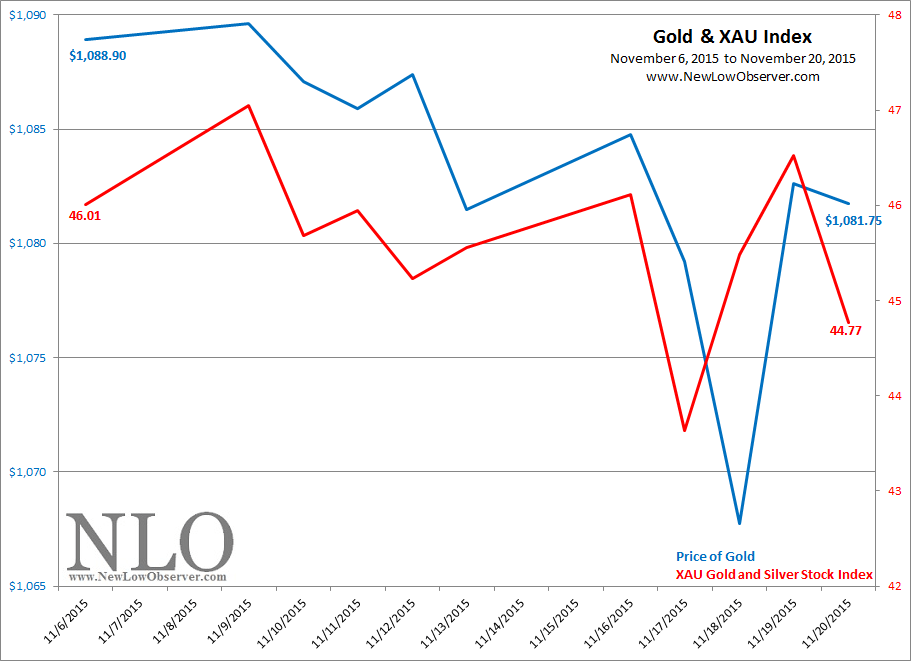
Gold Stock Indicator: November 20, 2015

Gold and gold stocks continue to languish as there appears to be no catalyst to propel prices higher. 

image

The perception of no reason for gold to increase adds to the despondency of traders and investors which compels selling.  However, we’d like to point out that in spite of the conventional wisdom, the prospect of an interest rate rise is the biggest unambiguous reason for gold to increase in value.  While a Fed rate increase is what everyone is waiting for, history suggests that Fed policy  (government regulated) follows short-term Treasuries (market driven).

image

In a barely perceptible way, the chart above demonstrates that all Federal Reserve rate increases were preceded by a rise in the 3-month Treasury.  The blue arrows indicate the reversal in the declining trend before 3-month Treasuries increased.  From this point, we can easily see that the Federal Reserve’s discount rate follows to the upside not long after.  We’ve only included the point in the interest rate cycle that corresponds to the phase that we are entering, coming from an all-time low to an eventual all-time high.

The price of gold cannot sustain a rise in the face of deflationary forces, which typically brings interest rates down.  As the cycle eventually turns, we will see a sustained increase in the price of gold (with the obligatory volatility).  Analysts will argue that it is not possible for the price of gold to increase in the face of rising interest rates, however, the period from 1948 to 1981 is exactly when gold had its last massive bull market (based on foreign free market price of gold from 1948-1971; U.S. price of gold from 1971-1981).

Gold Stock Indicator

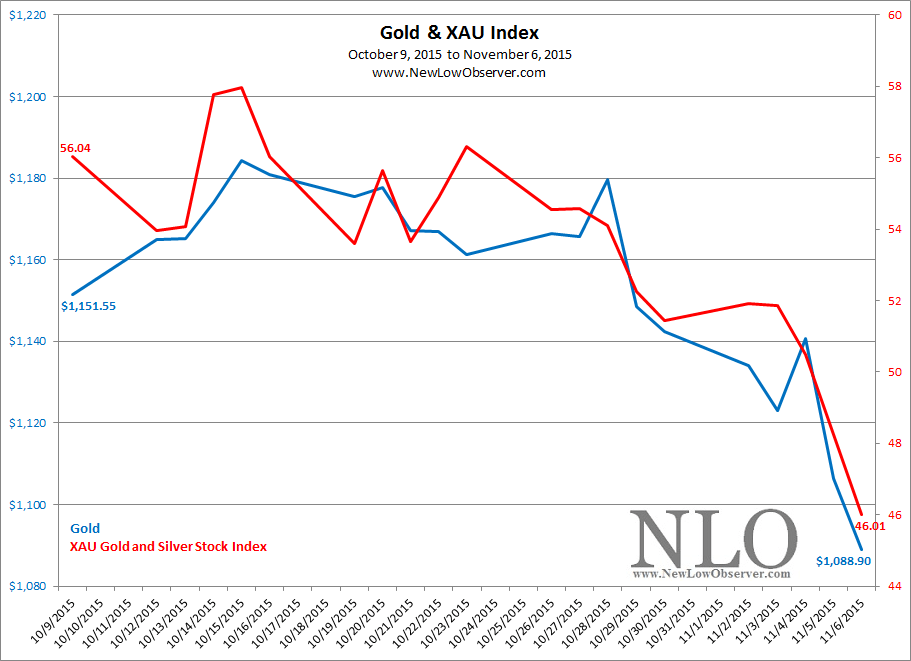
Gold Stock Indicator: November 6, 2015

Since our last posting, gold has slumped an additional –5.44% while gold stocks have declined –17.90%.

image

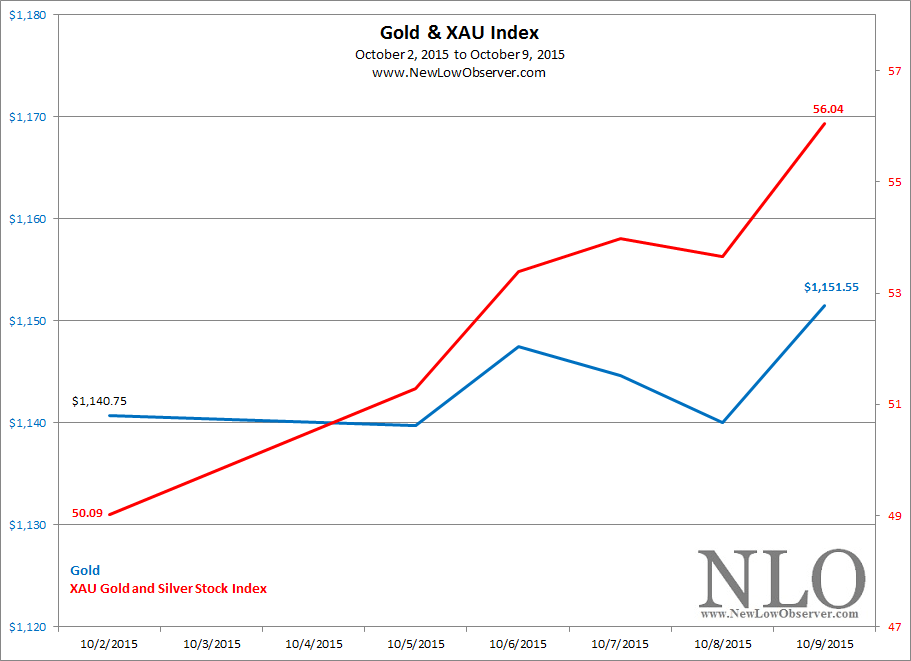
Gold Stock Indicator: October 9, 2015

It was a tale of two markets with the price of gold increasing less than 1% while gold stocks increased +11.87%.

image

Gold Stock Indicator: October 2, 2015

Since August 13, 2015, the price of gold has increased by +2.15% while the Philadelphia Gold and Silver Stock Index has declined –2.13%.

image

The price of gold could be considered to be on a tear given the fact that it isn’t falling, at the moment.

image

Continue reading

Gold Stock Indicator: August 14, 2015

In the past month, gold and gold stocks have been on a rollercoaster ride.  Gold declined as much as –4.59% while gold stocks, as represented by the Philadelphia Gold and Silver Stock Index (XAU), declined –17.88%.

image

Although there has been a recovery of sorts, we cannot be sure that the decline is over.

Gold Stock Indicator: July 17, 2015

Since June 29, 2015, the price of gold has declined –3.67% while the gold and silver stock index (XAU) declined -15.19%.

image

The recent declines are nothing compared to the full extent of the carnage that has been witnessed since the 2010 peak in gold stocks which have fallen –76%.  Meanwhile, the price of gold from the 2011 peak has declined -40.22%.

image

This decline is very much similar to the percentage declines experienced in the period from 1974 to 1976 when gold fell –44% and gold stocks fell –68%.

image

The following two quotes from Richard Russell (near the low in the gold market) seem appropriate given the current market conditions:

“The great fortunes have been made in the market by buying shares that no one wanted. S. African golds are nearing that point now. For those willing to "buy'em and put'em away," for those willing to write off a possible loss against a possible major gain, many of the marginal S. African gold shares are interesting now (Russell, Richard. Dow Theory Letters. April 2, 1976. page 6.).”

“In August of 1975 the golds fell out of the triangle and entered into one of the worst bear market collapses I have ever seen. By mid-1976 about 75% of all gold mine values were wiped out. Guessing at bear market bottoms for stock groups is always a hazardous occupation. Certainly, the action of the last month must be considered a panic in gold shares.  Bear markets often end with downside panic action. Therefore, in view of the time element of the bear market, the severity of the recent chaotic panic action, and the current gold pessimism, I am guessing that we will see the lows for most gold shares in this area. But I would say that holding gold shares is an uninteresting proposition unless relative strength for the group turns bullish. It hasn’t yet (Russell, Richard. Dow Theory Letters. July 30, 1976. page 5.).”