- Japan
- Market Indicator
- Price Momentum Indicators
- Richard Russell
- Silver
- Speed Resistance Lines
- U.S. Dividend Watch List
Category Archives: gold
Downside Targets for Gold
The prevailing controversy, among gold bugs, is whether or not gold stocks have bottomed. As our Gold Stock Indicator has indicated, so far, gold stocks have a long way to go before reaching lows similar to what occurred in 2008, on a relative basis. This debate about gold stocks only arise out of the fact that they have fallen so much while the price of gold has been “stable.”
Comments Off on Downside Targets for Gold
Posted in downside, Edson Gould, gold, speed resistance line
Gold Stock Indicator
The end of the week performance of our Gold Stock Indicator has brought us within striking distance of the “stage 2 buy” indication.
Richard Russell Review: Letter 554
Dow Theory Letters Issue 554 was written on February 7, 1973. At the time, the Dow Jones Industrial Average was indicated to be at the 968.32 level. This was at a point prior to the Dow Industrials declining –40% while the Dow Transports declined –37% to the late 1974 lows.
Gold Stock Indicator
We rely heavily on our Gold Stock Indicator for signs of when to buy gold stocks. The reason for this is because we found the alternatives, the Gold/XAU and XAU/Gold ratios, to be highly deficient. These two ratios were thought to be the bedrock of indications on when to buy and sell gold stocks. According to well known analyst John Hussman, the Gold/XAU ratio has the following indications:
Gold and Natural Inclinations
The dialog below is an interaction between one of our subscriber.
Gold Stock Indicator
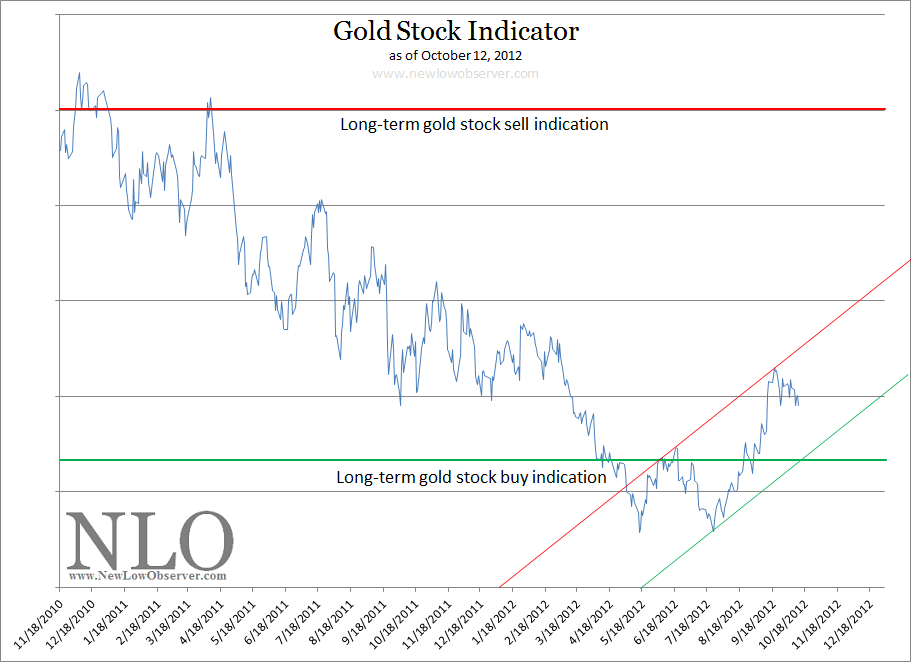
Based on our preliminary work, we believe that gold stocks, as represented by the Philadelphia Gold and Silver Stock Index, will reach our long-term gold stock sell indication between July 15, 2013 and November 25, 2013.
![]()
This is our best estimate based on the current trajectory of our Gold Stock Indicator. As we get closer to the dates, we will be better able to project the gold stock long-term sell indication with what we believe to be a certain level of accuracy.
This estimate is subject to change if the short-term gold stock buy indication (green diagonal line) is broken to the downside which would bring us back to the long-term gold stock buy indication. The scenario that could easily break the downside trendline is a general stock market decline. Although Dow Theory indicates that this is a possibility, we're waiting for the appropriate confirmation either up or down.
The best example of where the stock market is right now is reflected in the chart below, from our September 21, 2012 Dow Altimeter:

Royal Gold (RGLD) Speed Resistance Lines
In the chart below we’ve provided Edson Gould’s Speed Resistance Lines (SRL).
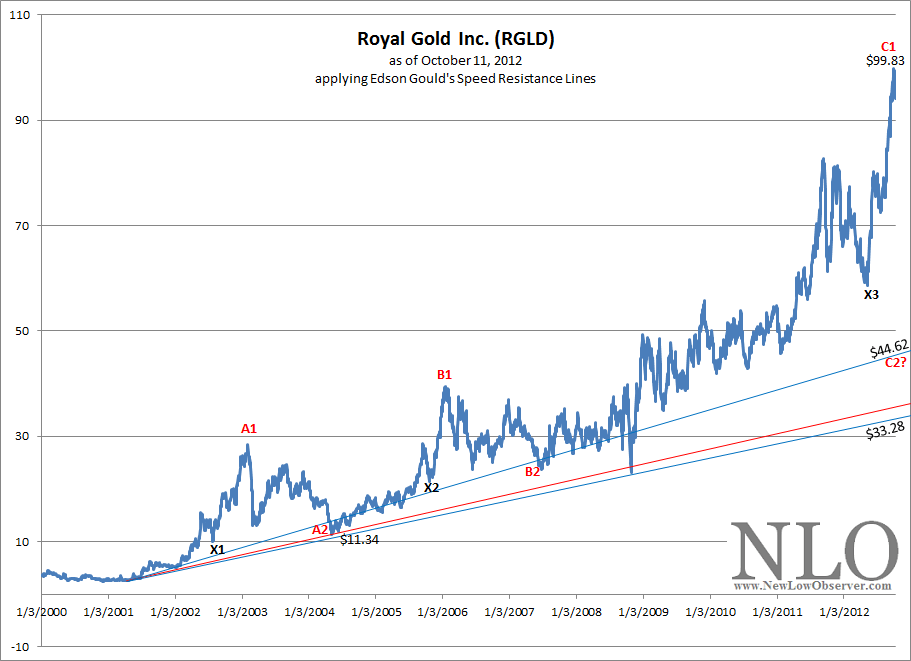
What is interesting about the above chart is the following:
-
Point A1 to point A2 declined –60%
-
Point B1 to point B2 declined –40%
-
Point C1 to point C2 is a projected decline of –55%
The SRL for Royal Gold at $44.62 doesn’t seem outlandish given what has already occurred in the previous declines from prior peaks. The X marks the first decline after a “minor” parabolic move that was later exceeded on a larger scale to point A1, B1 and C1. Additionally, the X reflects the minimum retracement from the top and has provided consistent support for the price for RGLD.
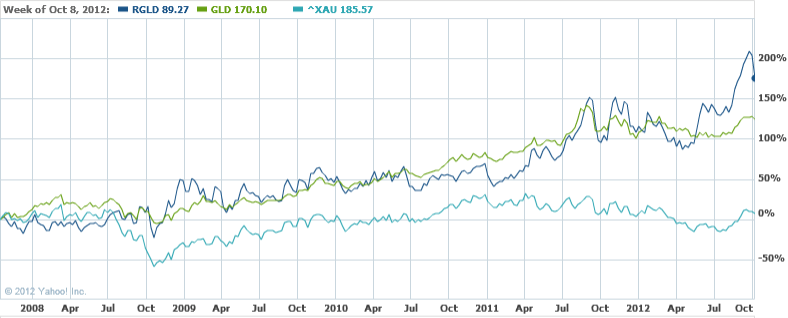
We’d consider buying RGLD if it declines to either of the support levels of X3 or C2. The movement of RGLD has been consistent with the price of gold (GLD) which is in stark contrast with gold stocks as represented by the Philadelphia Gold and Silver Stock Index (^XAU), as indicated in the chart below.
Posted in Edson Gould, gold, Gold Stock Indicator, RGLD, Silver, SRL
Gold Stock Indicator: Performance Review
Article Summary
-
Our Gold Stock Indicator is currently in a rising trend.
-
The XAU Index could rise another +25%, IF prior indications are correct.
-
Gold stocks have registered solid gains since our “blanket” recommendation to buy on July 31, 2012.
-
Our preference for NEM, ABX and GG exceeded returns of FCX, BVN and GFI.
-
NUGT increased +88.19%
Our Take
Gold stocks have registered solid gains since our recommendation on July 31, 2012 (found here). This recommendation was based on the fact that our Gold Stock Indicator was clearly in the long-term buy range as indicated by the red circle in the chart below:
We have a few observations that are worth considering regarding our Gold Stock Indicator.
The current parabolic rise at point (C) is matched by the rise the took place at point (A) and point (B). Point (A) took place from January 12, 1987 to April 9, 1987. The rise in the Philadelphia Gold and Silver Stock Index (XAU) at that time was +55.98%. To put this into perspective, during the same four months, Barrick Gold (ABX) rose +77.36% Newmont Mining (NEM) rose +60.86% and Agnico-Eagle (AEM) rose +33.87%.
At point (B), from February 5, 1993 to June 25, 1993, the Philadelphia Gold and Silver Stock Index rose +54.14%. Barrick Gold rose +43.29%, Newmont Mining rose +20% and Agnico-Eagle rose +98.34%.
So, what is the message in all this data? In theory, based on the two prior moves at point A and B, The XAU Philadelphia Gold and Silver Index could rise another 25%. If you believe in a further rise in gold stocks, then Barrick Gold is the one to own. You now have the date ranges so you can now compare any other gold stocks that are out there and see if there is a consistent performer out there other than Barrick.
Another observation is that there were three similar powerful parabolic moves that failed at points 1, 2 and 3. Because we really don’t know how much further this rise will go, we always advise that investors take the gains and rotate into whichever gold stocks are currently trading near a new low.
One thing you must remember, gold itself did not perform well in comparison to gold stocks. In 1987 and 1993 periods mentioned above, gold rose only +2.43% and +14%, respectively. This is why we call it the Gold Stock Indicator, it reflects the relative outperformance to the upside and downside, as compared to the actual precious metal.
For those willing to accept the risks, two alternatives to owning individual gold and silver stocks could consider Exchange Traded Funds (ETFs) in the form of Global X Silver Miners ETF (SIL) or Market Vectors Junior Gold Miners ETF (GDXJ). In the period from July 31st to September 28th, SIL increased +36.34% while GDXJ increased +28.46%. It is important to note that when you eliminate the individual stock risk with these ETFs, you inherit and assume brand new risks that may have not been fully revealed due to the relatively short history of ETFs.
The performance of all the gold stocks since the July 31, 2012 recommendation are as follows (our picks in yellow):
|
Symbol
|
Name | 7/30/2012 | 9/28/2012 | % change |
| PAAS | Pan American Silver Corp. | $15.18 | $21.44 | 41.24% |
| SLW | Silver Wheaton Corp. | $28.27 | $39.71 | 40.47% |
| GOLD | Randgold Resources Ltd. | $91.18 | $123.00 | 34.90% |
| RGLD | Royal Gold, Inc. | $76.63 | $99.83 | 30.28% |
| AUY | Yamana Gold, Inc. | $15.17 | $19.11 | 25.97% |
| ABX | Barrick Gold Corporation | $33.17 | $41.76 | 25.90% |
| GG | Goldcorp Inc. | $36.70 | $45.85 | 24.93% |
| NEM | Newmont Mining Corp. | $45.06 | $56.01 | 24.30% |
| SSRI | Silver Standard Resources Inc. | $13.07 | $16.03 | 22.65% |
| KGC | Kinross Gold Corporation | $8.59 | $10.21 | 18.86% |
| AEM | Agnico-Eagle Mines Ltd. | $44.16 | $51.88 | 17.48% |
| FCX | Freeport-McMoRan | $34.01 | $39.58 | 16.38% |
| BVN | Buenaventura SA | $36.89 | $38.96 | 5.61% |
| AU | AngloGold Ashanti Ltd. | $34.55 | $35.05 | 1.45% |
| GFI | Gold Fields Ltd. | $13.09 | $12.85 | -1.83% |
| HMY | Harmony Gold Mining Co. Ltd. | $10.07 | $8.41 | -16.48% |
As a follow-up, the Direxion Daily Gold Miners Bull 3X Shrs (NUGT) increased by the staggering amount of +88.19%.
Gold Stock Investors: To Beat Inflation Look to Food Processors, Producers and Distributors
We’ve long maintained the view that in order for long-term investors to beat inflation, the conventional wisdom of investing in gold and silver stocks is not the most advantageous way to benefit from what almost everyone believes is coming as a consequence of QE4ever. While we favor the physical metals (especially silver) and their paper derivatives like (GLD) and (SLV), we’ve also claimed that a specific strategy is needed in order to get the most mileage out of gold and silver stock investing. However, in order to really beat inflation, forget gold and silver stocks and instead consider companies involved in food processing, producing and distribution industries.
Before we can tackle our food processors, producers and distributors, we need to examine the well documented wealth destruction that has occurred in the gold stock sector in the last year despite the relatively slight decline in the price of gold. Below is a table reflecting the percentage range that many gold and silver stocks have experienced between their one year high and low.
| Symbol | Name | 1-yr % range |
| NG | NovaGold Resources Inc. | -69.33% |
| MUX | McEwen Mining Inc. | -68.23% |
| SSRI | Silver Standard Resources Inc. | -57.35% |
| PAAS | Pan American Silver Corp. | -56.19% |
| KGC | Kinross Gold Corporation | -55.98% |
| BAA | Banro Corporation | -53.55% |
| AUQ | AuRico Gold Inc. | -53.13% |
| AEM | Agnico-Eagle Mines Ltd. | -51.78% |
| HMY | Harmony Gold Mining Co. Ltd. | -44.81% |
| ABX | Barrick Gold Corporation | -41.79% |
| GG | Goldcorp Inc. | -41.74% |
| NEM | Newmont Mining Corp. | -40.69% |
| AU | AngloGold Ashanti Ltd. | -37.81% |
| GFI | Gold Fields Ltd. | -36.32% |
| BVN | Compania de Minas Buenaventura SA | -34.03% |
| SLV | iShares Silver Trust | -30.46% |
| GLD | SPDR Gold Shares | -15.50% |
In all instances, those who had invested in these stocks did not expect that they’d face the prospect of –30% declines in value before they’d realize a gain. In fact, many of these stocks are not at a break-even point if purchased a year ago. Naturally, this should lead inflationistas and gold bugs to feeling a high level of frustration with the belief that gold stocks are a true inflation hedge.
Some perpetual gold bull analysts/marketers argue that gold junior and exploration companies provide better investment opportunities as compared to the many large cap gold stocks like Barrick Gold (ABX), Agnico-Eagle (AEM), and Newmont Mining (NEM). However, the last year has been unforgiving to the larger junior and exploration companies as represented by the Market Vectors Junior Gold Miners (GDXJ) in the chart below:
As early as 2008, in an article titled “Why Gold Will Decline More than the Markets,” we’ve cautioned gold stock investors to be prepared for gold stocks to decline by a greater percentage whenever the general stock market, as represented by the Dow Jones Industrial Average (DIA) or S&P 500 Index (SPY), declines -10% or more.
Within the last year, the closest the Dow Industrials and S&P 500 came to a -10% decline was from April 2nd to June 1st when the indexes fell –8.63% and –9.93%, respectively. Unfortunately, the Philadelphia Gold and Silver Stock Index (XAU) was already in a declining trend after having lost -22.85% from the April 8, 2011 high until April 2, 2012. Despite this fact, the XAU Index managed to lose an additional –20.87% from April 2, 2012 to the May 15, 2012 low.
As an alternative to the “mines” of precious metal stock investing, we’ve recommended investing in food processors, producers and distributors that have a history prudent of dividend increasing policies to take advantage of the expectations of high inflation down the road. Among the many companies that we’re currently following closely in this sector are Hershey (HSY), ConAgra (CAG), and Sysco Foods (SYY).
With all the unexplained pain in the precious metal sector in the last year, companies like ConAgra (CAG), Hershey (HSY) and Sysco Foods (SYY) have continued to increase shareholder value, dividend payments and see steady gains in their stock price. Although the last two years hasn’t been as favorable for Sysco Foods, HSY and CAG have managed to keep pace with the overall market.
Our belief in the processors, producers and distributors is rooted in the performance of these stocks during the last precious metal bull market from 1970 to 1980 and beyond. In a piece titled “ConAgra: A History of Beating Precious Metals During a Commodity Bull Market,” we compared the performance of ConAgra to Newmont Mining (NEM) and Hecla Mining (HL) at the peak in the market in 1972, before the –42% decline in the Dow Industrials, and the subsequent peak in the commodity bull market in 1980.
What we found was that CAG matched the performance of NEM and HL by the end of the gold bull market in 1980 and went on to out-distance both stocks after the commodity bull market ended, by nearly seven time in 1983. As a follow-up to our initial ConAgra observation in November 21, 2010, we can see the performance of the same three stock in the chart below:
The performance of ConAgra over the last 2 years has been exceptional in comparison to Newmont Mining and Hecla Mining. Today, ConAgra reported that first quarter net doubled and raised their full year expected earnings. CAG’s stock was up +6.20% on the news. The news out of ConAgra suggests that processors, producers and distributors have much to gain from the coming inflation.
Precious metal enthusiasts will likely argue that the less than redeeming attributes of the companies selected (Newmont Mining and Hecla Mining) such as bad management, unprofitable properties, etc. contributed to the poor performance. Another common refrain is, “look how my gold stocks have done in the last 3 or 4 months.” We believe such arguments are the equivalent of whistling past the graveyard.
Consider the following data points, since June 30, 1972 CAG, HL and NEM have generated the following returns, according to Morningstar.com:
-
CAG: +9,021.62%
-
HL: -42.76%
-
NEM: +392.29%
When viewed from the perspective of trying to beat inflation, during the only proven gold bull market in recent history, gold and silver stocks don’t have the durability to truly beat inflation. For those that are ardent long-term value investors, you don’t really need to wade into the dark pools of precious metal stock investing where a mine can flood, a strike will break out, management can be slightly off with their estimates or the cost of production increases causing a stock to collapse in the middle of widely recognized gold bull market. Instead, focus your research and due diligence in the food processors, producers and distributors that are trading near their respective new lows. You will be rewarded far beyond the high inflation period to come.
Dividend Investors: Beware of Payments in Gold
As long-term investors in precious metals, we have featured several articles that warned about the pitfalls of gold and silver investing rather than highlighting the redeeming attributes in the sector. One reason for this is the one-sided analysis that permeates throughout the gold and silver investment community.
Too often there are voices clamoring for attention about reasons to invest in gold and silver and very few of those same voices willing to say “dump the junk.” Some analysts in the gold sector will defy logic by recommending gold stocks in an obvious declining trend rendering their analysis moot since anyone can use the rationale “we’re in a bull market” to justify their claims.
One sure sign that we’re in a gold bull market is when gold and silver mining companies start paying ever increasing dividends. In a 2009 article titled “Why Silver Beats Gold As a Precious Metals Play,” we said, “be mindful of the coming competitive dividend war between precious metal companies.” Apparently, precious metal stocks have not disappointed in sharing the wealth in the current gold bull market. According to Morningstar.com, in the last five years the top ten dividend increasing companies in the precious metal sector has averaged +29.61%. We don’t expect this trend to reverse in the near term.
| Symbol | Company | 5-year dividend growth rate |
| AEM | Agnico-Eagle | 84.42% |
| AUY | Yamana Gold | 50.61% |
| IAG | IamGold | 29.87% |
| DRD | DRDGold | 26.08% |
| NEM | Newmont Mining | 20.11% |
| GG | Goldcorp | 19.26% |
| ABX | Barrick Gold | 18.31% |
| BVN | Buenaventura | 17.97% |
| RGLD | Royal Gold | 17.50% |
| GFI | Gold Fields | 11.98% |
| Average dividend growth rate | 29.61% | |
| Source: Morningstar.com accessed August 15, 2012 | ||
Also, in the same 2009 article and later reiterated in our 2011 article titled “The Coming Precious Metals Dividend War,” we said the following, “one gold or silver company is going to ‘jump the shark’ and make the dividend payments in the actual metal. When that time comes, it will be fair warning to protect your positions, though this may be indistinguishable to ebullient gold bugs at the time.” When we published our October 13, 2011 article titled “Gold Resource: Gold Dividend Means Sell” we felt that precious metal investors had been given fair warning that “…it may be an indication of a cyclical or short-term top in the gold market.”
The announcement by Gold Resource (GORO) that the option for an “in-kind” dividend in the form of gold was on August 17, 2011 (PDF found here). Three trading days later, the price of the SPDR Gold Shares (GLD), according to Yahoo!Finance, peaked at $184.59. Twelve trading days after GORO’s announcement, according to Kitco.com, the London PM fix for gold closed at the peak price of $1,895. At the same time, the long established Philadelphia Gold and Silver Stock Index (XAU) declined as much as –33% by May, 15, 2012 and has settled at a loss of -26.80%.
As the precious metals dividend war heats up, the timing, nature of the dividend, and the quality of the company will provide for some perspective as to whether we are at a short/long-term peak in the precious metal market.
However, as we’ve said in the past, companies that pay dividends in gold have historically had difficulty in retaining such a policy. Those companies that currently have a policy of offering dividend payments in gold should be expected to discontinue such distributions at some point down the road. When that change in policy arrives, the news could push the respective gold and silver stock prices well below known “undervalued” levels.
If you must invest in precious metal stocks, we’d opt for those that are part of the XAU Index or the HUI Gold Bug Index and pay their dividends only in the form of cash.
