Category Archives: Dogs of the Dow

Dogs of the Dow: December 2018

The results for our Dogs of the Dow for 2018 are almost in.  In this posting, we will summarize our findings of the data that we analyzed on the Dogs of the Dow from 1996 to 2017.  We will demonstrate our “skin in the game” by checking the performance of the stocks that we actually bought based on our assessment.  Finally, you get to see the data we used and correct us on our errors. Continue reading

Dogs of the Dow

According to Wikipedia, the Dogs of the Dow, “…is an investment strategy popularized by Michael B. O'Higgins in 1991, which proposes that an investor annually select for investment the ten Dow Jones Industrial Average (DJIA) stocks whose dividend is the highest fraction of their price [highest dividend yield].”

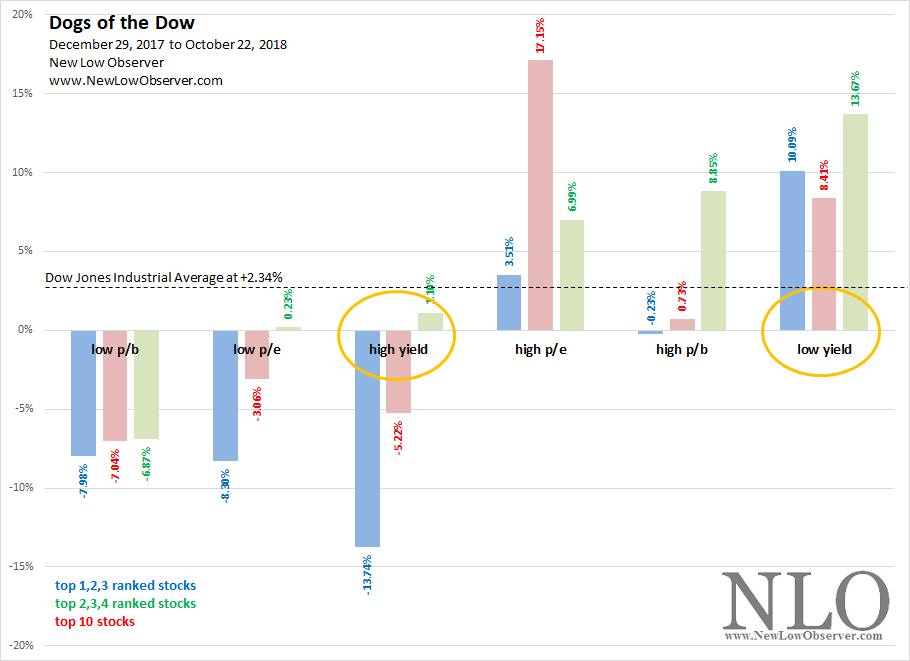
So far, in the year 2018, the ten highest yielding stocks have gained +1.10% while the ten lowest yielding stocks have gained +13.67%, on average.  In the same period of time, the Dow Jones Industrial Average has gained +2.34%.

image

The distinction between the highest yielding stocks as compared to the lowest yielding stocks is very important because the whole purpose of the theory by Micheal O’Higgins is that you’ll be able to consistently beat the Dow Jones Industrial Average if you choose the ten highest yielding stocks every year.

As our January 6, 2018 posting on the top shows, in the period from 1996 to 2017, the “Dogs” (highest yielding stocks) routinely underperformed the DJIA annually.  Because most investors are not in the position to buy ten stocks at the beginning of each year, we have provided performance data on the first three stocks (1,2,3) and the next best stocks (2,3,4).

There are several conclusions that should be drawn from the commentary above:

  • High yield equals high risk, even among blue chip category.
  • Fewer stocks means greater volatility.
  • Low yield DJIA stocks track momentum performance, exceptional reward with exceptional risk.
  • If you want “average” performance buy the index fund.
  • If you want exceptional return with more risk, buy the 2nd, 3th and 4th ranked stocks among the high p/e or low yield stocks.

Dogs of the Dow

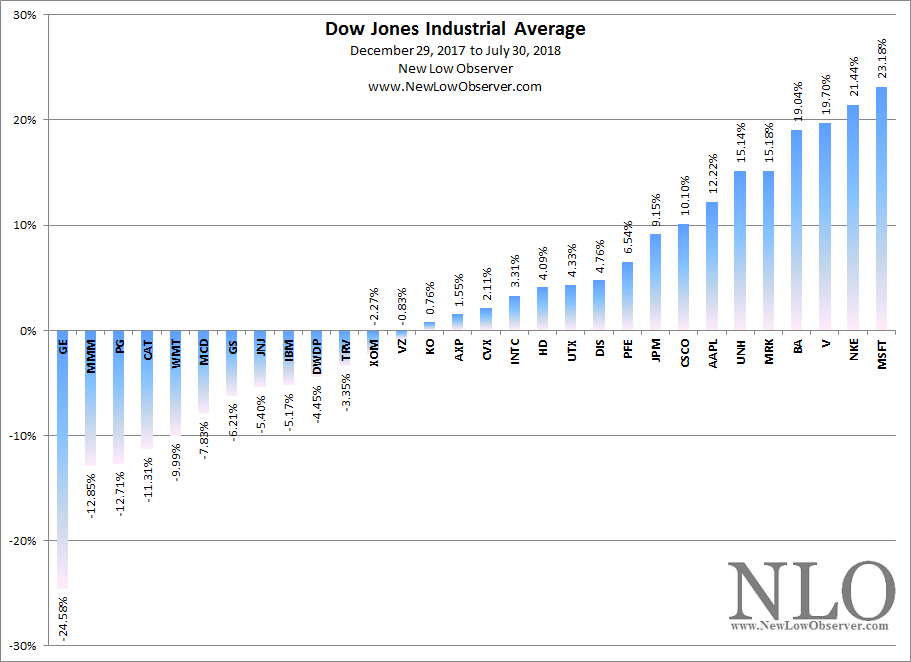
Below is the performance of the individual Dow Jones Industrial Average constituents from December 29, 2017 to July 30, 2018 (GE is no longer a constituent).

image

As expected, General Electric (GE) was dropped from the Dow Jones Industrial Average and replaced by Walgreen’s Boots Alliance (WBA).  However, for the sake of tracking the actual performance of the Dogs of the Dow, we will keep GE on the board until year end to get accurate performance data on the theory for selecting stocks.

Dogs of the Dow

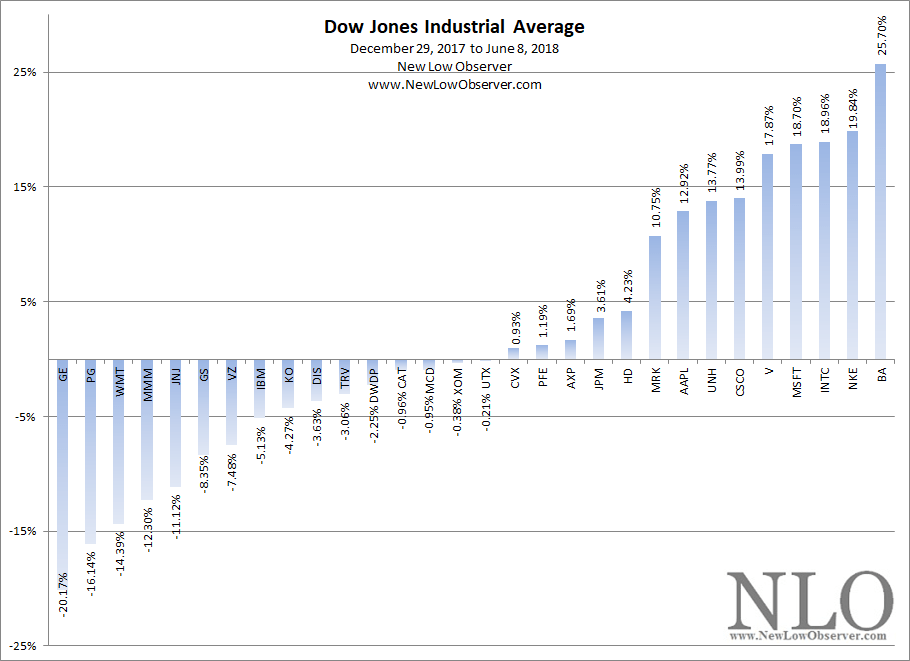
Below is the performance of the individual Dow Jones Industrial Average constituents from December 29, 2017 to June 8, 2018 (intraday).

image

Continue reading

Dogs of the Dow

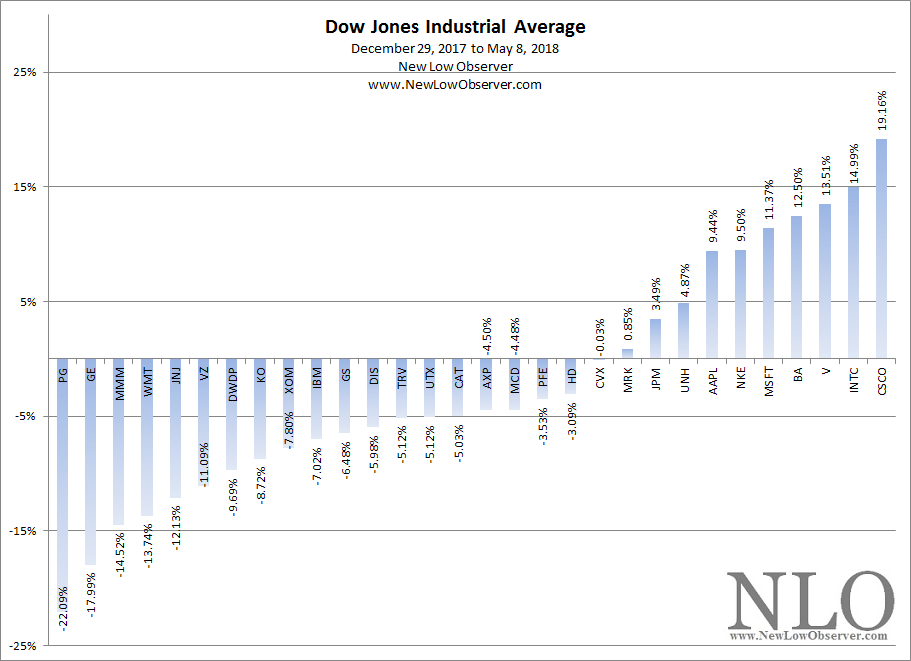
Below is the performance of the individual Dow Jones Industrial Average constituents from December 29, 2017 to May 8, 2018 (intraday).

image


Our examination of the Dogs of the Dow concept has upended our prior thinking on how to approach this investment strategy.  As we’ve seen, the original Dogs of the Dow has continued to prove an unfortunate investing process.  In addition, the data below shows that there is much to be learned on the road to beating the index.

Dogs of the Dow

On March 20, 2018, we posted the performance of the top three Dow Jones Industrial Average stocks in various fundamental categories.  Below is the emerging theme that has cropped up in recent work.

DJIA Update: March 2018

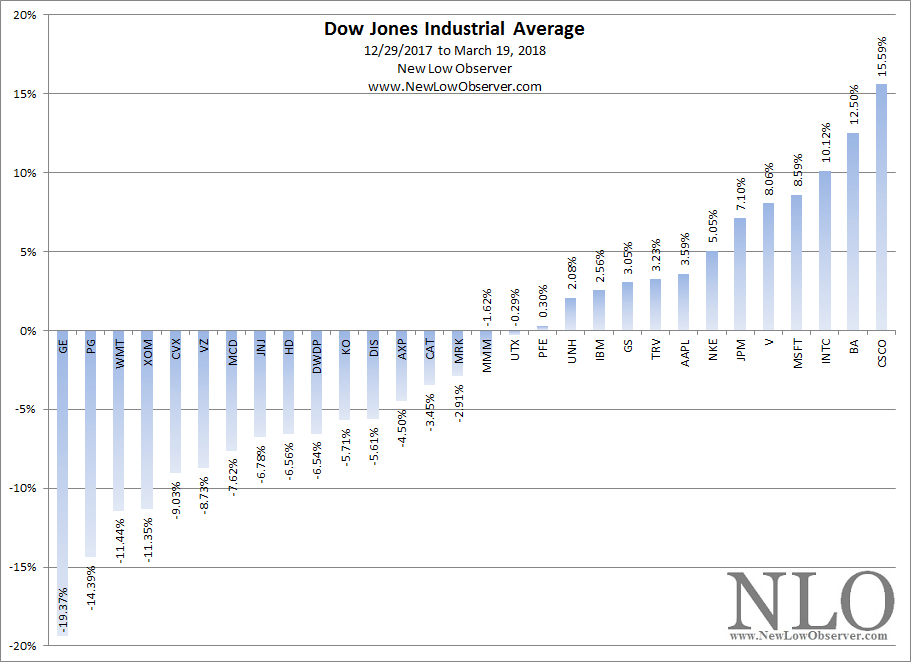
Below is the performance of the individual Dow Jones Industrial Average constituents from December 29, 2017 to March 19, 2018.

image

The Dogs of the Dow continue to underperform the Dow Jones Industrial Average by a considerable margin.

DJIA Update: February 2018

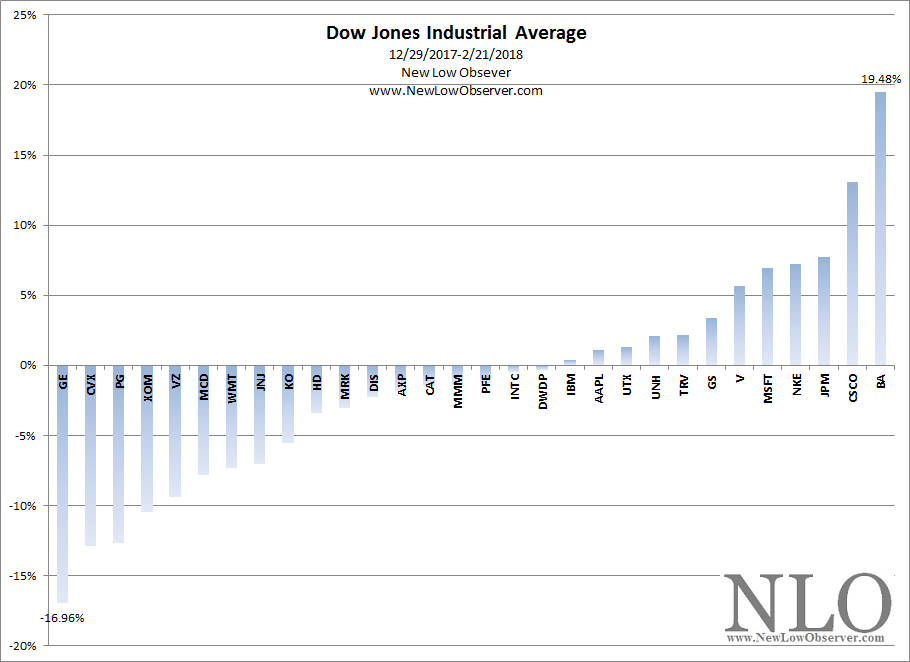
Below is the performance of the individual Dow Jones Industrial Average constituents from December 29, 2017 to February 21, 2018.

image

The latest update on the performance of the respective categories demonstrates, in part, the quality of analysis that we provided on the Dogs of the Dow investment theory.

DJIA Update: January 2018

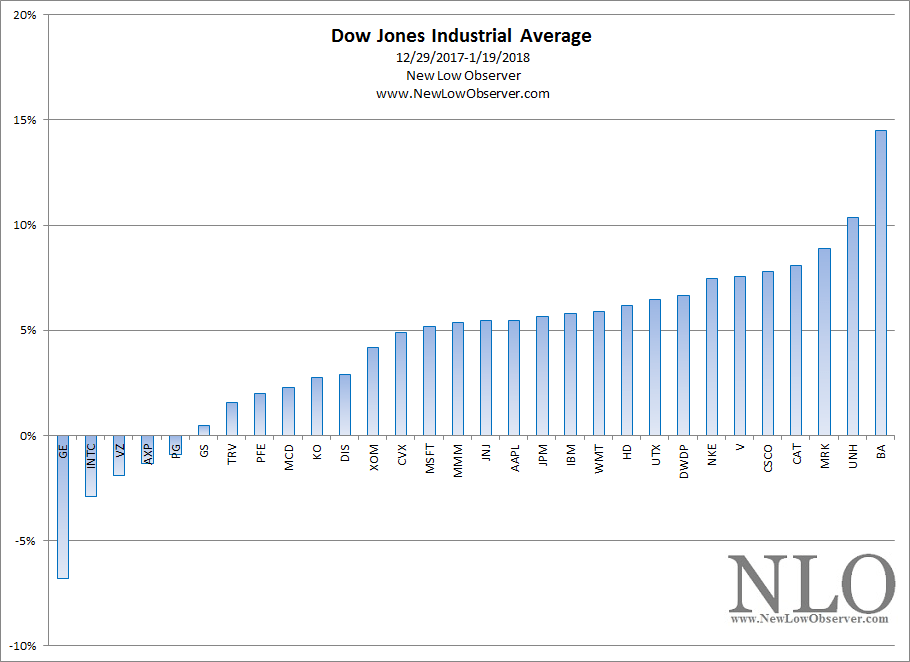
Below is the performance of the individual Dow Jones Industrial Average constituents from December 29, 2017 to January 19, 2018.

image

Our breakdown of the top three stocks in the respective fundamental categories is illuminating in spite of the short time under review.

Continue reading

Dogs of the Dow – A Review of the Past

What a year it was for the bull market in 2017, which naturally should have lifted all stocks and most asset classes. We've seen the rise in equities, real-estate, and new asset classes like crypto currencies. That being said, we'd take any opportunity to review strategies used in the market in an attempt to grow our assets. The start and end to the new year is a perfect stop to revisit a strategy known as the Dogs of the Dow.

In this piece, we're going to review the 2017 performance of the Dogs of the Dow and look back to the period of 1996 to 2017.

2017 Dogs of the Dow Performance Review

The purpose of any investment strategy is to exceed the performance of the stock market averages.  In the year 2017, the Dow Jones Industrial Average gained +25.10%.  The Dogs of the Dow, the 10 highest yielding stocks, gained +19.45%.

Knowing us, we can't leave well enough alone.  We asked ourselves, how good is the highest dividend yield performance?  To answer that question, we applied Charlie Munger's rule of "always invert" when confronted with a difficult question.  So we ran the performance numbers of the 10 lowest dividend yielding stocks.  One thing led to the another and we ended up with the following results.

Below is the performance table of the various fundamental attributes that we followed for the top 10 and top 3 ranked Dow stocks.  As you can see, the top 10 low yielding stocks gained +27.33%, exceeding the top 10 high yielding stocks by 7.88%.  More astoundingly, if you bought the top 3 low yielding stocks, you would have beat the top three high yielding stocks by +19.52%.

Looking at the performance of 2017, it could naturally be said that maybe the last year was a fluke.  However, when looking at the average performance of the same categories since 1996, we find that the high yielding stocks managed to get beat out by the low yielding stocks, easily.

Of all the categories since 1996, the Dogs of the Dow (top ten highest yielding)  was the worst performing metric by which to attempt to beat the Dow Jones Industrial Average.  The two metrics that have beat the Dow over the period from 1996 to 2017 are the improbable high p/e and high p/b.  We can't give an explanation for why these two approaches managed to do so well.

As a footnote to the last chart, to beat the Dow Jones Industrial Average by buying only the top three stocks, the best performers were (in descending order) high p/e, low yield and then the Dogs of the Dow. For some reason, the high p/e stocks beat the Dow in either the top ten or top three category.

Dogs of the Dow: Data

Below we summarize a point about Dogs of the Dow that is necessary for anyone who wishes to employ such a strategy.

Dogs of the Dow: Part 3

The Dogs of the Dow investment strategy is designed to take advantage of high quality stocks that are undervalued within the Dow Jones Industrial Average.  The “dogs” are the ten stocks with the highest dividend yield in descending order.  Courtesy of the website Dogs of the Dow, we are presenting the performance of this investment strategy compared to the Dow Jones Industrial Average since 1996:

year Dogs of Dow DJIA
2016 16.10% 13.40%
2015 -1.20% -2.20%
2014 7.00% 7.50%
2013 30.30% 26.50%
2012 5.70% 7.30%
2011 12.20% 5.50%
2010 15.50% 11.00%
2009 12.90% 18.80%
2008 -41.60% -33.80%
2007 -1.40% 6.40%
2006 24.80% 16.30%
2005 -8.90% 0.60%
2004 0.50% 3.10%
2003 23.60% 25.30%
2002 -12.20% -16.80%
2001 -7.80% -7.10%
2000 2.70% -6.20%
1999 1.10% 25.20%
1998 7.80% 16.10%
1997 17.30% 22.60%
1996 24.50% 26.00%

In prior articles (Part 1 & Part 2), we have proposed that using the same narrow group of stocks and applying various methods can generate far greater returns.  However, as investors, our primary consideration isn’t as much about profits as it is about losses.  We would rather know, in advance, what to expect when markets are falling rather than when they are rising.  Below we have outlined the performance of the Dogs of the Dow (and others) when the Dow Jones Industrial Average has declined in 2000, 2001, 2002, 2008, and 2015.

Dogs of the Dow: Part 2

To refresh, the Dogs of the Dow investment strategy is based on the work of Michael O’Higgins’ book Beating the Dow.  This approach is by no means the first attempt at a mechanized approach to investing in the Dow Jones Industrial Average.  The June 1951 Journal of Finance article by Henry S. Scheider titled “Two Formula Methods for Choosing Common Stocks” was the earliest system that we could find which covers a similar investment strategy as Dogs of the Dow from 1914 to 1948.  The results give mixed picture on he data presented (we’ll have to save that for another day.)

When looking at the website Dogs of the Dow, we find a complete list of annual performance of stocks and their performance from 1996 to the present.  In our posting of Part 1, we showed how the Dogs of the Dow performed from November 4, 2016 to November 15, 2017.  We also compare the performance of the highest yielding stocks to price-to-earnings, price-to-book and lowest dividend yield.  The results confirmed what we’ve seen in the performance reviews of the U.S. Dividend Watch Lists.

In an attempt to better understand the data and avoid the bias that goes along with data that we find appealing to our senses, we’ve generated a breakdown of the Dogs of the Dow  for 2017 and compared it to the 2017 year-to-date YTD performance of the various fundamental metrics to see what would have generated higher returns, if at all.  In addition, we’ve included the top three and top ten (traditional Dogs) to see if there is any material difference in performance over the covered period in question.

In Part 3 of this series on the Dogs of the Dow, we will see how the stocks perform in the year 2008.  Thus giving us a more complete picture of the risks associated with using a mechanical investment strategy.

Dogs of the Dow: Part 1

Based on the work of TradingTips.com, the following are the Dogs of the Dow (ten highest dividend yielding stocks) from November 4, 2016 and their performance as of November 15, 2017 (intraday):

symbol name total return
PFE Pfizer Inc. 23.93%
CSCO Cisco Systems, Inc. 17.63%
KO The Coca-Cola Company 16.25%
VZ Verizon Communications Inc. -1.36%
MRK Merck & Co., Inc. -3.73%
XOM Exxon Mobil Corporation 2.01%
CAT Caterpillar Inc. 68.31%
CVX Chevron Corporation 15.81%
BA The Boeing Company 95.67%
IBM IBM 1.38%
Average % change 23.59%

TradingTips.com also published a subset of the above list called the Small Dogs. (five lowest priced of the above 10 stocks). Those stocks from November 4, 2016 to November 15, 2017 (intraday)  have had the following performance:

symbol name total return
PFE Pfizer Inc. 23.93%
CSCO Cisco Systems, Inc. 17.63%
KO The Coca-Cola Company 16.25%
VZ Verizon Communications Inc. -1.36%
MRK Merck & Co., Inc. -3.73%
Average % change 10.54%

Below, we have generated the average performance of the top 3 Dow Jones Industrial Average (DJIA) stocks in the listed categories From November 4, 2016 to November 15, 2017 (intraday).  The results show a considerable contradiction to the conventional wisdom on this topic.

Continue reading