Below is a great charting of Dow’s 50% Principle from the work of Richard Russell. Continue reading
- Japan
- Market Indicator
- Price Momentum Indicators
- Richard Russell
- Silver
- Speed Resistance Lines
- U.S. Dividend Watch List

Below is a great charting of Dow’s 50% Principle from the work of Richard Russell. Continue reading
Posted in 50% principle, bear market, bear market rally targets, Dow Theory
Tagged members
A reader asks:
“So...what does Dow theory indicate to you, NLO? This Dow Theorist thinks we have experienced capitulation, and it could be smoother going forward.”
Our response:
Step 1: We will review the work as presented by Jack Schannep.
“…a short-term oscillator which measures the percent of divergence between the three major stock market indices (DJIA, S&P500, and the NYSE Composite), and their time-weighted moving averages. When all three indices are simultaneously in double digits below those respective moving averages, we have Capitulation. The most recent occurrence of Capitulation is shown below. The 16 dates, market levels, and the subsequent returns over various timeframes are shown below. You’ll see that the end of the last 9 bear markets were signaled, and 3 of the 7 before that. Some bear markets end, however, with a whimper, hence no Capitulation indication.”

Step 2: We address some house cleaning issues.
First and foremost, the above Capitulation Indicator is not Dow Theory. This is not a problem as the data should speak volumes, as it does in this case.
Second, the S&P 500 index did not exist until 1957. The merging of Standard Statistical Company and Poor’s, creating Standard & Poor’s, did not occur until 1941.
For this reason, the claimed data from 1953 to 1957 is based on reconstituting of the index based on stocks that would have mimicked the Dow Jones Industrial Average or the New York Stock Exchange Composite.
Using the S&P 500 data from 1957 arrives at only 37% of available data that can be found for the Dow Jones Industrial Average.
Step 3: The data: Initial Thoughts
In the Capitulation Indicator above, we like to eliminate indications that occur within a year of the last indication. Why? Because it artificially increases the outcome. Additionally, it puts into question the decision of whether to use the indicator the second time if the market was lower than the initial date. This would have resulted in the elimination of the following dates:
These dates would have been considered false signals, in our view, comprising 33% of the averaged data.
This brings us to the dates that are suggested. Did the S&P 500 decline below the level that the Capitulation Indicator suggested? Yes, on several occasions, the S&P 500 declined below the prior signal. Does the mean that the indicator is unprofitable? No. However, when the closing commentary on the data is “…Some bear markets end, however, with a whimper, hence no Capitulation indication” and only a third of the data is covered, we cannot make a fair assessment of the qualitative elements of the Capitulation Indicator.
Conclusion:
All we can say is that some refinements are needed based on what we have seen so far. Regarding Dow Theory and potential downside & upside targets, the subscriber links below outline in detail our take on the topic.
A bear market is upon us so it's time to dust off these books that can help us navigate through this market.
Posted in bear market, bear market rally targets, book
You want higher gold prices? You got higher gold prices. However, we have to add, be careful what you ask for. The anxiety associated with what's gonna happen next in gold and gold stocks will have investors and speculators looking over their shoulders. This will mean many sharp declines and dramatic recoveries.
In the month since our last posting, gold has increased only +6.21% while the price of the Philadelphia Gold & Silver Stock Index (XAU) has increased +26.97% in the same period of time.

In our October 3, 2014 posting, regarding the XAU Index, pointed out the following:
“In the chart above we have labeled the three potential downside targets of 75.99, 67.55 and 59.11 from the current level with the additional downside target of 41.85 as the ‘last stop’ in our downside analysis. Anything below the ascending 76.32 level is considered undervalued and underappreciated.”
Little could we have known that the index would actually decline to 38.84, a level below the end of the last bear market that ran from 1996 to 2000. The chart below points to where the current run up could meet significant resistance.
Our posting from May 12, 2012 should have said it all, we said the following:
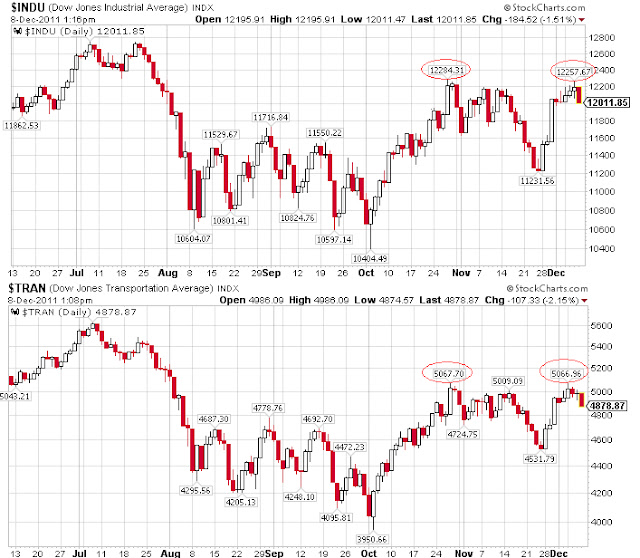
“We believe that the break below 12,715 on the Industrials and 5,047 on the Transports would lead to a more bearish move for the market, at least for the intermediate term.”
On May 14, 2012, the Dow Jones Industrial Index fell to the closing low of 12,695.35. This was below the 12,715 level that we believed was a critical support level for the Industrial Index.
On May 17, 2012, the Dow Jones Transportation Index fell to the closing low of 4,938.18. On May 18, 2012, the Transports fell to the closing low of 4,873.76. This was significant in that it was below both the 5,047 level and below the 200-day moving average.

As of Friday May 18, 2012, the bear market rally, which began on August 9, 2011 (found here), is over. Now it is a simple matter of how much of a decline that we have in store. The following are the downside targets for the Dow Jones Industrial Average (% decline based on 5/18/2012 close):
We will reassess the downside moves when and if the above targets are met.
Review
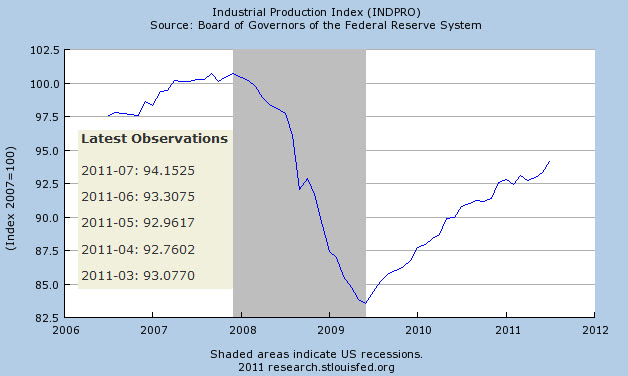
On August 23, 2009, using Dow Theory and the Industrial Production Index [IPI], we predicted that the National Bureau of Economic Research (NBER) was going to say that the recession ended in June 2009 (article here). We specifically said the following:
“Implicit in my discussion of the IPI [Industrial Production Index] is that we are at a turning point for the economy. Based on the combination of the Dow Theory confirmation of July 23, 2009 and the IPI turning up from the June low, I will have to guess that the National Bureau of Economic Research (NBER) is going to proclaim June 2009 as the official end to the recession. The end to this recession will be lackluster and questioned from all corners.”
As has been the case historically, the announcement that the recession had ended came 1-year and 3 months after the fact (NBER announcement found here.) Additionally, few have been satisfied with the definition of a recovery especially if it means that job growth and income increases have not been exceptional.
Now we are faced with what we believe could be the defining moment for a sustained stock market and economic decline worthy of being deemed (by NBER) a recession. The factors that go into this assessment are based on our interpretation of Dow Theory and the vacillations of the Industrial Production Index.
Dow Theory
Starting with Dow Theory, we have the following established indications:
Generally speaking, Dow Theory acts as a leading indicator of the direction of the overall economy, with the Industrial Production Index following behind as confirmation. In this case, this is the first month that the Industrial Production Index (IPI) has declined after the Dow Theory bear market indication of August 2, 2011.
Industrial Production Index
Historically, the Industrial Production Index has “averaged” a decline of 1.44 consecutive months in periods of an economic growth period. This suggests that if the Industrial Production Index declines for two full months in a row, it would be enough to give us the all clear as to whether we can consider the economy as having reverted back into a recession after the rise from the June 2009 bottom. This interpretation relies on Dow Theory also having a bear market indication. In order for this to be the case, The Dow Industrials and Dow Transports would need to remain below their respective 2012/2011 peaks.
| Month | IPI data |
| August 2011 | 94.1845 |
| September 2011 | 94.3800 |
| October 2011 | 94.9389 |
| November 2011 | 95.0939 |
| December 2011 | 95.9095 |
| January 2012 | 96.5705 |
| February 2012 | 96.5731 |
| March 2012 | 96.5685 |
| Source: | St. Louis Fed |
What would the Market Impact Be?
So far, we expect that the recessionary period would have at least four consecutive months of declines in the Industrial Production Index (IPI) and a total of at least 7 non-consecutive months of declines within the period considered a recession. This would be on par with the recession from July 1990 to March 1991. At the time of the 1990 to 1991 recession, the S&P 500 (SPY) declined -19.61% and the Nasdaq Composite Index declined –29.90%.
However, The stock market typically leads the call of a recession by topping out first. this suggests that potentially, the April 2, 2012 high for the Dow Industrials was the top and we're now in a declining trend at least until August/September 2012 to 10,611.59.
Again, our preliminary prediction is that if we see a second month of declines in the Industrial Production Index while the Dow Theory bear market indication is in place, we’ll have what will be considered a recession by the NBER which would be announced from 9 months to a year after the fact.
As a sidebar to the discussion of the possibility of a recession, the long-term gold stock positions that we've recently recommended which includes Agnico-Eagle (AEM), Gold Fields Ltd. (GFI) and Newmont Mining (NEM) will require reduced exposure or sold off since gold and silver stocks tend to perform worse than the general stock market during a recession.
Note: Industrial Production Index data is subject to constant revisions by the Federal Reserve Bank. We hope to reassess the Industrial Production Index based on the most updated information that is provided by the Federal Reserve.
“The coming market volatility will provide great opportunities for traders and allow investors a chance to cash out of otherwise undesirable positions and take profits. Our expectation is that the Dow will go to the July 2011 highs before struggling at the May 2011 highs.”
Posted in bear market rally targets, Dow Theory, Industrial Production Index
Tagged members

Posted in bear market rally targets, Dow Theory