Below is a chart of Applied Materials (AMAT) from 1981 to 2019 reflecting the year-over-year (YoY) percentage change.
- Japan
- Market Indicator
- Price Momentum Indicators
- Richard Russell
- Silver
- Speed Resistance Lines
- U.S. Dividend Watch List

Below is a chart of Applied Materials (AMAT) from 1981 to 2019 reflecting the year-over-year (YoY) percentage change.
Below are the valuation targets for Applied Materials (AMAT) for the next 10 years. Continue reading
Performance Review
Below is the one year performance of the stock on our watch list from May 8, 2015:
| symbol | Name | 2015 | 2016 | % chg |
| GRMN | Garmin Ltd. | 45.94 | 42.25 | -8.03% |
| FOSL | Fossil Group, Inc. | 79.62 | 27.83 | -65.05% |
| KLAC | KLA-Tencor Corporation | 59.8 | 72.7 | 21.57% |
| FOXA | Twenty-First Century Fox | 32.79 | 28.85 | -12.02% |
| NWSA | News Corporation | 15.14 | 11.93 | -21.20% |
| AMAT | Applied Materials, Inc. | 19.69 | 24.28 | 23.31% |
| NTAP | NetApp, Inc. | 35.65 | 25.45 | -28.61% |
| SNDK | SanDisk Corp. | 67.72 | 76.18 | 12.49% |
| MU | Micron Technology, Inc. | 27.18 | 12.63 | -53.53% |
| FAST | Fastenal Company | 42.72 | 45.99 | 7.65% |
| ALXN | Alexion Pharmaceuticals | 163.02 | 151.12 | -7.30% |
| WYNN | Wynn Resorts Ltd. | 117.84 | 96.81 | -17.85% |
| DTV | DIRECTV | 89.38 | 93.55 | 4.67% |
| DISCA | Discovery Communications | 31.33 | 27.88 | -11.01% |
The performance of the Watch List from last year averaged a loss of –11.06% which was well below the Nasdaq 100 Index change of +1.71% over the same period of time. The stock that gained the most was Applied Material (AMAT) while the stock that declined the most was Fossil Group (FOSL) with a loss of –65.05%.
Analysts were able to accurately forecast the general direction of 71% of the watch list stocks, a fairly high level of success not normally seen.

On December 6, 2012, we said the following of our Nasdaq 100 Watch List:
“We’ve highlighted the chip sector stocks to put emphasis on the fact that, as an industry group, the sector may be at or near a low.”
After a year and a half, the chip sector stocks have achieved all that we had anticipated when we wrote about them in late December 2012. As seen in the chart below, all of the stocks except Altera (ALTR) achieved gains that beat the Nasdaq Composite growth of +46.22% in the same period.

The chip sector does run on a cycle and it is our belief that while this may not be the top it is time to sell the principal in those stocks that have had a decent run. The profit portion should be allowed to compound until new relative lows are achieved.
We’ve been fortunate to successfully identify two chip sector cycles lows on March 20, 2010 and December 6, 2012. As we have in the past, we will notify subscribers of investment opportunities at the next cycle low. Investors may want to consider rotating into sectors that we’ve identified as worth accumulating using the proceeds from the sell of chip sector stocks.
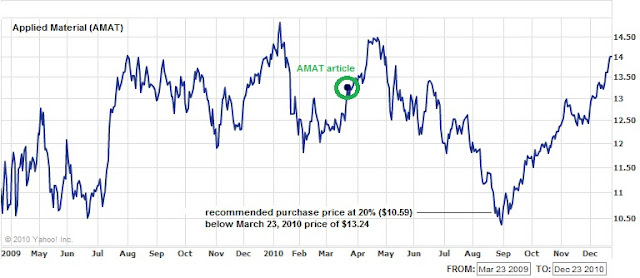
“For anyone who believes that this is an opportunity that can't be missed, I recommend allocating 15% of your portfolio into this name. On top of that, do a two part purchase. First buy 7.5% now and if the shares fall another 20% buy the remaining 7.5% later. This way, the cost basis of the stock would require only a 10% rise to break even. Again, it is not likely that we'll buy AMAT since the alternatives provide exceptional opportunity with less downside risk.”
Watch List Summary
Performance Review
 |
| *chart does not reflect dividend reinvestment for PPDI |
Nasdaq 100 Watch List
| Symbol | Name | Price | P/E | EPS | Yield | P/B | % from Low |
| PAYX | Paychex, Inc. | 25.95 | 19.67 | 1.32 | 4.80% | 6.67 | 5.27% |
| INTC | Intel Corporation | 18.81 | 11.26 | 1.67 | 3.40% | 2.3 | 6.87% |
| AMAT | Applied Materials, Inc. | 11.02 | 24.44 | 0.45 | 2.50% | 2.03 | 7.33% |
| YHOO | Yahoo! Inc. | 13.89 | 22.77 | 0.61 | N/A | 1.59 | 7.34% |
| MXIM | Maxim Integrated Products, Inc. | 16.91 | 41.86 | 0.4 | 5.00% | 2.15 | 7.91% |
| GILD | Gilead Sciences, Inc. | 34.56 | 10.47 | 3.3 | N/A | 4.58 | 8.93% |
| ATVI | Activision Blizzard, Inc | 10.82 | 41.94 | 0.26 | 1.30% | 1.21 | 8.96% |
| DELL | Dell Inc. | 12.45 | 15.74 | 0.79 | N/A | 3.92 | 9.80% |
| RIMM | Research In Motion Limited | 46.72 | 10.24 | 4.56 | N/A | 3.2 | 9.85% |
| AMGN | Amgen Inc. | 55.22 | 11.73 | 4.71 | N/A | 2.28 | 9.87% |
| DISH | DISH Network Corporation | 18.77 | 11.26 | 1.67 | N/A | N/A | 10.02% |
| CSCO | Cisco Systems, Inc. | 21.86 | 16.46 | 1.33 | N/A | 2.82 | 10.31% |
| XRAY | DENTSPLY International Inc. | 30.66 | 16.55 | 1.85 | 0.70% | 2.6 | 10.45% |
| MSFT | Microsoft Corporation | 25.22 | 12 | 2.1 | 2.10% | 4.76 | 10.95% |
| SPLS | Staples, Inc. | 19.49 | 17.26 | 1.13 | 1.80% | 2.2 | 11.69% |
| PDCO | Patterson Companies Inc. | 27.15 | 14.67 | 1.85 | 1.50% | 2.3 | 12.52% |
| SHLD | Sears Holdings Corporation | 66.83 | 27.38 | 2.44 | N/A | 0.9 | 12.87% |
| GOOG | Google Inc. | 490.15 | 21.29 | 23.03 | N/A | 3.77 | 13.03% |
| LIFE | Life Technologies Corporation | 46.51 | 29.91 | 1.56 | N/A | 1.97 | 13.16% |
| STX | Seagate Technology. | 11.16 | 3.55 | 3.14 | N/A | 1.95 | 13.41% |
| FLIR | FLIR Systems, Inc. | 27.24 | 18.52 | 1.47 | N/A | 3.25 | 13.50% |
| GRMN | Garmin Ltd. | 29.64 | 8.95 | 3.31 | 5.10% | 2.21 | 13.52% |
| TEVA | Teva Pharmaceutical Industries | 53.48 | 19 | 2.82 | 1.20% | 2.48 | 13.81% |
| FLEX | Flextronics International Ltd. | 5.55 | 15.72 | 0.35 | N/A | 2.26 | 14.20% |
| COST | Costco Wholesale Corporation | 61.29 | 21.93 | 2.8 | 1.30% | 2.43 | 14.75% |
| HSIC | Henry Schein, Inc. | 56.35 | 15.82 | 3.56 | N/A | 2.31 | 14.77% |
| CERN | Cerner Corporation | 79.18 | 31.31 | 2.53 | N/A | 3.83 | 14.85% |
| CELG | Celgene Corporation | 55.25 | 29.99 | 1.84 | N/A | 5.11 | 15.06% |
| CA | CA Inc. | 20.44 | 13.43 | 1.52 | 0.80% | 2.02 | 15.48% |
| ERTS | Electronic Arts Inc. | 16.26 | N/A | -1.06 | N/A | 1.96 | 15.63% |
| VRTX | Vertex Pharmaceuticals Incorpor | 36.25 | N/A | -3.53 | N/A | 9.01 | 16.00% |
| KLAC | KLA-Tencor Corporation | 31.05 | 25.31 | 1.23 | 3.30% | 2.32 | 16.34% |
| STLD | Steel Dynamics, Inc. | 15.01 | 15.73 | 0.95 | 2.00% | 1.58 | 16.45% |
| WCRX | Warner Chilcott plc | 22.75 | 11.2 | 2.03 | N/A | 2.82 | 16.55% |
| LOGI | Logitech International S.A. | 15.39 | 22.57 | 0.68 | N/A | 2.68 | 16.86% |
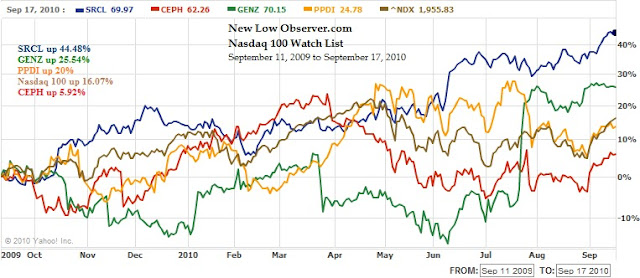
| CEPH | Cephalon, Inc. | 62.26 | 12.48 | 4.99 | N/A | 2.09 | 17.36% |
| URBN | Urban Outfitters, Inc. | 34.11 | 22.19 | 1.54 | N/A | 4.26 | 18.85% |
| FWLT | Foster Wheeler AG. | 24.19 | 10.8 | 2.24 | N/A | 3.46 | 18.99% |
| FISV | Fiserv, Inc. | 53.56 | 17.16 | 3.12 | N/A | 2.57 | 19.55% |
| JBHT | J.B. Hunt Transport Services, I | 35.26 | 26.73 | 1.32 | 1.40% | 7.56 | 19.73% |
| CTAS | Cintas Corporation | 27.71 | 19.64 | 1.41 | 1.70% | 1.67 | 19.96% |
Because this was a cursory review of AMAT in response to a question, we recommend that you verify all data before taking a position either long or short. We are considering a full review of the chip sector to be posted on this site in the future.
Below are the Nasdaq 100 companies that are within 20% of the 52-week low.
| Symbol | Name | Price | P/E | EPS | Yield | P/B | % from Low |
| QCOM | QUALCOMM | 40.05 | 32.14 | 1.25 | 1.70% | 3.17 |
12.94%
|
| FSLR | First Solar, Inc. | 113.3 | 15.05 | 7.53 | N/A | 3.65 |
14.78%
|
| GILD | Gilead Sciences, Inc. | 47.87 | 16.96 | 2.82 | N/A | 6.7 |
15.88%
|
| ERTS | Electronic Arts Inc. | 18.42 | N/A | -2.31 | N/A | 2.33 |
17.32%
|
| ATVI | Activision Blizzard, Inc | 11.82 | 139.06 | 0.09 | 1.30% | 1.39 |
20.00%
|
Nasdaq 100 Watch List Summary
Before pursuing any of these companies, be sure to verify the dividend history as well as the earnings capacity to pay the dividend (more commonly known as payout ratio).
| Symbol | Company | Price | P/E | EPS | Yield | P/B | % from low |
| MCHP | Microchip Technology | 28.25 | 31.6 | 0.89 | 4.80% | 3.53 | 43.69% |
| MXIM | Maxim Integrated Prod. | 19.14 | 71.69 | 0.27 | 4.20% | 2.31 | 48.49% |
| PAYX | Paychex, Inc. | 32.17 | 23.52 | 1.37 | 3.90% | 8.43 | 39.87% |
| LLTC | Linear Technology | 28.36 | 24.22 | 1.17 | 3.20% | N/A | 39.98% |
| ADP | ADP | 44.6 | 16.57 | 2.69 | 3.00% | 3.91 | 34.10% |
| INTC | Intel Corporation | 21.99 | 28.41 | 0.77 | 2.90% | 2.94 | 53.26% |
| PPDI | Pharma Prod. Dev. | 22.71 | 16.94 | 1.34 | 2.60% | 1.98 | 26.38% |
| XLNX | Xilinx, Inc. | 26.6 | 24.43 | 1.09 | 2.40% | 3.68 | 46.48% |
| AMAT | Applied Materials, Inc. | 12.49 | N/A | -0.07 | 2.20% | 2.37 | 23.91% |
| CMCSA | Comcast Corp. | 17.53 | 13.9 | 1.26 | 2.20% | 1.17 | 40.35% |
| KLAC | KLA-Tencor Corp. | 28.79 | N/A | -0.39 | 2.10% | 2.25 | 49.25% |